At this point, most of you are aware that a single HRV (lnRMSSD) score taken in isolation does not necessarily imply or reflect an acute change in performance, fatigue, recovery, etc (though it may sometimes).
Here’s why:
Below are two separate HRV trends I pulled from a training cycle I did last year at week 1 and week 8.
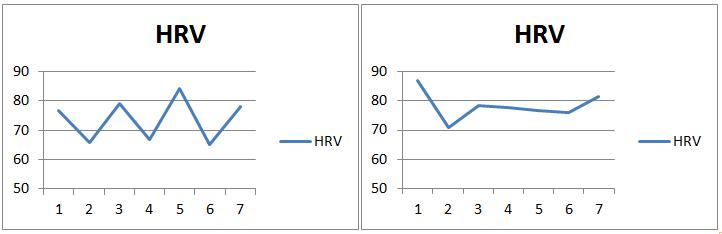
If someone were taking once per week recordings, or pre and post training phase recordings on isolated days, you can see how they can get entirely different results based on which day they measured. Suppose measures were taken on Friday’s from the above trends. These values are 84 and 76.7, respectively. However, if we look at the weekly mean values, we would get 73.6 and 78.3. From the isolated readings, one would conclude that HRV decreased nearly 10 points. However, the weekly mean shows an entirely different change (HRV actually increased from 73.6 to 78.3). Therefore, it’s quite clear that when averaged weekly, HRV scores allow for more meaningful interpretation.
| Isolated Measure (Friday) | Weekly Mean | |
| Week 1 | 84 | 73.6 |
| Week 8 | 76.7 | 78.3 |
See the following papers for more on weekly mean vs. isolated recordings (Le Meur et al. 2013; Plews et al. 2012; Plews et al. 2013)
One limitation of the weekly mean value is that is does not reflect the fluctuation in scores throughout the 7 day period. A simple way of determining this is to calculate the coefficient of variation (CV) from the 7 day HRV values (see Plews et al. 2012 for more on CV).
The coefficient of variation is calculated as follows;
CV = (Standard Deviation/Mean)x100
Below is 9 weeks worth of data from a training cycle I performed early last year that resulted in some personal records (PR’s) and was discussed in this post. This time, in addition to the weekly mean values I have also calculated the CV for each week.

Without going into too much detail about the training cycle (see the original post for that), I will highlight a few keep observations.
| HRV Avg | HRV CV | Brief Notes |
| 73.6 | 7.5 | 1st week after detraining, Good |
| 77.4 | 5.6 | Good |
| 77.5 | 2.3 | Good |
| 76.2 | 5.7 | Stress, poor sleep, deload |
| 79.37 | 3.0 | Good |
| 79.7 | 4.0 | Good |
| 77.9 | 11.4 | Stressful week |
| 77.8 | 6.8 | ↑ intensity, ↓ Volume, Good |
| 78.2 | 4.8 | PR(1RMs) |
| 81.1 | 4.7 | Deload, Good |
Below are the HRV trends from Week 1 – 4 of the cycle.

Week 1 was my first week training after about 10 days off from lifting (Christmas holidays). Clearly the trend from week 1 reflects the fatigue and recovery as I lifted on M W F that week. On week 2 I performed the same workouts on the same days but with a little more weight for each set. However, it appears (based on CV) that this may have been less stressful. In week 3, I moved to lifting 4 days/week with moderate loads and CV decreases further. Interestingly, the following week (week 4), the weights feel heavy, I feel pretty rough and I take an unplanned deload (CV increases, mean decrease).
Further analysis of the CV and weekly mean can include calculating the smallest worthwhile change (see Buchheit, 2014) to see if a change is practically meaningful. (Will do this in the future once I figure out how to display SWC on a chart).
The point of this post was to introduce the CV concept for those who may not be familiar. I believe that the CV likely provides information regarding stress, fatigue and adaptation that the weekly mean may not reflect. Therefore, the CV and mean values should be considered together.
References:
Buchheit, M. (2014). Monitoring training status with HR measures: do all roads lead to Rome? Frontiers in physiology, 5. http://journal.frontiersin.org/Journal/10.3389/fphys.2014.00073/full
Le Meur, Y., Pichon, A., Schaal, K., Schmitt, L., Louis, J., Gueneron, J., … & Hausswirth, C. (2013). Evidence of parasympathetic hyperactivity in functionally overreached athletes. Medicine and Science in Sports and Exercise, 45(11), 2061-2071.
Plews, D. J., Laursen, P. B., Kilding, A. E., & Buchheit, M. (2012). Heart rate variability in elite triathletes, is variation in variability the key to effective training? A case comparison. European journal of applied physiology, 112(11), 3729-3741.
Plews, D. J., Laursen, P. B., Kilding, A. E., & Buchheit, M. (2013a). Evaluating training adaptation with heart-rate measures: a methodological comparison. International Journal of Sports Physiology & Performance, 8(6).

Question regarding sympathetic & parasympathetic frequency domain.
I’m male, 52 years old and my baseline recovered HRV is about the low 70’s.
Using emwave2 to get the RR then import to Kubios to get HRV log(rmssd)
Which one would you used in the Frequency Domain that show accurately whether you are sympathetic or parasympathetic dominant ? FFT Spectrum or AR Spectrum ?
I use AR Spectrum to quantify my state.
Which do you consider sympathetic or parasympathetic for that matter ? VLF, LF or HF ?
Typical baseline for me:
HRV: 73.33
VLF: 19.70 %
LF: 73.96 %
HF: 6.31 %
LF/HF Ratio: 11.72
Would you consider this sympathetic or parasympathetic dominant ?
thanks in advance
Butch
Butch,
I personally do not regularly monitor spectral measures, generally only lnRMSSD. Though there are several papers that discuss the disagreement between what HF and LF represent, see this recent paper by my colleague James Heathers on some of the issues with Frequency analysis “Everything Hertz: methodological issues in short-term frequency-domain HRV.” http://journal.frontiersin.org/Journal/10.3389/fphys.2014.00177/abstract (The link appears to be down, but google it again soon once they fix whatever the issue is).
It is generally thought that HF represents parasympathetic activity while LF represents both Parasympathetic and Sympathetic activity, however, further reading into the literature will show you that this actually isn’t quite so clear.
To sum, I am not the best person to consult regarding frequency domain measures.
thanks for the response.
“It is generally thought that HF represents parasympathetic activity while LF represents both Parasympathetic and Sympathetic activity”
That is what I’ve been assuming for sometime now and that VLF us sympathetic BUT I was listening to a podcast interview of Rhonda the founder of sweetbeat and see eluded the LF was just sympathetic which threw me on the loop because I’ve been tracking my HRV for the last six months on a DAILY basis and my LF is always dominant compared to VLF.
She also said that HRV between 65-75 are seen on sedentary folks. Not sure how Sweetbeat is computing HRV. Also, I believed that age should be factored in for HRV range.
I have a question about the formula: CV = (Standard Deviation/Mean)x100
What is the sample population (size) for the mean and standard deviation? Can I assume this is a rolling 1 week period? In other words, If you recorded your HRV 3 days a week, then the last three samples would be input for the deviation and mean?
Just a note: My understanding of statistics suggests that this small sample size would result in greater standard error and more volatility in the CV outcome (although a daily sample – i.e. 7 days a week – might help smooth the trend).
Thanks in advance.
Hi David,
Mean and SD were calculated from 7 days (Mon-Sun) for each week individually.
My colleague and I have a paper in production comparing 7-day (Mon-Sun), 5-day (Mon-Fri) and 3-day (Mon-Wed-Fri) mean and CV in a collegiate female soccer team over several weeks of training with variation in training load, wellness scores, etc. Should help shine some light on how few days we can get away with monitoring HRV.
A related paper, in case you’ve not seen it, though CV not included in analysis. Minimum days per week for valid HRV assessment of week mean is dependent on training status, at least for endurance athletes. http://scholar.googleusercontent.com/scholar?q=cache:WtX2Tr2eOIEJ:scholar.google.com/+HRV+how+much+compliance&hl=en&as_sdt=0,5