Background:
Following a ~2-week family trip, I was relatively detrained. As expected, my standing HRV trend worsened while away with lower and less stable values, reflecting reduced fitness, travel effects, routine change, etc. For my latest n=1 experiment, I decided to track my fitness improvement as I progressively resumed training when I returned home. With increases in aerobic fitness, HRV typically improves by increasing and becoming more stable. I track both nocturnal HRV and post-waking HRV in the standing position. Which of these two is more sensitive to my change in fitness?
What did I do?
I compared associations between my submaximal exercise heart rate at a fixed intensity (HRex, an indicator of aerobic fitness) and both nocturnal and standing RHR and HRV over a 4-week period.
Note: All tools used for this self-experiment were wearable devices that I validated on myself (examples below). However, the accuracy of a device can vary from person to person depending on various factors. For example, many HRV apps show greater error with higher HRV values. Additionally, HRex from a wearable is often less accurate at higher intensities, in less stable conditions, in cold weather, etc. Thus, I encourage everyone to test the accuracy of your own device if you’re able to do so. Otherwise, refer to published agreement studies.
Why did I do it?
My nocturnal and standing HRV often show divergent patterns. If I were to guide training with HRV, which should I focus on? I’ve written about this issue extensively. Here’s a previous example comparing my nocturnal HRV vs. standing HRV during and after COVID-19 infection.
How did I do it?
HRex: I measured HRex during a 20-min treadmill walk (3.7 mph, 1.5% grade, ~50-60% HRmax) every morning at ~7 AM. HRex was measured with the Polar Vantage V3. The mean HR from the last 3 min of each session was used to determine HRex via Polar Flow. I previously compared the Vantage V3 vs. Polar H10 during various exercise sessions and found near identical average HRex values (within 1 bpm, example from treadmill walk below).

Nocturnal Values: Nocturnal HR and HRV (RMSSD) were measured with Oura Ring 4. I previously compared Oura to ECG during a night of sleep and found good agreement (2 ms difference, image below). One outlier sleep HRV value was removed (very high RMSSD, 106 ms spike vs ~70 ms average) which occurred with frequent breathing disturbances reported in the app (i.e., episode of sleep apnea, which happens when I overeat with a later dinner time).

Standing Values: Standing HR/HRV were measured after waking, peeing, and logging body mass. I used the Kubios HRV app paired with a Polar Verity Sense worn around the forearm. The sample duration was 1 min. I compared simultaneous HRV measurements performed with the Vertiy Sense and H10 via the Kubios app and found good agreement. Here is an example comparison below using Kubios software.

What did I find regarding trends over time?
HRex: Consistent with a progressive increase in aerobic fitness, HRex tended to decrease over time.
Nocturnal HRV: Consistent with a progressive increase in aerobic fitness, sleep HR tended to decrease over time. However, inconsistent with fitness improvement, sleep HRV tended to decrease over time.
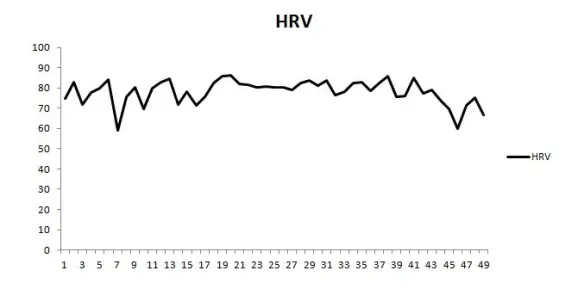
Standing HRV: Standing HR tended to decrease over time and standing HRV tended to increase over time. Each as expected with an increase in fitness. Figures below showing trends for all parameters across time.

What did I find regarding associations between HRex and HR/HRV values?
Nocturnal Values: Sleep HR was associated with HRex (r = 0.58) in the expected direction, such that when sleep HR was lower, HRex also tended to be lower. Sleep HRV was not strongly associated with HRex and the slope was directionally opposite of what one would expect (r = 0.25). This means that when sleep RMSSD was higher, HRex tended to be higher. Figure below for nocturnal values.

Standing Values: The association between standing HR and HRex was directionally as expected (lower HR associated with lower HRex) but not very strong (r = 0.32). Standing HRV was associated with HRex in the expected direction (r = -0.64), indicating that higher standing HRV was associated with lower HRex. Standing HRV provided the strongest correlation coefficient with HRex. Figure below for standing values.

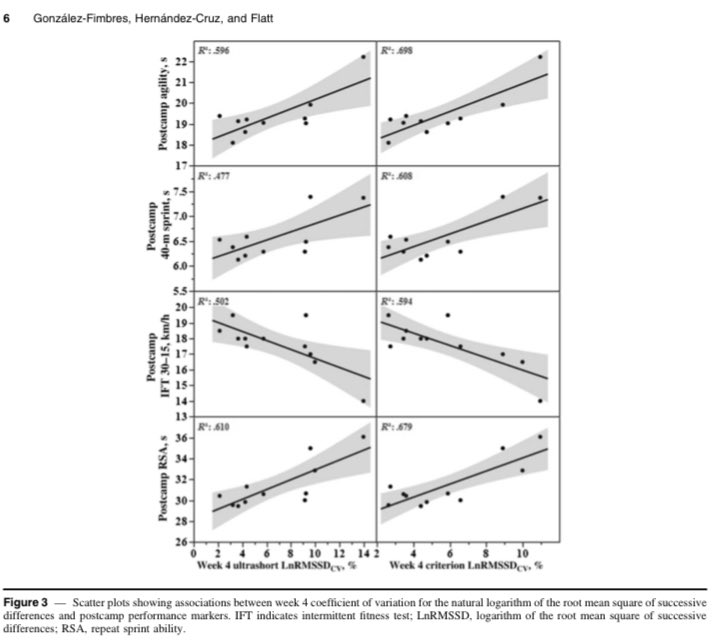
A strong correlation between my standing RMSSD and HRex is consistent with a previous case study we published in a pro soccer player who showed a similar association with seated upright RMSSD and the heart rate-running speed index (effectively, HRex). See scatter plot below. It didn’t matter if we used a 1 min or a 5 min HRV measure, the associations were the same.

What’s going on with sleep HRV?
My sleep HR was consistently <55 bpm. When HR drops below this threshold, HRV often diminishes. This is because cholinergic receptors on the heart become saturated at very high levels of cardiac parasympathetic activity (i.e. high parasympathetic activity = high vagal discharge of acetylcholine). As a result, phasic modulation decreases, leading to reduced beat-to-beat variability. In the figure below, you can see that the association between sleep HR and RMSSD is counterintuitively positive rather than negative. As my sleep HR decreased, RMSSD decreased as well. Contrastingly, as standing HR decreased, RMSSD increased.


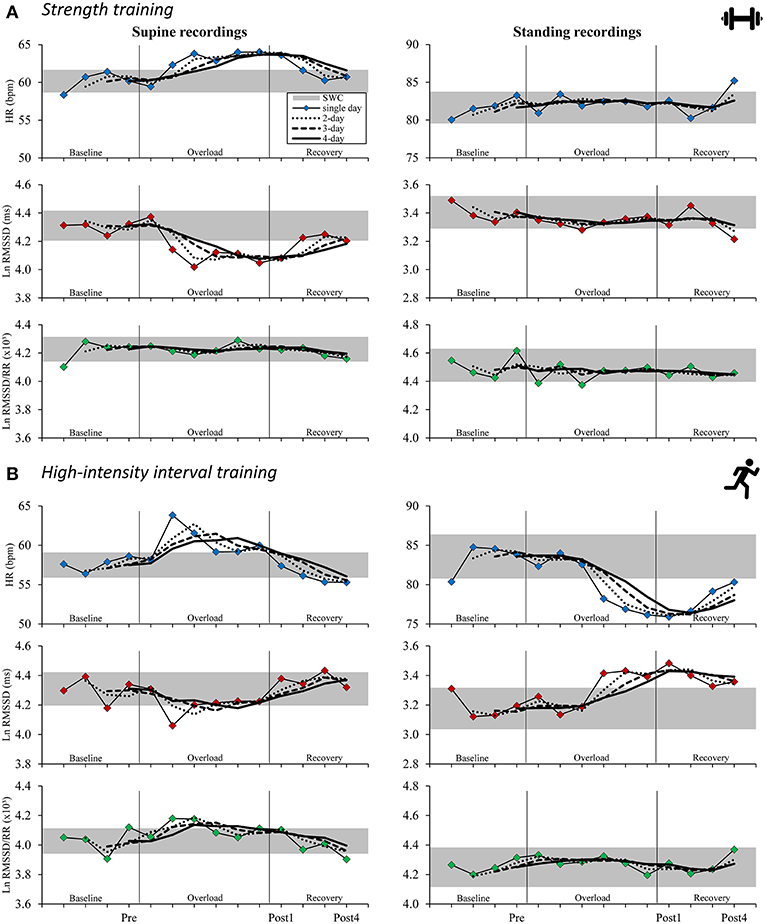
Parasympathetic saturation is a well documented effect. In fact, the very first studies to compare HRV-guided versus pre-planned training by Kiviniemi et al. (2007, 2010) intentionally used standing HRV measures to counteract potential saturation effects that commonly occur when lying down. See screenshots below from the Methods sections.


Therefore, If your sleep HR is <55 bpm, I would strongly encourage you to create a scatter plot of your HR and HRV to determine if this applies to you. It’s critically important to understand that in cases of saturation, HRV does not reflect parasympathetic activity.
I believe there are also other reasons to opt for standing HRV over nocturnal HRV (discussed here).
Conclusion
There was a tendency for greater cardiac efficiency during exercise when standing HRV was higher. Conversely, there was a tendency for greater internal load in response to a fixed stimulus when standing HRV was reduced.
Considering that I cannot use sleep HRV to reliably reflect cardiac-parasympathetic activity due to saturation, and that standing HRV provided the strongest association with HRex, I will continue to use standing HRV as my primary metric.