New Study: Agreement between a smart-phone pulse sensor application and ECG for determining lnRMSSD

Here’s a brief overview of our latest study, in press with JSCR.  We compared the ithlete finger sensor with ECG in supine, seated and standing positions. We are continuing our testing with other popular smartphone HRV apps in the near future. Thanks to the Summer 2015 Alabama S&C interns for making up a large portion of the participants in this study.

Full text link:

Agreement between a smart-phone pulse sensor application and ECG for determining lnRMSSD

ABSTRACT

The purpose of this study was to determine the agreement between a smartphone pulse finger sensor (SPFS) and electrocardiography (ECG) for determining ultra-short-term heart rate variability (HRV) in three different positions. Thirty college-aged men (n = 15) and women (n = 15) volunteered to participate in this study. Sixty second heart rate measures were simultaneously taken with the SPFS and ECG in supine, seated and standing positions. lnRMSSD was calculated from the SPFS and ECG. The lnRMSSD values were 81.5 ± 11.7 via ECG and 81.6 ± 11.3 via SPFS (p = 0.63, Cohen’s d = 0.01) in the supine position, 76.5 ± 8.2 via ECG and 77.5 ± 8.2 via SPFS (p = 0.007, Cohen’s d = 0.11) in the seated position, and 66.5 ± 9.2 via ECG and 67.8 ± 9.1 via SPFS (p < 0.001, Cohen’s d = 0.15) in the standing positions. The SPFS showed a possibly strong correlation to the ECG in all three positions (r values from 0.98 to 0.99). In addition, the limits of agreement (CE ± 1.98 SD) were -0.13 ± 2.83 for the supine values, -0.94± 3.47 for the seated values, and -1.37 ± 3.56 for the standing values. The results of the study suggest good agreement between the SPFS and ECG for measuring lnRMSSD in supine, seated, and standing positions. Though significant differences were noted between the two methods in the seated and standing positions, the effect sizes were trivial.

Full Text on Research Gate

FS EKG data

New Study: Individual HRV responses to preseason training in D-1 women’s soccer players

Here’s a brief look at a new paper of ours in press with JSCR. This is a very small study that we submitted as “Research Note” that looked at changes in HRV (via finger pulse sensor) and training load (via Polar Team2) across preseason training in D-1 women’s soccer players.

Full text link:

Individual HRV responses to preseason training in D-1 women’s soccer players

The purpose of this study was to track changes in training load (TL) and recovery status indicators throughout a 2-week preseason and to interpret the meaning of these changes on an individual basis among 8 Division-1 female soccer players. Weekly averages for heart ratevariability (lnRMSSD), TL and psychometrics were compared with effect sizes (ES) and magnitude based inferences. Relationships were determined with Pearson correlations. Group analysis showed a very likely moderate decrease for total training load (TTL) (TTL week 1 = 1203 ± 198, TTL week 2 = 977 ± 288; proportion = 1/2/97, ES = -0.93) and a likely small increase in lnRMSSD (week 1 = 74.2 ± 11.1, week 2 = 78.1 ± 10.5; proportion = 81/14/5, ES = 0.35). Fatigue demonstrated a very likely small improvement (week 1 = 5.03 ± 1.09, week 2 = 5.51 ± 1.00; proportion = 95/4/1; ES = 0.45) while the other psychometrics did not substantially change. A very large correlation was found between changes in TL and lnRMSSD (r = -0.85) while large correlations were found between lnRMSSD and perceived fatigue (r = 0.56) and soreness (r = 0.54). Individual analysis suggests that 2 subjects may benefit from decreased TL, 2 subjects may benefit from increased TL and 4 subjects may require no intervention based on their psychometric and lnRMSSD responses to the TL. Individual weekly changes in lnRMSSD varied among subjects and related strongly with individual changes in TL. Training intervention based on lnRMSSD and wellness responses may be useful for preventing the accumulation of fatigue in female soccer players.

FS_JSCR

Full Text on Research Gate

New Study: Interpreting daily HRV changes in female soccer players

Here’s a quick look at our latest study published ahead of print in the Journal of Sports Medicine and Physical Fitness. Below is the abstract and some brief comments about the findings.

Full text link:

Interpreting daily heart rate variability changes in collegiate female soccer players

BACKGROUND: Heart rate variability (HRV) is an objective physiological marker that may be useful for monitoring training status in athletes. However, research aiming to interpret daily HRV changes in female athletes is limited. The objectives of this study were (1) to assess daily HRV (i.e., log-transformed root mean square of successive R-R interval differences, lnRMSSD) trends both as a team and intra-individually in response to varying training load (TL) and (2) to determine relationships between lnRMSSD fluctuation (coefficient of variation, lnRMSSDcv) and psychometric and fitness parameters in collegiate female soccer players (n=10).

METHODS: Ultra-short, Smartphone-derived lnRMSSD and psychometrics were evaluated daily throughout 2 consecutive weeks of high and low TL. After the training period, fitness parameters were assessed.

RESULTS: When compared to baseline, reductions in lnRMSSD ranged from unclear to very likely moderate during the high TL week (effect size ± 90% confidence limits [ES ± 90% CL] = -0.21 ± 0.74 to -0.64 ± 0.78, respectively) while lnRMSSD reductions were unclear during the low TL week (ES ± 90% CL = -0.03 ± 0.73 to -0.35 ± 0.75, respectively). A large difference in TL between weeks was observed (ES ± 90% CL = 1.37 ± 0.80). Higher lnRMSSDcv was associated with greater perceived fatigue and lower fitness (r [upper and lower 90% CL] = -0.55 [-0.84, -0.003] large, -0.65 [-0.89, -0.15] large).

CONCLUSIONS: Athletes with lower fitness or higher perceived fatigue demonstrated greater reductions in lnRMSSD throughout training. This information can be useful when interpreting individual lnRMSSD responses throughout training for managing player fatigue.

The idea of evaluating relationships between the coefficient of variation of lnRMSSD  (lnRMSSDcv) with fitness parameters was inspired by a 2010 paper by Martin Buchheit et al. In that study,  greater lnRMSSDcv derived from post-submaximal exercise recordings negatively correlated with maximum aerobic speed in youth soccer players. We had similar findings in our current paper where we observed large negative relationships between lnRMSSDcv (derived from waking, ultra-short smartphone  recordings) and VO2max and Yo-Yo IRT-1.

Another objective of this study was to focus on individual HRV responses in addition to group responses (see figure below). An interesting observation we made was that greater lnRMSSDcv was also associated with higher perceived fatigue. This finding is in contrast to a recent case comparison study by Plews et al. that found a decreased lnRMSSDcv to be associated with non-functional overreaching in an elite triathlete. However, this can possibly be explained by the severity of fatigue. For example, the decreased lnRMSSDcv observed in the triathlete was accompanied with a chronically suppressed lnRMSSDmean. Thus, lnRMSSD decreased and did not periodically return to baseline.

In our current study, large decreases in lnRMSSD typically returned to baseline after 24-72 hours. Thus, loads were not so high that the athletes were unable to return to baseline. Therefore, it is possible that there may be a progression in one’s HRV trend leading from moderately fatigued to severely fatigued that is characterized first by a greater lnRMSSDcv (reflecting fatigue and recovery process) followed by chronic suppression of lnRMSSD with no rebounding to baseline (reduced lnRMSSDmean and reduced lnRMSSDcv). More on this to come.

Figure interpreting daily HRV

HRV monitoring for strength and power athletes

This article is a guest post for my colleague, Dr. Marco Altini’s website. Marco is the creator of the HRV4training app that enables HRV measures to be performed with no external hardware (e.g., HR strap), just the camera/flash of your smartphone and your finger tip. He has several archived articles pertaining to HRV measurement procedures and data analysis from compiled user data that are well worth checking out.

The intro is posted below. Follow the link to read the full article.

Intro

​A definitive training program or manual on how to improve a given physical performance quality in highly trained individuals of any sport does not exist. Nor will it ever. This is because of (at least) two important facts:

  1. High inter-individual variability exists in how individuals respond to a given program.
  2. The performance outcome of a training program is not solely dependent on the X’s and O’s of training (i.e., sets, reps, volume, intensity, work:rest, frequency, etc.) but also largely on non-training related factors that directly affect recovery and adaptation.

The closest we’ll get to such a definitive training approach, (in my opinion) may be autoregulatory training. This concept accepts the 2 facts listed above and attempts to vary training accordingly in attempt to optimize the acute training stimulus to match the individual’s current performance and coping ability.

Improvements in physical performance are the result of adhering to sound training principles rather than strict, standardized training templates. A thorough understanding of sound training principles enables good coaches and smart lifters to make necessary adjustments to a program when necessary to maintain continued progress. In other words, good coaches can adapt the training program to the athlete rather than making the athlete to try and adapt to the program. This is the not so subtle difference between facilitating adaptation and trying to force it.

The theme of this article is not about traditional training principles, but rather about recovery and adaptation concepts that when applied to the process of training, can help avoid set-backs and facilitate better decision-making with regards to managing your program. Given that this site is about HRV, naturally we’re going to focus on how daily, waking measures of HRV with your Smartphone may be useful in this context. For simplicity, we will focus on one HRV parameter called lnRMSSD which reflects cardiac-parasympathetic activity and is commonly used by most Smartphone applications. Drawing from research and real-life examples of how HRV responds to training and life-style factors, I hope to demonstrate how HRV can be used by individuals involved in resistance training-based sports/activities to help guide training.


Continue reading on the HRV4training site.

When do we intervene?

At what point should the coach or trainer implement a training or lifestyle intervention when an athlete is showing warning signs of excess fatigue?

This is easy to determine when looking back on the data retrospectively, but in real-time this can be a challenging question to answer. Especially when performance remains relatively stable during the early stages. There’s a sometimes blurry line between being too soft (changing the plan at every red flag) and being too hard (ignoring too many red flags).

In observing this athletes trend, it appears that the situation could’ve been easily avoided had some type of intervention been made early enough. The trend for HRV, and perceived measures of sleep quality, fatigue, soreness and stress all indicate that this athlete is heading for trouble.

downward trend

With poor sleep and high levels of training/non-training related stress the immune system is compromised and the athlete gets sick.

At what point do we intervene? Intervention starts with a conversation. The conversation acknowledges a red flag and helps determine what means of action to take (if any at all). In this situation, the first uncharacteristically low sleep rating should’ve started the conversation.

Effect of Water Ingestion on HRV: Implications for daily measures

One of the more challenging aspects of implementing HRV monitoring with athletes is ensuring that daily measures are performed reliably. Unreliable or inconsistent measurement procedures can lead to invalid data (false positives or false negatives) and therefore a misinterpretation of training and recovery status. With ultra-short HRV recordings (i.e., ~60 s) it is even more important that measures be strictly standardized to improve the quality of the data.

Waking measures are preferred to capture one’s HRV in a truly rested condition, before any external stimuli can confound the measure. A potential confounding variable that users should be aware of is the effect that water ingestion has on various physiological processes that stimulate autonomic activity and thus alter one’s HRV. This was brought to my attention several years ago by my colleague, Dr. James Heathers.

Immediate changes in HRV take place following water consumption that can last for up to 45 minutes or longer. For example, Routledge and colleagues1 tested the effects of 500 ml water ingestion on HRV in 10 healthy individuals between the ages of 24 and 34 years. On two separate occasions, the subjects reported to the lab in a randomized order for 500 ml water ingestion or 20 ml water ingestion (control). The experiments took place at 8 am before the subjects had anything to eat or drink and after bladder emptying. For a 30 minute period, subjects rested in a semi-supine position before water ingestion. HRV was determined from 5-min ECG windows immediately before and at 5, 20 and 35-min post water ingestion.

Resting HR on average was between 2 – 7 bpm lower than control throughout the post-consumption 45-min period. RMSSD increased between 8 -13 ms during this period compared to control which increased between 2 – 8.8 ms.

Experiment

Out of curiosity I conducted a similar but much smaller experiment (n=1) to see how HRV responded to 500 ml water ingestion. The data is analyzed in 5-min segments before and after drinking in the seated position with a 1-min period excluded from analysis during which the water was ingested. The tachogram and results are posted below.

water tachogram

Tachogram including pre and post water ingestion

pre water consumption

Pre

Post water results

Post

In Martin Buchheit’s, recent review paper, a 3% smallest worthwhile change for lnRMSSD is suggested. In this situation water consumption resulted in an increase in lnRMSSD nearly 2x the smallest worthwhile change.

results table water hrv

*Note that lnRMSSDx20 represents the modified HRV value provided by HRV app’s like ithlete. This has been highlighted for those who are only familiar with these values.

Why does water consumption increase HRV?

The autonomic responses to water ingestion appear to initially be due to the stimulation of osmoreceptors within the gut which causes vasoconstriction (a sympathetic response) and a slight increase in total peripheral resistance.2 Increased baroreceptor sensitivity and increased cardiac-vagal stimulation are thought to occur to counteract the pressor effect (increases in blood pressure) which is why we see a slowdown in resting HR and increase in HRV.2 Effects from the Renin-Angiotensin-Aldosterone system can also not be ruled out given their role in mediating body fluid levels that can effect cardiovascular responses. Water temperature may also have an effect as 250 ml of ice water appears to increase HRV to a greater extent than room-temperature water.3 This may be due to stimulation of thermal vagal receptors in the esophagus.3 Additionally, water ingestion following exercise has been shown to increase parasympathetic reactivation.4

Implications for Daily Monitoring

Tell your athletes to wait until after measuring their HRV to drink fluids and to do so consistently. Otherwise, values may be obscured with a false positive when they drink fluids before the measure.

References:

  1. Routledge, H.C., Chowdhary, S., Coote, J. H., & Townend, J. N. (2002). Cardiac vagal response to water ingestion in normal human subjects. Clinical Science103, 157-162.
  2. Brown, C. M., Barberini, L., Dulloo, A. G., & Montani, J. P. (2005). Cardiovascular responses to water drinking: does osmolality play a role?.American Journal of Physiology-Regulatory, Integrative and Comparative Physiology289(6), R1687-R1692.
  3. Chiang, C. T., Chiu, T. W., Jong, Y. S., Chen, G. Y., & Kuo, C. D. (2010). The effect of ice water ingestion on autonomic modulation in healthy subjects.Clinical Autonomic Research20(6), 375-380.
  4. Oliveira, T. P., Ferreira, R. B., Mattos, R. A., Silva, J. P., & Lima, J. R. P. (2011). Influence of water intake on post-exercise heart rate variability recovery.Journal of Exercise Physiology Online.

Interpreting HRV Trends in Athletes: High Isn’t Always Good and Low Isn’t Always Bad

This article was written for the FreelapUSA site. The intro is posted below. You can follow the link for the full article. Thanks to Christopher Glaeser from Freelap for inviting my contribution as I’ve found this site to be a great resource.

Interpreting HRV Trends in Athletes: High Isn’t Always Good and Low Isn’t Always Bad

Heart rate variability (HRV) monitoring has become increasingly popular in both competitive and recreational sports and training environments due to the development of smartphone apps and other affordable field tools. Though the concept of HRV is relatively simple, its interpretation can be quite complex. As a result, considerable confusion surrounds HRV data interpretation. I believe much of this confusion can be attributed to the overly simplistic guidelines that have been promoted for the casual-end, non-expert user.

In the context of monitoring fatigue or training status in athletes, a common belief is that high HRV is good and low HRV is bad. Or, in terms of observing the overall trend, increasing HRV trends are good, indicative of positive adaptation or increases in fitness while decreasing trends are bad, indicative of fatigue accumulation or “overtraining” and performance decrements. In this article I address the common notions of both acute and longitudinal trend interpretation, and discuss why and when these interpretations may or may not be appropriate. We will briefly explore where these common interpretations or “rules” have come from within the literature, and then discuss some exceptions to these rules.

Continue reading article on FreelapUSA

New study: Assessing shortened field-based HRV data acquisition in team-sport athletes

Our latest study “Assessing shortened field-based heart rate variability data acquisition in team-sport athletes” is now available ahead of print in IJSPP.

This project was a collaboration with Dr. Fabio Nakamura, Lucas Pereira, Dr. Irineu Loturco and Dr. Rodrigo Ramirez-Campillo. We have several more papers in production, in review and in press, so stay tuned for those.

This study expands on previous work of ours (link, link) that  assessed the agreement between ultra-short (60 s) HRV measures with standard 5 minute measures (following a 5 min stabilization period). This study differs from our previous work in a few key areas:

1. We assessed HRV (LnRMSSD) in the seated position here versus the supine position previously. Having to accommodate to the seated position may take longer than the supine position due to the vertical positioning and extra stress on the heart. Additionally, the seated position has been suggested in recent review papers to be the preferred position for athlete monitoring. Therefore, investigation into the time-course for HRV stabilization (i.e., how long must we wait to achieve a stable R-R signal), in addition to the agreement between ultra-short measures and the criterion (5 min post 5 min stabilization) segment from seated measures is required.

2. This study also evaluated the ratio between LnRMSSD and the R-R interval (LnRMSSD:R-R). Previous work has shown that highly fit athletes can demonstrate “parasympathetic saturation” which is characterized by a decrease in HRV despite very low resting heart rates. Daniel Plews et al. describe this phenomenon in their recent review paper: “The underlying mechanism is likely the saturation of acetylcholine receptors at the myocyte level: a heightened vagal tone may give rise to sustained parasympathetic control of the sinus node, which may eliminate respiratory heart modulation and reduce
HRV.”

3. In our previous studies we used an ECG for HRV analysis which is considered the gold standard, though not very practical for routine monitoring. In this study we used the Polar RS800,  a field tool heart rate monitor system that is more commonly used in practical settings.

4. Lastly, this study included elite level athletes whereas our previous work included collegiate athletes.

Our results show that the first 5 min LnRMSSD value (stabilization period) was not different than the criterion segment (mins 5-10). Additionally, we found that each isolated minute from the stabilization period (i.e., min 0-1, 1-2, 2-3, etc.) showed good agree with the criterion. Therefore, when 5 minute measures cannot be obtained due to time constraints or for compliance reasons, 60 s measures appear suitable for valid assessment, in agreement with our previous investigations.

In our next paper (in press) we assess if ultra-short LnRMSSD measures are sensitive to training effects in elite athletes.

Abstract
Purpose: The aims of this study was to compare the LnRMSSD and the LnRMSSD:RR values obtained during a 5-min stabilization period with the subsequent 5-min criterion period and to determine the time course for LnRMSSD and LnRMSSD:RR stabilization at 1-min analysis in elite team-sport athletes. Methods: Thirty-five elite futsal players (23.9 ± 4.5 years; 174.2 ± 4.0 cm; 74.0 ± 7.5 kg; 1576.2 ± 396.3 m in the YoYo test level 1), took part in this study. The RR interval recordings were obtained using a portable heart rate monitor continuously for 10-min in the seated position. The two dependent variables analyzed were the LnRMSSD and the LnRMSSD:RR. To calculate the magnitude of the differences between time periods, the effect size (ES) analysis was conducted. To assess the levels of agreement the intra-class correlation coefficient (ICC) and the Bland-Altman plots were used. Results: TheLnRMSSD and LnRMSSD:RR values obtained during the stabilization period (i.e., 0-5-min) presented very large to near perfect ICCs with the values obtained during the criterion period (i.e., 5-10-min), with trivial ES. In the ultra-short-term analysis (i.e., 1-min segments) the data showed slightly less accurate results, but only trivial to small differences with very large to near perfect ICCs were found. Conclusion: To conclude, LnRMSSD and LnRMSSD:RR can be recorded in 5-min without traditional stabilization periods under resting conditions in team-sport athletes. The ultra-short-term analysis (i.e., 1-min) also revealed acceptable levels of agreement with the criterion.

New Study: Smartphone-derived HRV and Training Load in a Female Soccer Team

About a week ago our latest study was published ahead of print in the International Journal of Sports Physiology and Performance.

Smartphone-derived Heart Rate Variability and Training Load in a Female Soccer Team.

This study was 4 years in the making and is without a doubt the biggest project we’ve done to date. Since my Masters in 2011/2012, it’s been my number one priority to study the usefulness of smartphone-derived HRV in a team of athletes. Every project we’ve done leading up to this was simply to enable us to conduct this study. This includes:

  • Validation of the smartphone app (link)
  • Evaluating the agreement between standard HRV recordings (5-min) and ultra-short recordings utilized by the app (60-s) (link)
  • Evaluating the time-course of HRV stabilization in athletes to determine the most convenient and valid recording methodology (link)
  • And some case study work (link)

Finally, in 2014 we implemented smartphone-HRV monitoring with a collegiate female soccer team throughout their spring season. The icing on the cake was having this paper accepted in IJSPP, a journal that I’ve been reading for years and that has published some very important papers that have advanced the practical application of HRV monitoring in field settings. The following will serve as a brief overview of the study.

Background:

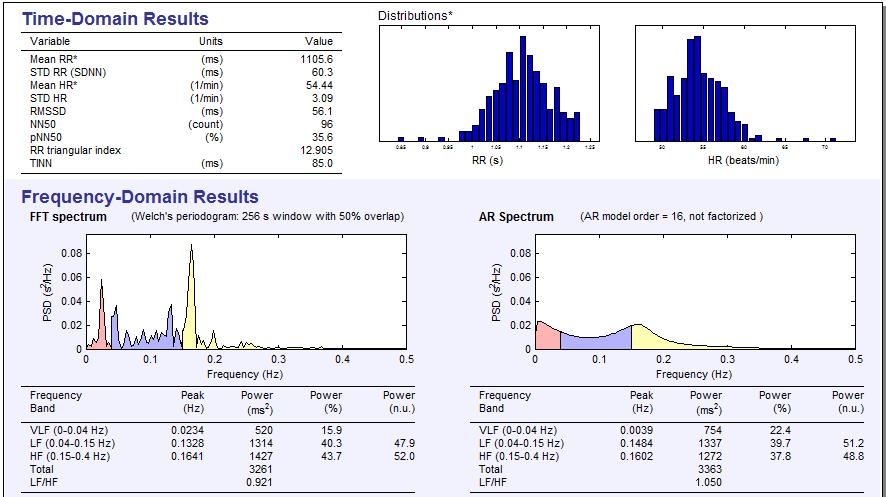
  • Up until recently, HRV data has been traditionally recorded via ECG in the laboratory or with heart rate monitors in the field. The cost and time consuming nature of data collection and analysis procedures with these systems make them prohibitive in team-sport settings. Smartphone HRV technology is an affordable, user-friendly and new alternative that has yet to be studied in the field.
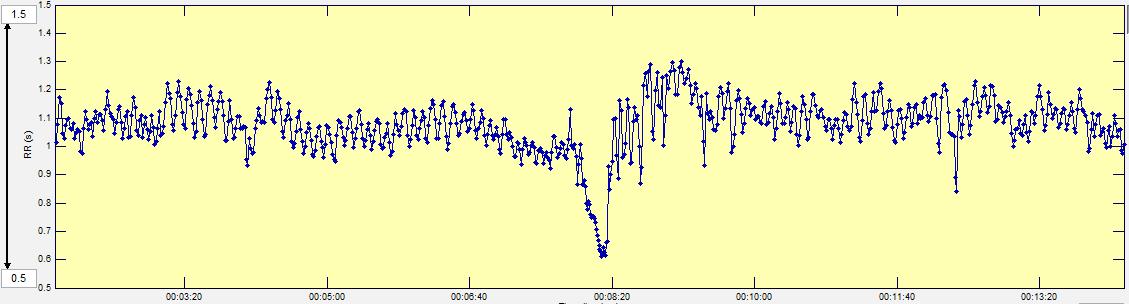
  • Smartphone apps utilize ultra-short recording procedures for HRV data acquisition (brief stabilization period followed by ~1 min recording). These modified recording procedures have not been studied in field settings and therefore it is unclear if meaningful training status information can be acquired with such short R-R interval recordings.
  • It is unclear which position is more preferable for HRV recording. Parasympathetic saturation has been observed in highly fit athletes in the supine position. This is when HRV is low despite very low resting heart rates. Therefore, HRV measures following an orthostatic stimulus (upright posture) have been proposed for use in highly fit athletes to counteract saturation effects. More research to determine which position is most suitable for team-sport athletes is required.
  • The weekly HRV mean and CV have been proposed to be more meaningful than isolated (once per week) measures. No previous research has assessed the evolution of mean and CV values in response to varying weekly training load in collegiate female team-sport athletes. Particularly from ultra-short, smartphone-derived measures.
  • Lastly, previous work has demonstrated that HRV measured between 3 and 5 days per week was sufficient for reflecting weekly mean values in endurance athletes. It is unclear if this applies to team-sport athletes engaged in regular strength and conditioning and soccer training. Reducing HRV measurement requirements to between 3 and 5 days per week would make HRV monitoring much more practical for coaches and athletes by reducing compliance demands.

Methods:

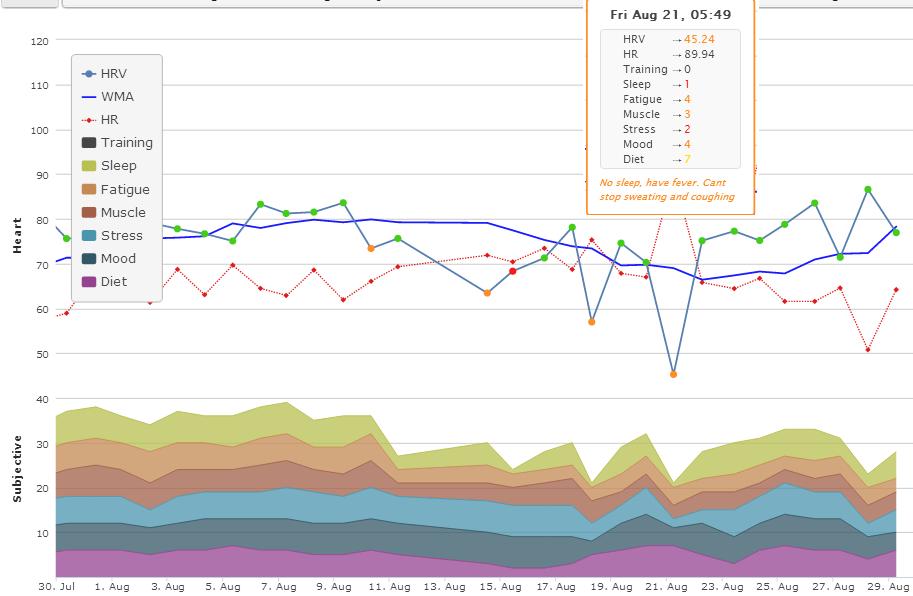
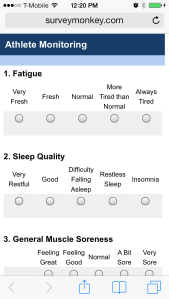
HRV data was recorded daily by the athletes after waking with the ithlete smartphone app over 3 weeks of moderate, high and low training load. As this study took place before the Wellness feature was added to the application, Wellness measures (fatigue, sleep, soreness, mood and stress) were acquired on M-W-F of each week via SurveyMonkey (see guide here).

photo 2

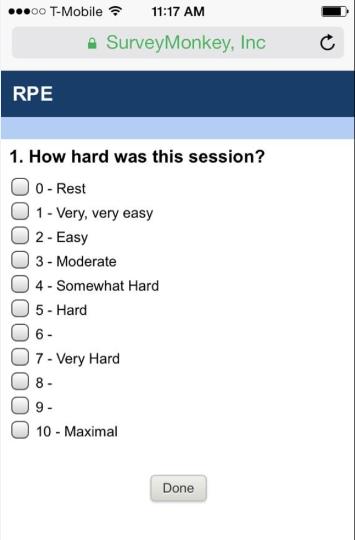
Training load was quantified via sRPE which was acquired between 15-30-min following all resistance training, conditioning and soccer practice sessions via email (SurveyMonkey) delivered to each athletes smartphone.

srpesm

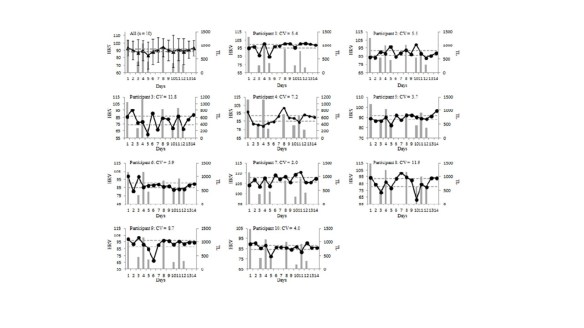
The weekly mean and CV for HRV in both standing and supine measures was determined first intra-individually and then averaged as a group. This was also done for sRPE and Wellness values.

The supine and standing HRV mean and CV were then determined for M-W-F of each week for 3-day values and again for M-T-W-R-F for 5-day values. These were then compared to the 7-day values (the criterion).

Results

The 5 and 3-day measures within each week provided very good to near perfect intraclass correlations (ICCs ranging from 0.74 – 0.99) with typical errors ranging from 0.64 – 5.65 when compared with the 7-day criteria. The supine values demonstrated a smaller CV compared to standing. Therefore the supine measures over 3 and 5 days agreed strongly with the 7-day measures. The standing measures, particularly when measured across 3-days showed the lowest agreement.

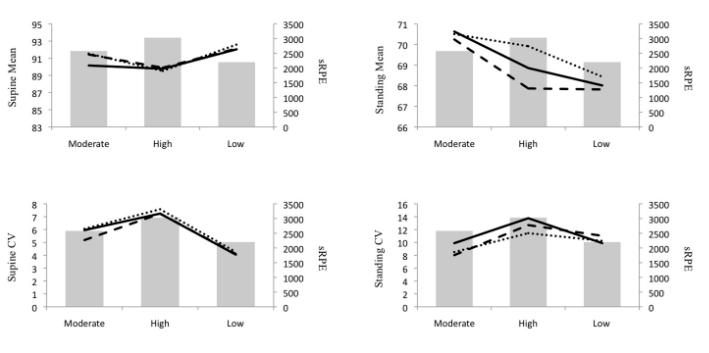
HRV mean values demonstrated small effects in response to varying TL where the lowest HRV mean occurred during the high load week and highest HRV mean occurred during the low load week. The CV values were highest during the high load week and lowest during the low load week. The CV was more sensitive to changes in TL than the mean values (moderate effects). Wellness values were lowest during the high load week (moderate effects) and similar between moderate and low load weeks (trivial effects).

ijspp fig

Brief Discussion and Practical Applications

This study demonstrated that the HRV CV showed greater sensitivity to the changes in TL over the 3-week training period. Essentially, during high load training, the athletes experienced greater fluctuation in their scores. Greater training stress caused greater homeostatic perturbation, reflected in their Wellness and HRV scores in both standing and supine positions. In contrast, during the low load week, there was less day-to-day fluctuation in HRV because there was less fatigue from training stress. Therefore, monitoring CV changes throughout training may provide insight regarding training adaptation. Athletes experiencing greater fatigue will likely show greater CV values. More experienced athletes and those with higher fitness will likely demonstrate lower CV values. When these athletes show increases in the CV, it may be due to non-training related stressors. Comparing individual values to the group average will help identify athletes who may require further follow-up to determine if training of lifestyle modification is necessary.

Quoting from the paper:

Smart-phone derived, ultra-short HRV is a potentially useful, objective internal training status marker to monitor the effects of training in female team-sport athletes as part of a comprehensive monitoring protocol. Coaches and physiologists are encouraged to evaluate the weekly CV in addition to the weekly mean when interpreting HRV trends throughout training as this marker was more sensitive to TL adjustment in the short-term (i.e, 3 weeks). An increase in lnRMSSDmean and decrease in lnRMSSDcv were observed when TL was reduced following moderate and high TL weeks and interpreted as a positive response. Both supine and standing CV measures related well to TL in this study but only supine CV values acceptably maintained this relationship when assessed in 5 and 3 days. Therefore, caution should be used when evaluating standing HRV when only 5 or 3-day measures are used. Seated measures may provide a lower CV relative to standing while still providing an upright posture to counteract possible saturation effects. This may make seated measures preferable to standing as a lower CV is more likely to be captured in fewer than 7 days as demonstrated with the supine values. Reducing HRV data collection to 5 days per week may alleviate compliance demands of athletes and thus may make HRV implementation a more practical monitoring tool among sports teams.

HRV stabilization in athletes: towards more convenient data acquisition

Our “stability” paper has recently been published in Clinical Physiology and Functional Imaging.

http://onlinelibrary.wiley.com/doi/10.1111/cpf.12233/abstract

ABSTRACT

Resting heart rate variability (HRV) is a potentially useful marker to consider for monitoring training status in athletes. However, traditional HRV data collection methodology requires a 5-min recording period preceded by a 5-min stabilization period. This lengthy process may limit HRV monitoring in the field due to time constraints and high compliance demands of athletes. Investigation into more practical methodology for HRV data acquisition is required. The aim of this study was to determine the time course for stabilization of ECG-derived lnRMSSD from traditional HRV recordings. Ten-minute supine ECG measures were obtained in ten male and ten female collegiate cross-country athletes. The first 5 min for each ECG was separately analysed in successive 1-min intervals as follows: minutes 0–1 (lnRMSSD0–1), 1–2 (lnRMSSD1–2), 2–3 (lnRMSSD2–3), 3–4 (lnRMSSD3–4) and 4–5 (lnRMSSD4–5). Each 1-min lnRMSSD segment was then sequentially compared to lnRMSSD of the 5- to 10-min ECG segment, which was considered the criterion (lnRMSSDCriterion). There were no significant differences between each 1-min lnRMSSD segment and lnRMSSDCriterion, and the effect sizes were considered trivial (ES ranged from 0·07 to 0·12). In addition, the ICC for each 1-min segment compared to the criterion was near perfect (ICC values ranged from 0·92 to 0·97). The limits of agreement between the prerecording values and lnRMSSDCriterion ranged from ±0·28 to ±0·45 ms. These results lend support to shorter, more convenient ECG recording procedures for lnRMSSD assessment in athletes by reducing the prerecording stabilization period to 1 min.

CPFI figure

In collaboration with Dr. Fabio Nakamura, we have a new paper currently in review that assesses the suitability of ultra-short (60-s) measures with minimal stabilization in elite team-sport athletes using the Polar system. We will also be assessing if these modified HRV recording procedures sufficiently reflect changes in fitness after a training program. Overall, shortened lnRMSSD recording procedures appear very promising. This will hopefully enhance the practicality of HRV monitoring among sports teams.