I’ve been continuing to collect data on a competitive powerlifter that trains out of our facilities here at AUM. This athlete has cerebral palsy and therefore only competes in raw bench press. Currently, he can press approximately 2.21x his bodyweight (265lbs at 120lb). I’ve posted his older training cycle data previously here and here. This time around, I’ve been tracking a few different variables that are listed and described below. The purpose of this was to see if any of the monitored variables were able to reflect or predict daily variations in 1RM strength.
1RM – Unlike previous cycles, I calculated his 1RM bench press each session based on reps performed and RPE. For example; on his first working set of the day, if he performed 3 reps at an RPE of 9 (1 rep left in the tank), this was considered a 4RM weight and approximately 85% of 1RM using Mike Tuchscherer’s 1RM formula/table. I’ve chosen this specific formula because it is designed for powerlifters. We pause each bench press rep at the bottom which obviously decreases the total amount of reps that can be performed. After trying a few different formulas I found that most were under-predicting his actual strength.
Example:
230×3 RPE @9 = 4RM
Tuchsherer’s Formula: 1RM = 271.4
ExRx.net Calculator: 1RM = 251
Obviously, since many of these are calculated and not true 1RM’s, there is some give or take with these values.
sRPE – Following his workout, I asked him to rate the entire session on a 10 point scale. I do not multiply this by total reps performed but rather just use the rating as a general indicator of how hard the workout was for him.
Hand Dynamometry – Grip strength for each hand was assessed prior to each session via hand dynamometer (starting after week 2). You’ll note that there is a difference between his right and left grip strength due to his condition.
HRV – The athlete measured HRV each morning after waking on his iPod Touch with ithlete in a seated position.
Details of First Training Cycle (Weeks 1-3):
- 3 weeks in duration
- Trained 3 days/week (M-W-F)
- Monday: sets of 3 progressing from approximately 82% in week 1 to 87% by week 3
- Wednesday: sets of 5 progressing from approximately 75% in week 1 to 80% in week 3
- Friday: Singles progressing from approximately 92% in week 1 to 100% in week 3
Details of Second Training Cycle (Weeks 4-6):
- 3 weeks in duration
- Trained 3 days/week (M-W-F)
- Monday: Same as previous cycle
- Wednesday: Speed work progressing from 60-70% from week 4 to week 6 (no 1rm calculations on these days)
- Friday: Same as previous cycle
Assistance work progressed each week and would consist of rowing/pull ups, dumbbell pressing variations and some lower body exercise.
Data is presented below:

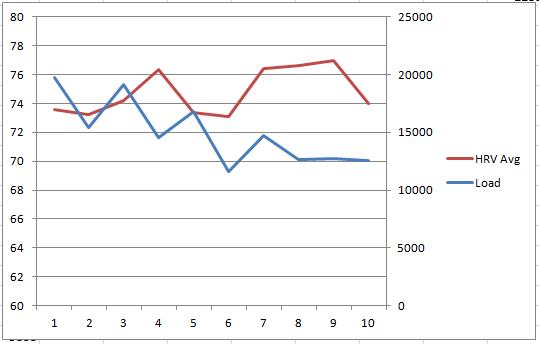
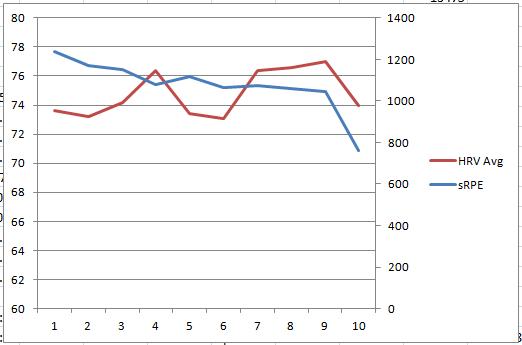
Daily HRV and sRPE

Daily HRV & 1RM
*Regarding the last two 1RM’s on the above chart, 26o is likely lower than his true 1RM that day. He smoked it but I cut him off there. The 277 1RM was based off a 3RM calculation that is probably a little higher than his current ability.

- Daily sRPE shows a progressive increase from week 1 -3 which accurately reflects the progressive increase in intensity for his main work. A decrease in HRV in week 3 along with high RPE’s and a slight decline in 1RM suggests some fatigue accumulation.
- Week 4-6 is the second training cycle. Day one of week 4 is missed and therefore this cycle doesn’t start until the Wednesday. This missed workout caused us to slightly extend the cycle to fit one more lift in on a Monday of the last week.
- Since Wednesday’s are speed focused in the second cycle, intensity is reduced and therefore, RPE was expected to be lower. However, Wednesday of week 6, the workout is rated quite high with an 8 which also happens to be on his lowest HRV day of the entire 6 weeks. The speed emphasis prevents me from collecting a good 1RM estimation and therefore average values are based on only Mon and Fri lifts in contrast to the previous cycle that allowed for 1RMs to be calculated on all three days.
- In week 6, HRV peaks which is in complete contrast to the first cycle where HRV bottomed out in week 3. Interestingly, session RPE’s are lower in week 6 vs. week 3. As HRV declined in week 3, RPE increased, whereas in week 6, though intensity increased, HRV continued to climb and RPE did not increase. There are several instances where HRV relates to RPE (high RPE on low HRV days and vice versa).
- 1RM avg peaked in week 6 along with HRV avg, however I included an extra workout (the last Monday) in this average as this was the day that made up for the missed workout at the beginning of the second cycle. Therefore the average is of 8 days (4 lifts) rather than the typical 7 days (3 lifts).
- HRV on a given day doesn’t particularly appear to be a good predictor of the subtle variation in 1RM strength in this athlete, however weekly mean values showed a strong relationship. This of course needs to be taken in context with where one is within a training cycle. You won’t magically set a PR because your HRV is high or your weekly mean is high.
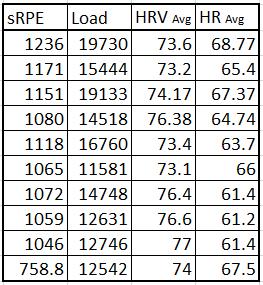
Raw Data Below

- Grip strength testing did not start until week 3. In this athlete, it does not seem to provide any insight as to daily performance potential, fatigue etc. Perhaps this assessment is more useful for lifts directly involving grip requirements (e.g. deadlifts, Olympic lifts, etc.).
- Though not presented, sleep ratings never really dropped below 4 out of 5 and therefore sleep did not seem to be impacted by nor affect the other variables.
This data set has a laundry list of limitations. The main one being that 1RM’s were mostly calculated based on the athletes reported RPE of a set and not a true RM attempt, thus leaving plenty of room for error.
I attribute the adjustment in cycle 2 to its success compared to cycle 1. Adding in the speed work and removing the sets of 5 resulted in less fatigue and allowed for more recovery.
This data set convinces me of nothing, but simply encourages me to continue to explore the relationship between HRV and strength in athletes. Though no conclusions should be drawn, the main findings of this small case study are as follows;
- In this athlete, weekly average changes in 1RM Bench Press strength were related to weekly average changes in HRV (in all but week 5)
- On many instances, low HRV days corresponded to higher ratings of perceived exertion, however this didn’t necessarily affect strength performance.
- Grip strength assessed via hand dynanometer did not appear to be a useful indicator of anything in particular (other than grip strength of course) in this athlete.
- The peak in HRV and Strength in week 6 along with lower than expected sRPE suggests that the second cycle was well tolerated and fatigue was minimal (likely due to the programming adjustment). This is in contrast to week 3 from the end of the first cycle where HRV fell to lowest values, as did strength, while sRPE’s peaked.