Highlights from our latest study in JSCR. Full-text available here.
We aimed to determine how 10 min of post-resistance exercise cycling affects aortic stiffness responses and next day recovery markers in well-trained men.
– A 10-min bout of air bike cycling was ineffective at countering acute RE-induced increases in cfPWV (aortic stiffness), likely because of the rapid and unanticipated cfPWV return to baseline by Post-RE 15min in both conditions (intervention & control).
– Accelerated post-RE cfPWV normalization may be an adaptation to habitual RE, as acute RE-induced aortic stiffness typically persists for >60 min in less experienced lifters.
– Thus, targeting the attenuation of acute post-RE increases in cfPWV is likely unnecessary, but whether the intervention exerts chronic effects, such as limiting long-term RT-induced increases in resting cfPWV, remains TBD.
– Despite no effect of the intervention on cfPWV at the group level, it altered changes at the individual level, such that those with a lower relative cycling power output at the target HR exhibited greater reductions in cfPWV.
– This may indicate that lifters with lower aerobic fitness may derive greater AE-induced destiffening effects after acute RE. – Finally, the AE intervention neither enhanced nor impaired recovery indicators (HRV, subjective, barbell velocity), alleviating concerns about short-term AE interfering with next-day recovery status or performance.
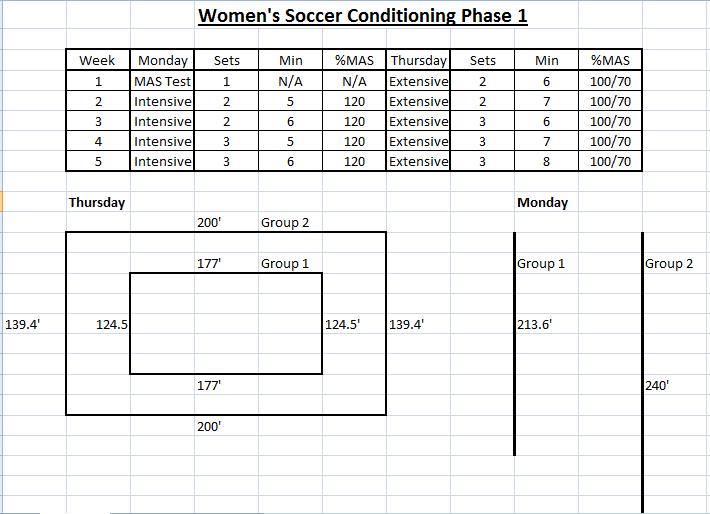
Following a ~2-week family trip, I was relatively detrained. As expected, my standing HRV trend worsened while away with lower and less stable values, reflecting reduced fitness, travel effects, routine change, etc. For my latest n=1 experiment, I decided to track my fitness improvement as I progressively resumed training when I returned home. With increases in aerobic fitness, HRV typically improves by increasing and becoming more stable. I track both nocturnal HRV and post-waking HRV in the standing position. Which of these two is more sensitive to my change in fitness?
What did I do?
I compared associations between my submaximal exercise heart rate at a fixed intensity (HRex, an indicator of aerobic fitness) and both nocturnal and standing RHR and HRV over a 4-week period.
Note: All tools used for this self-experiment were wearable devices that I validated on myself (examples below). However, the accuracy of a device can vary from person to person depending on various factors. For example, many HRV apps show greater error with higher HRV values. Additionally, HRex from a wearable is often less accurate at higher intensities, in less stable conditions, in cold weather, etc. Thus, I encourage everyone to test the accuracy of your own device if you’re able to do so. Otherwise, refer to published agreement studies.
Why did I do it?
My nocturnal and standing HRV often show divergent patterns. If I were to guide training with HRV, which should I focus on? I’ve written about this issue extensively. Here’s a previous example comparing my nocturnal HRV vs. standing HRV during and after COVID-19 infection.
How did I do it?
HRex: I measured HRex during a 20-min treadmill walk (3.7 mph, 1.5% grade, ~50-60% HRmax) every morning at ~7 AM. HRex was measured with the Polar Vantage V3. The mean HR from the last 3 min of each session was used to determine HRex via Polar Flow. I previously compared the Vantage V3 vs. Polar H10 during various exercise sessions and found near identical average HRex values (within 1 bpm, example from treadmill walk below).
Nocturnal Values: Nocturnal HR and HRV (RMSSD) were measured with Oura Ring 4. I previously compared Oura to ECG during a night of sleep and found good agreement (2 ms difference, image below). One outlier sleep HRV value was removed (very high RMSSD, 106 ms spike vs ~70 ms average) which occurred with frequent breathing disturbances reported in the app (i.e., episode of sleep apnea, which happens when I overeat with a later dinner time).
Standing Values: Standing HR/HRV were measured after waking, peeing, and logging body mass. I used the Kubios HRV app paired with a Polar Verity Sense worn around the forearm. The sample duration was 1 min. I compared simultaneous HRV measurements performed with the Vertiy Sense and H10 via the Kubios app and found good agreement. Here is an example comparison below using Kubios software.
What did I find regarding trends over time?
HRex: Consistent with a progressive increase in aerobic fitness, HRex tended to decrease over time.
Nocturnal HRV: Consistent with a progressive increase in aerobic fitness, sleep HR tended to decrease over time. However, inconsistent with fitness improvement, sleep HRV tended to decrease over time.
Standing HRV: Standing HR tended to decrease over time and standing HRV tended to increase over time. Each as expected with an increase in fitness. Figures below showing trends for all parameters across time.
What did I find regarding associations between HRex and HR/HRV values?
Nocturnal Values: Sleep HR was associated with HRex (r = 0.58) in the expected direction, such that when sleep HR was lower, HRex also tended to be lower. Sleep HRV was not strongly associated with HRex and the slope was directionally opposite of what one would expect (r = 0.25). This means that when sleep RMSSD was higher, HRex tended to be higher. Figure below for nocturnal values.
Standing Values: The association between standing HR and HRex was directionally as expected (lower HR associated with lower HRex) but not very strong (r = 0.32). Standing HRV was associated with HRex in the expected direction (r = -0.64), indicating that higher standing HRV was associated with lower HRex. Standing HRV provided the strongest correlation coefficient with HRex. Figure below for standing values.
A strong correlation between my standing RMSSD and HRex is consistent with a previous case study we published in a pro soccer player who showed a similar association with seated upright RMSSD and the heart rate-running speed index (effectively, HRex). See scatter plot below. It didn’t matter if we used a 1 min or a 5 min HRV measure, the associations were the same.
What’s going on with sleep HRV?
My sleep HR was consistently <55 bpm. When HR drops below this threshold, HRV often diminishes. This is because cholinergic receptors on the heart become saturated at very high levels of cardiac parasympathetic activity (i.e. high parasympathetic activity = high vagal discharge of acetylcholine). As a result, phasic modulation decreases, leading to reduced beat-to-beat variability. In the figure below, you can see that the association between sleep HR and RMSSD is counterintuitively positive rather than negative. As my sleep HR decreased, RMSSD decreased as well. Contrastingly, as standing HR decreased, RMSSD increased.
Parasympathetic saturation is a well documented effect. In fact, the very first studies to compare HRV-guided versus pre-planned training by Kiviniemi et al. (2007, 2010) intentionally used standing HRV measures to counteract potential saturation effects that commonly occur when lying down. See screenshots below from the Methods sections.
Therefore, If your sleep HR is <55 bpm, I would strongly encourage you to create a scatter plot of your HR and HRV to determine if this applies to you. It’s critically important to understand that in cases of saturation, HRV does not reflect parasympathetic activity.
I believe there are also other reasons to opt for standing HRV over nocturnal HRV (discussed here).
Conclusion
There was a tendency for greater cardiac efficiency during exercise when standing HRV was higher. Conversely, there was a tendency for greater internal load in response to a fixed stimulus when standing HRV was reduced.
Considering that I cannot use sleep HRV to reliably reflect cardiac-parasympathetic activity due to saturation, and that standing HRV provided the strongest association with HRex, I will continue to use standing HRV as my primary metric.
Here’s an October 2021 update on my quest to reduce arterial stiffness. For the original story and context, see previous post here.
After a year of >15 000 steps/day, continued adherence to improved nutrition, and a modified training approach, I saw another nice reduction in carotid-femoral pulse wave velocity (cf-PWV) along with an increase in RMSSD (see figure below).
RMSSD values (post-waking, standing position) from this October were the highest I’ve recorded to date. It seems that the more I try to reduce cf-PWV and improve my cardiovascular health, the more my HRV increases, despite no change in RHR. This strengthens my view that HRV can be an effective behavior-modification tool for health.
An important training modification that I implemented this October was changing my 10-min post-lift steady state air bike ride to intervals. The protocol is simply to pedal hard (though sub-maximally) for the first 10 s of every min for 10 min (excluding the first minute). Over ~4 weeks my “sprint” intensity naturally increased from ~450-500 to ~500-550 watts and recovery intensity from ~150 to ~180 watts. I’m pretty confident that this change accounts for the further increase in RMSSD. I performed a very similar protocol back in 2014 (post-lift intervals, 2014 figure re-posted below) for 2 weeks and saw an immediate increase and stabilization in my RMSSD values (middle of trend, LnRMSSDx20), which reverted to “normal” after cessation. My October 2021 PWV assessment occurred 2 weeks after starting this protocol, so it’s hard to say how much this may have had an effect.
Post-RT interval training may be a more time-efficient method to counteract the intense RT-induced arterial stiffening. Studies have shown that 30 min steady state, or 10 min of intervals on a bike attenuate post-RT increases in cf-PWV. Only 10 min of steady state riding attenuates RT-induced endothelial dysfunction (which is what originally inspired me to include this after my lifts). In terms of practicality, most lifters will unlikely perform 30 min of aerobic work post-RT. Ten min may be an easier sell. The intervals I’ve been experimenting with may be intense enough to provoke the desired effects, though short and submaximal enough for long-term use. Spearheaded by my incredibly intelligent and competent GA, Joe Vondrasek, we plan to investigate this further next year. We need to determine how such a protocol impacts both cardiovascular health markers and RT adaptations (i.e., day-to-day recovery, interference effect, etc).
I’m happy with the progress I’ve made thus far in reducing arterial stiffness (8.6 to 7.2 m/s). For context, below are norms for cf-PWV from this study. My values are now much closer to norms for my age group. Moving forward, my goal is to resume heavier powerlifting training while maintaining step-count, post-lift interval training, and aerobic work on non-lifting days to see if I can keep PWV under control while building my strength back up to respectable levels.
Some questions I aimed to address in analyzing >10 years of daily HRV:
Is it possible to substantially increase HRV for an extended period of time (>1 year)?
Can a reasonably healthy individual make long-term increases in HRV through aging? (limited to 10 years in my case)
Are changes in self-recorded HRV associated with changes in other health markers?
What are some likely factors that contributed to changes in HRV and health markers?
Brief Intro
People with lower HRV are more likely to die of any cause than people with higher HRV. In addition, nearly every known risk factor for cardiovascular disease is also associated with HRV, including:
Age
Gender
Inflammation
Hypertension
Hyperglycemia
Dyslipidemia
Diabetes
Overweight/obesity
Smoking
Stress
Physical activity
Lifestyle factors (diet, nutrition, sleep)
Bolded risk factors are modifiable with lifestyle intervention. Generally, improvement in one or more of these will often also improve HRV. Though HRV decreases as we get older, individuals with a greater number of healthy lifestyle behaviors tend to maintain higher HRV through aging and live longer.
The amount of day-to-day fluctuation in HRV also seems to be relevant, independent of absolute HRV values. We’ve found the coefficient of variation (CV) of RMSSD to be a very sensitive marker to training adaptations in athletes of a variety of ages and skill-levels (lower CV values generally better). In clinical settings, high visit-to-visit (to the clinic) variability in HR and blood pressure measures are independent predictors of cardiovascular morbidity and mortality. Similar results have been obtained from self-recorded (home-based) measures.
I started tracking my HRV in 2011 to determine if it was a useful training tool for powerlifting. I also wanted to know if it would be worth tracking in the team-sport athletes that I was coaching. There was evidence that HRV-guided training was superior to pre-planned approaches for endurance exercise and that it could help avoid overtraining. Over the short term (day-to-day, week-to-week), my HRV decreased with stress, when training got excessive, when I got sick, from too much alcohol, eating poorly, etc. It increased with good sleep, reduced training load, visiting family, more aerobic exercise, etc. Seeing how various behaviors and events impacted my numbers was educational. However, my long-term HRV (year-to-year) didn’t seem to change. I had a very clear average range that my body always reverted, for nearly 8 years!
I became somewhat doubtful that I could make a long-term improvement in values. Perhaps maintaining them was good enough, I thought. However, in the last few years, along with some fairly substantial changes in my lifestyle and life circumstances, my values seemed to have dramatically improved. To be sure, I dumped all of my data into some software and had a look. I also compiled relevant health markers that I’ve had measured over the years (blood work and arterial stiffness) to see how they tracked with the changes in HRV. Below is my story and the data.
Relevant Personal History
My training history and anthropometric characteristics will be relevant to some of the health markers I’ll present. I grew up playing contact sports, including hockey (age 4-16), rugby (age 12-15), and American football (D-line, age 16-21). After undergrad, I started coaching (football and S&C) and competing in powerlifting. During my football days, my weight got as high as 270 lb. For powerlifting, I competed in the 242 lb weight class (age 21-24, pic below). At age 24 (mid-2011, when I started tracking HRV), I relocated to do my Masters in Exercise Science and work as a GA with S&C. Subsequently (2013), I was a visiting researcher and adjunct professor at Auburn Montgomery where I formally began researching HRV with Dr. Mike Esco (eventually my PhD advisor). After a few projects under my belt, I pursued a PhD in Human Performance at Alabama (2014-2017). In mid-2017, I took (and remain) in a faculty position at Georgia Southern University (Armstrong campus in Savannah). From 2011-2018 I did not compete in powerlifting, but trained as if I might do so at any time.
Competing raw at 242 lb
My priorities before 2018 were:
1. Performance (strength and size)
2. Health
For reasons I’ll elaborate on later, my priorities around 2018 shifted to:
1. Health
2. Performance (strength and size)
HRV Recordings
RHR and LnRMSSD (a parasympathetic HRV index) values (n = 3598 measures) were derived from 1-min recordings performed in the standing position after waking and urinating. We’ve extensively investigated the validity of 1 min recordings for RMSSD. From 2011–2020 I used the ithlete app. We’ve previously compared ithlete vs. ECG and found good agreement for both the chest strap and finger sensor. Mid-August 2020, I upgraded my phone and it was no longer compatible with the finger sensor (no headphone slot). Thus, I began using the HRV4Training app with finger PPG enabled by the phones camera and flash. To be sure that values weren’t excessively different between tools, I performed several simultaneous recordings (finger sensor on left middle finger, HRV4training PPG on left index finger). Results below show decent agreement between apps. The magnitude of change in my HRV substantially exceeds the mean bias. Thus, I’m confident that changes were not an effect of inter-device error. Moreover, my values increased prior to the change in apps.
Tables: Comparison of RHR and LnRMSSD between ithlete finger sensor and HRV4Training camera PPG.
RHR
LnRMSSD
HRV4T
ithlete
Bias
HRV4T
ithlete
Bias
67.7
66
1.7
3.92
3.95
-0.03
61
61
0
3.73
3.7
0.03
62.5
62
0.5
3.80
3.75
0.05
65.6
65
0.6
3.84
3.7
0.14
63.2
63
0.2
4.02
4.05
-0.03
68
68
0
3.83
3.85
-0.02
69
67
2
3.86
3.75
0.11
67.1
67
0.1
3.78
3.7
0.08
56.4
58
-1.6
3.72
3.75
-0.03
56.9
56
0.9
3.70
3.75
-0.05
56.8
57
-0.2
3.75
3.7
0.05
Mean
63.11
62.73
0.38
3.81
3.79
0.03
SD
4.80
4.29
0.97
0.09
0.12
0.06
95% LOA RHR
95% LOA RMSSD
Upper
2.28
Upper
0.15
Lower
-1.51
Lower
-0.10
Data
I’ve assessed month-to-month and year-to-year values so we can focus on long-term changes. Below are a variety of different figures representing my RHR and LnRMSSD values over the last decade (I’ve converted Ln to raw values for some figures). Note that 2011 values only include 5 months (Aug–Dec) of data and 2021 only includes 7 (Jan–July). Thus, values should be compared to full-year data (2012–2020) with this in mind.
Click on figures for greater clarity and to zoom.
Figure 1. Month-to-month mean and SD of LnRMSSD and RHR values.
I’ll mention only a few notable observations here. There was a clear and sustained reduction in RHR in spring 2016. This corresponds with completion of my comprehensive final exams and HRV tracking with football through spring camp. Stress levels were very high. I was terrified of failing comps. For several months, I studied harder than you could possibly imagine. I knew that if I could pass comps, I would complete the PhD. Having published several projects previously, I was less concerned about the subsequent dissertation process. After acing comps and successfully completing spring camp data collection (first project with football), I felt tremendous relief. Everything I’d been working towards since ~2011 was coming together. In my head, I had essentially secured my future. Although I thoroughly enjoyed the process, I was liking the prospect of not living like a poor grad student for much longer. RHR remains relatively stable thereafter whereas LnRMSSD decreases in response to season-long HRV data collection with football (late 2016, early 2017), defending my dissertation, job search/interview, and relocation (all spring 2017). LnRMSSD starts to trend up in 2019 (more on this later). Note increased values in 2020 before changing apps.
Figure 2. Violin plots of daily RHR and LnRMSSD by year. Each dot represents a single day. Generally, outlier dots (low LnRMSSD, high RHR) correspond with being sick, which tends to occur once or twice per year, usually during/after travelling to visit family.
Figure 3. Bar graph of values by year. Here, I’ve included LnRMSSD values relative to HR (green). This provides some indication that HRV increased in recent years, independent of changes in HR. It’s not ideal to calculate this ratio with mixed units, but it should sufficiently represent the general trend.
Figure 4. LnRMSSD values by year with age norms (horizontal lines) and notes of key changes in lifestyle and life circumstances likely attributable to the increase in HRV
This figure puts the magnitude of recent HRV changes into perspective. With a small LnRMSSD increase in 2019, I dropped an age-class. In 2020-2021, my HRV has become comparable to that of teenaged boys. Notes on the figure are fairly self-explanatory. HRV is influenced by a variety of factors and I believe that each item on the list contributed in some way to the increased values. Will elaborate on explaining changes below.
Revaluating Priorities
Although I will always be passionate about HRV in sport, I have recently taken greater interest in HRV as a behavior-modification tool for health. This topic is something I’ve been peripherally interested in since 2011. In ~2019, my self-education (via textbooks, journal articles, podcasts, colleagues, etc.) and research activity shifted to HRV in health and disease. My training also shifted to prioritize health. I still lift heavy, but I’m less concerned with being as big and strong as humanly possible (more on this below). It was becoming clear to me that such goals were not conducive to my cardiovascular health. A few key events triggered this dramatic change:
1) My bloodwork in 2015 revealed an unfavorable lipid profile (LDL-C and Total-C were high), which planted a seed.
2) In tracking HRV in college football players, we observed that linemen demonstrated sustained reductions in LnRMSSD throughout the season. In some cases, RHR’s were ~100 bpm. To explain these findings, I went down a rabbit hole on cardiovascular health in linemen. The research was grim. What effect had years of football and powerlifting training (high volumes of static hemodynamic stress), in addition to a fairly high body mass, have on my cardiovascular health? *Because it’s relevant in the current context, I’ll mention that I have never used anabolic steroids. Thus, these should not be considered as potential factors that affected the health markers I’ll share below.
3) Occasional episodes of obstructive sleep apnea (not formally diagnosed by a physician), mostly following a day where I’d overeat. I had no idea until my wife would describe what my breathing (or lack thereof) sounded like in the middle of the night. My roommate at a conference also pointed it out. This condition is common in larger individuals (e.g., linemen, powerlifters) and is associated with an increased risk of cardiovascular disease.
4) With a new lab toy in 2018, I learned that I had fairly stiff arteries for my age. I have a very limited family history of cardiovascular disease (despite most of us having high cholesterol), but I had to consider that no previous family member has had my body mass or lifestyle. I’ve included a pic below from my football days (~270 lb, ~2006) so you can see how I compared to some family members. Collectively, these events (among others) prompted me to prioritize health over performance.
To clarify, it’s not like I was living a terribly unhealthy lifestyle from 2011-2018. Health was still a priority, just not number one. I ate primarily whole foods (ample fruits and vegetables), lifted 4 days per week, and performed some form of aerobic exercise ~90 min per week. But there was certainly room for improvement. Let’s be honest, it’s hard to maintain 250 lb eating spinach and chicken breasts. Binge eating once or twice per week was pretty standard. The BBQ and mac n cheese in Alabama were the real deal, and there was a Cheesecake Factory nearby. Stress was high. I took on a lot of work and there was a lot of uncertainty (I relocated 5 times during this period). Thus, the type of changes I needed to make were easy to identify.
The impact of reduced work-related obligations (i.e., stress) due to the pandemic cannot be overstated. I say this while acknowledging that the pandemic brought substantial stress and hardship for others. We were fortunate that this was not the case for us. Working from home gave me 100% control over my schedule and allowed me to maintain a strict routine (I thrive with routine). I’m a very happy person when I can eat, train, work, and sleep at consistent times. I’m also mostly an introvert, so I didn’t mind less social activity. Moreover, I was able to dedicate more time to analyzing data and writing papers. I love teaching and interacting with students, but I find the research component to be the most challenging and gratifying part of my job. These psychological factors undoubtedly contributed to the improved HRV, likely via less reductions.
Not being able to go to restaurants during the lockdown further improved my diet. We’d typically go downtown for dinner ~1x/week and I’d overeat every time. I couldn’t lift for weeks. This was the first time I did not perform heavy barbell movements for an extended period of time (>1 week) since I was 16 years old. With facility closures, I resorted to body weight circuits, burpees, and a ton of jump-rope. It was around this time that I really started to notice that my HRV was increasing and becoming more stable (screen shot below). It was also the first time I seriously considered that my powerlifting training was preventing my values from improving. But it was hard to rule out the effects of other factors (reduced work stress, improved diet, etc).
LnRMSSDx20 from lockdown in 2020
Training has changed slightly with my shift in priorities, but is still taken very seriously (put a gym in the garage, pic of beautiful rack below). Although, I’ll admit that the first two pieces of equipment that I bought were a treadmill and an air bike. I continue to lift 4x/week and perform relatively heavy singles and triples, etc. But I don’t use a belt and I leave a minimum of 1 or 2 reps in the tank (minimal grind). I do more bodyweight movements for assistance exercises and maintain a higher tempo (less rest, supersets, etc.) for the cardiovascular stimulus. My overall volume is lower. I’ve eliminated overuse issues (and associated joint inflammation). I start and finish each training session with 10 min steady-state on the air bike. I do another 30 min on the air bike on non-lifting days (1 day continuous, 1 day tempo, 1 day HIIT). Under these conditions, I still aim to progressively increase strength and muscle mass, but I’m less bothered if my numbers are static for a while. I enjoy the training nonetheless.
Beautiful Rack
Screen-shots below show how my body mass changed (-10 lb) in 2019 with my shift in interest and priorities, and how my step-count skyrocketed after Jen (my wife) and I adopted a puppy (summer 2020). We named her Penny Lane and she’s also shown below. My body composition is better and I’ve pretty much eliminated episodes of sleep apnea.
Body mass change through 2019
Increase in step-count in 2020
Penny Lane
My body mass has held steady at ~235 lb since Dec. 2019. I’ve averaged ~15000 steps per day (training sessions excluded) for nearly a year now (daily range: ~12000 – 28000 steps). This is largely attributable to getting a dog and having to do my lawn twice/week most of the year. The massive bump in physical activity and time spent outdoors in Savannah’s parks and trails (i.e., nature) likely had some impact on my numbers. Moreover, timing of the walks (post-waking, and post-meals) directly improves metabolic responses to feeding and may indirectly contribute to improved numbers long-term.
I’ve been eating twice/day (~noon and 6 pm) since shortly before the pandemic. I rarely binge and eat minimal processed foods. Plenty of meat, seafood, nuts, fruits and vegetables. Our combined income doubled in the last couple years. This has reduced financial stress and enabled us eat higher quality foods. Living on the coast, we eat fresh seafood 1-3x per week. I upgraded my fish oil from Costco-brand to Carlson’s liquid fish oil and take a higher daily dose.
Figure 5. LnRMSSD coefficient of variation (CV) by year. CV = (SD/Mean)*100
Greater fluctuation in values are generally associated with poorer health and lower fitness (there are exceptions). For example, unhealthy individuals tend to show the highest day-to-day variation in HRV, whereas highly fit athletes show the least day-to-day variation. My HRV fluctuations peaked during the PhD (not surprising) and have since progressively improved. Recall that 2011 only included 5 months, so that value (5.66%) is likely an inaccurate representation of the full year. I believe most app companies are drastically underestimating the value of this parameter. Many apps don’t even report it. That will likely change.
Arterial Stiffness
Pulse wave velocity is a marker of arterial stiffness. Stiff arteries are bad news in terms of cardiovascular risk. Football linemen experience arterial stiffening following one or more seasons at the collegiate level. Chronic lifters (i.e., powerlifters and strength athletes) have stiffer arteries than healthy controls, and stiffness seems to be associated with length of training history (greater history of lifting = stiffer arteries). This does not bode well for me. A couple years ago, we acquired a tool in our lab that measures pulse wave velocity via carotid-femoral applanation tonometry. This is when I learned that my arteries were much stiffer than norms for my age (values in the range of 50-59 year olds!). With the aforementioned changes to my lifestyle, I was able to see nice improvement in this value (dropped an age group) with the increase in my HRV (see below).
Figure 6. Pulse wave velocity and daily averages for steps, RMSSD, and RHR from the full month of Oct. 2019 and Oct 2020.
RMSSD improved despite a similar RHR. This is relevant because there is great debate among researchers that HRV is explained almost entirely by RHR. I strongly disagree with this. They are certainly correlated in cross-sectional studies, but with self-tracking over time, dissociation is common. Note that a daily change from 60-85 ms is nothing to write home about, but a monthly average change of this magnitude is substantial.
Stiff arteries are problematic for a variety of reasons. For one, arterial baroreceptors (embedded within the arterial wall of the carotid bodies and aortic arch) are sensitive to stretch/deformation, thereby relaying information about blood pressure changes to the brain. They cannot detect changes in pressure very well if the wall they reside in becomes stiff. Without important information from baroreceptors about pressure changes, blood pressure can become dysregulated. Vagal modulation of HR is one of the primary ways that the brain regulates blood pressure. Thus, reducing arterial stiffness may enhance cardio-vagal baroreflex sensitivity, which may improve regulation of blood pressure and improve HRV.
Bloodwork
Thanks to Carl Valle and Inside Tracker, I’ve had some bloodwork done (“Ultimate” panel https://www.insidetracker.com/ultimate/) a few times over the past several years. Importantly, I have bloodwork from mid-PhD in fall 2015 when my HRV was lower and from late summer 2021, when my HRV was substantially higher. Although the gap between measures is lengthier than ideal, the changes are still worth examining. The figure below highlights key changes in relevant biomarkers and HRV.
Figure 7. Absolute changes in blood biomarkers and HRV parameters (month average).
Virtually all biomarkers improved (to varying degrees) along with the increase in HRV, as to be expected with the noted lifestyle changes. My triglyceride/HDL-C ratio (a predictor of cardiovascular disease risk) improved from 2.2 to 1.5. There is research linking hsCRP (systemic inflammation), vitamin D, lipid profiles, and cortisol (stress hormone) to HRV. I will not attempt to make any association here given the length of time between measures and overall sensitivity of HRV to a variety of factors. But the directionality of changes support the idea that improving HRV through lifestyle changes is likely associated with improvements in some blood biomarkers.
Wrap-up
Based on my analysis and interpretation of my data, it seems that:
A “reasonably” healthy individual can make long-term increases in HRV, despite aging 10 years
Changes in self-recorded HRV seem to be associated (in some form) with changes in other health markers
Changes in lifestyle factors unquestionably contributed to improved HRV, and in turn, a likely reduction in cardiovascular risk. However, the extent to which any given change in lifestyle (walking, diet, weight loss, stress reduction, etc.) contributed to the change in HRV is unclear. I suspect there is synergy among the various factors.
It feels strange to publicly share a lot of these personal details, but I think there is value in this n=1 case study. I’m hopeful this story encourages others to take greater interest in their cardiovascular health. A great place to start would be to find out your numbers.
Numerous studies have shown that increases in fitness (e.g., VO2max, MAS, Yo-Yo, etc.) are associated with increased cardiac-parasympathetic activity among healthy, athletic and clinical populations. This is one of the reasons why aerobic exercise is considered to be cardio-protective, due to enhanced resting vagal-modulation.
However, there is considerable inter-individual variation in how a given individual responds to an exercise program. Following a standardized endurance training program, some individuals will show significant improvements in aerobic fitness while others will show only small improvements. Some may even regress. Why this occurs is likely due to a variety of potential variables including genetic factors, appropriateness of training stimulus and life style factors (i.e., sufficient recovery, sleep quality, nutrition, stress, etc.). Given the association between fitness changes and HRV changes, monitoring HRV throughout training may be useful in evaluating individual adaptation to a training program.
In our latest study (in press with JSCR), we wanted to determine if changes in HRV mid-way through a training program related to eventual changes in intermittent running performance in a collegiate female soccer team. It would be useful for coaches to be able to identify athletes who may not be coping well with training earlier on rather than waiting until post-testing to realize some athletes didn’t improve much. Coaches can then investigate the potential cause (i.e., fatigue, insufficient sleep, etc.) and intervene accordingly with modifications to training load or life style factors to get athletes back on track.
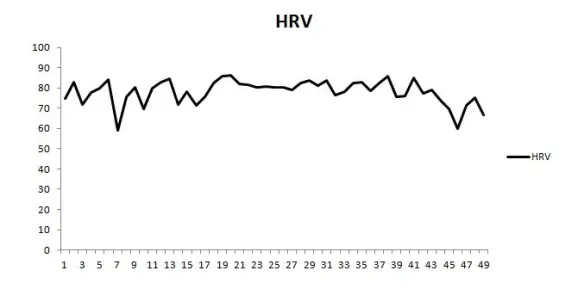
Before and after a 5-week conditioning program, we tested the team’s intermittent running capacity with the Yo-Yo IRT1. The conditioning program was designed based on the individuals max aerobic speed (MAS) adapted from Dan Baker’s MAS guide (link). Below is a screen shot of the conditioning program (unofficial).
During week 1 and week 3, the athletes recorded their resting HRV each morning after waking with their smartphone using the ithlete HRV application which we validated previously (link). The weekly mean and weekly coefficient of variation (CV) for HRV and HR values were calculated. Change variables from week 1 to week 3 of HRV and HR (mean and CV) were correlated with the changes in Yo-Yo IRT1 performance from week 0 to week 5.
We found a very large correlation between the change in HRV CV at week 3 and Yo-Yo IRT1 changes at week 5 (r = -0.74). A large correlation was also found between the change in HRV mean and Yo-Yo IRT1 (r = 0.50). The HR measures showed only moderate correlations with the eventual changes in fitness.
Based on these results, it appears that monitoring HRV throughout training may be useful for evaluating how individual athletes are adapting to training. Specifically, we’re looking for two possible trend changes:
A decrease in day-to-day fluctuation in HRV scores (i.e., decreased HRV CV)
An increase in the weekly mean
Athletes demonstrating the opposite (increased CV and/or decreased weekly mean) may require a little closer attention from coaching personnel to ensure that the training load is appropriate or that the athlete’s are taking care of the non-training factors that can be effecting their recovery.
Another novel finding of this study was that ultra-short HRV recordings (~1 min) derived from a smartphone app used by the athletes provided meaningful training status information. This indicates that HRV monitoring can be much more affordable and convenient than traditional approaches (i.e., longer recording periods with more expensive HRV tools).
I have plans for a much more elaborate post in the near future on the HRV CV. I’ll cover previous research, post some data and discuss how to interpret changes in the CV with appropriate context.
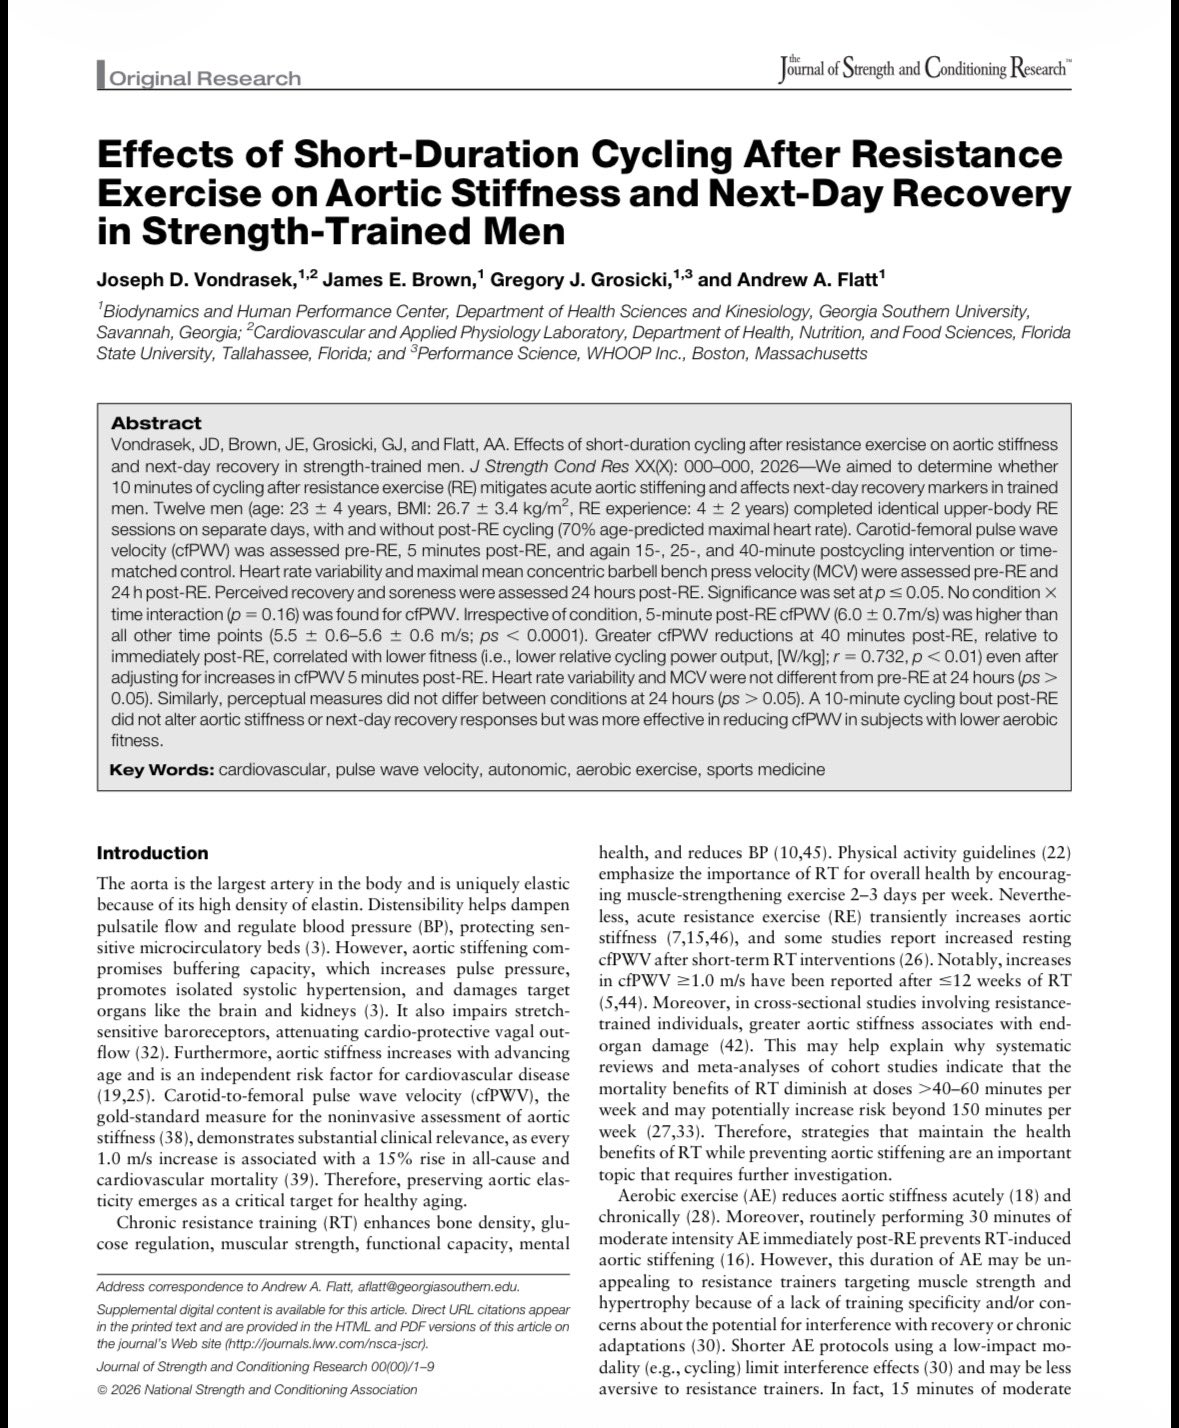
Below are the HRV trends of two NCAA D1 athletes from a team we’ve been working with over a 3 month period of virtually the same training schedule.
The vertical gray bars represent average perceived wellness (9 point scale)
The dotted horizontal black line is daily HRV
The thin black horizontal line is the 7-day rolling average
The dashed parallel horizontal lines represent the smallest worthwhile change (SWC = 0.5xCV)
HRV and wellness was acquired daily by the athletes with the ithlete finger sensor in the seated position.
Interestingly, these two athletes have very similar responses. About 3 weeks into the trend was a very intense training camp that was held out of state before Christmas. One athlete appears to experience more fatigue than the other with nearly the whole week below the SWC and a more pronounced decrease in wellness. HRV and wellness for both athletes improve over Christmas break. Following Christmas there is an intense 2-week training period followed by a reduction in training load. Both athletes frequently fall below the SWC here. Athlete A oscillates up and down while Athlete B remains below the SWC for nearly an entire week along with a decrease in wellness (middle of the trends). Both athletes trend upward after the intense training period and remain steady throughout the last half of the trend.
What makes things interesting is when athletes do not respond as expected. This is when the monitoring becomes invaluable as training intervention becomes extremely important.
In a team setting environment, athletes are often exposed to similar training loads during practices, training and competition. Monitoring of only the external training load provides coaches with an incomplete picture of how individual athletes may be responding and adapting to the training schedule. Two athletes can in fact respond entirely differently to the same program. A recently published case study by Bara-Filho et al. (2013) demonstrates how HRV, when measured periodically throughout training, can help distinguish these individual differences in professional soccer players exposed to the same training schedule. The following is a brief summary and review of this case study.
Materials and Methods
Subject 1 was a 26 year old Mid-Fielder with 7 years of professional playing experience. Subject 2 was a 19 year old Right Back with only 1 year of professional playing experience.
Over a 3 week period during a competitive season, both subjects participated in training that consisted of small-sided games, simulated matches, strength training, sprint training, and low-intensity aerobic recovery work. Training took place 1-2 times per day, 5 day’s/week culminating in a competition on the 6th day and rest on the 7th. Both subjects were starters in the 3 matches that occurred over the observation period.
HRV was measured on 5 occasions throughout the 3 week period on each Saturday and Monday morning (excluding the last Monday). This allowed for HRV indices to be evaluated both after the weekly training load was accumulated (Saturday) and after recovery (Monday). This is precisely the protocol that I discussed in a recent post entitled Making HRV More Practical for Athletes: Measurement Frequency.
HRV data was collected in the morning with a Polar RS800 watch while the athletes rested in a supine position.
Results
Total weekly TRIMP values were similar in both athletes. After the first measurement (M1) Subject 1 showed an increasing trend in several HRV values (RMSSD, HF, SDNN, SD1) indicating good adaptation to training and quality recovery from competition. Subject 2 showed a progressively decreasing trend in these same HRV values indicating an accumulation of fatigue and insufficient recovery.
Discussion
The authors suggest that subject 2, who saw a decreasing trend in his HRV values, may have been experiencing stressors unrelated to sport that may have contributed to his insufficient recovery. Though subjective measure (questionnaires) were not included, the physical training coach reported that athlete 2 would inform him that he was experiencing disturbed sleep, fatigue during training, and poor recovery.
A lower level of playing experience in subject 2 was reported as another possible explanation for his descending HRV trend. The psychological stressors and anxiety experienced by this younger athlete may have also contributed.
The authors briefly discuss the limitations of a supine measurement only when using HRV to monitor training load in athletes. Essentially, individuals with low resting heart rates appear to be subject to “parasympathetic saturation” in the supine position, possibly skewing the data. Therefore, including measurement performed in the standing position may serve as a resolution to this issue. I discussed this topic in a previous post entitled Supine vs. Standing HRV Measurement.
Finally, the authors conclude that HRV values were useful in monitoring the effects of a competitive training schedule in athletes as these values appear to be sensitive to individual characteristics as well as stress and recovery. A stable or increasing HRV trend appears to be favorable as it indicates quality recovery and adaptation to training. In contrast, a decreasing trend in HRV indicates higher stress and impaired recovery which may necessitate recovery interventions and reductions in training load.
Reference
Bara-Filho, M.G., et al. (2013) Heart rate variability and soccer training: a case study. Motriz: rev. educ. fis. 19(1): 171-77. Free Full-Text
1) I was recently contacted by a researcher based out of Australia and asked to beta test his new HRV app. I’ve had the app and hardware for a few days now and it has some really cool features. In a future post I will give my thoughts and review of the app (with the creator’s permission).
2) Last week T-Nation published the “HRV Roundtable Discussion” article. The roundtable contributors were; Craig Weller, James Heathers, Mike T. Nelson, Patrick Ward, Joel Jamieson, Simon Wegerif, Jonathan Pope, Dave Tenney and myself.
This discussion took place earlier in the year and ended up being over 20 pages in length! Many of the pages were adjusted to 8 or 10 point font to reduce the number of pages. A ton of great thoughts and ideas were shared by some very intelligent people. I learned a lot from being a part of this discussion and am very grateful for having been asked to contribute. Craig organized and edited the entire discussion. I can only imagine how long and arduous of a process that was. You can read the discussion HERE.
3) For any strength coaches who are interested in utilizing HRV analysis with your teams, you’ll be interested to know that iThlete has a team app in production. This app will make monitoring RHR, HRV, training load, etc. of each member of your team very easy. I will see if I can get a post up in the near future with some screen shots and more details. I’m very excited for this!
4) Training has been going extremely well for me since moving back to Canada. I can now deadlift without any pain or discomfort in my lower back. I’m considering finally entering a meet again this winter. If I decide to do this I’d like to document my meet prep programming, HRV trends, RPE’s, etc. both for myself (to see what worked and what didn’t) and for my readers because they are training nerds like me.
5) Download a FREE monitoring survey and excel spreadsheet here. This can be very useful to keep track of of your players throughout the season.
6) I came across a very informative video lecture last month that explains the various HRV analysis methods (Time domain, Frequency domain, Poincare plot). The video provides demonstrations of how to use the free Kubios software to analyze data. If you’re interested in learning more about the more technical aspects of HRV analysis, check it out.
Here are some college strength and conditioning video’s from across the NCAA that you might enjoy. I’ll try and post some new video’s once a week from now on.