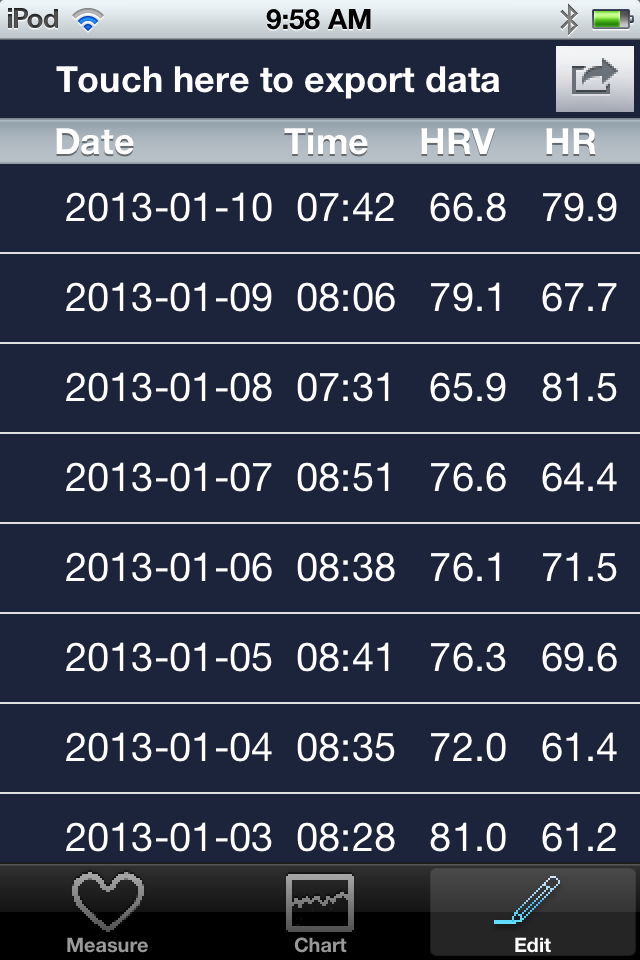
Below is 10 weeks worth of my own training data that includes;
- HRV – Collected daily on ithlete in standing position immediately after waking
- HR – Taken from the ithlete HRV measures
- Load – Sets*Reps*Weight(lbs)
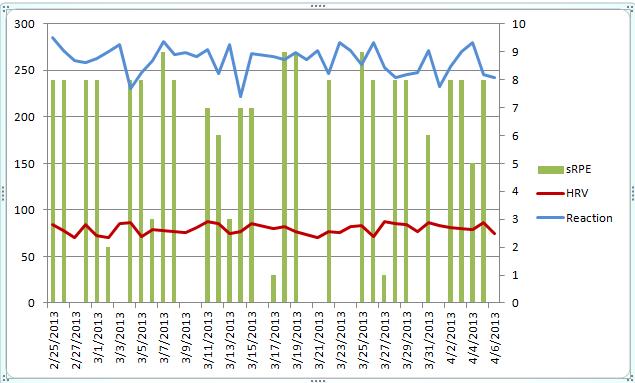
- sRPE – Reps*RPE of session(1-10 scale)
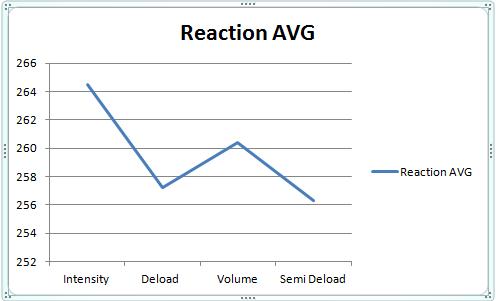
All data is presented as weekly mean values.
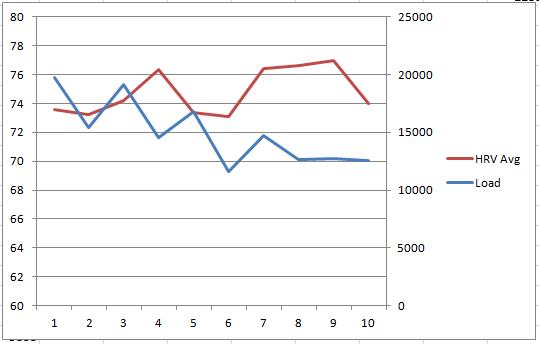
HRV & Load
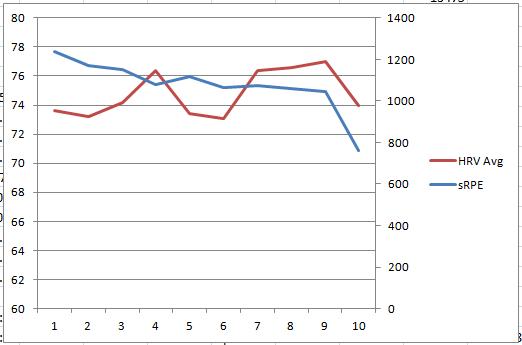
HRV & sRPE HR & Load

HR & sRPE
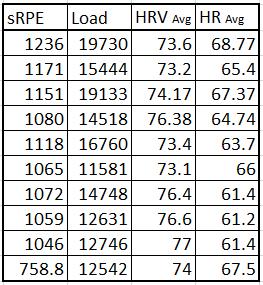
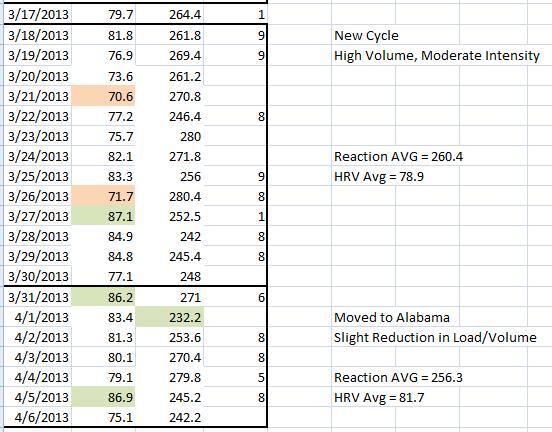
Data
Training
– Training volume in weeks 1-5 involved 3 straight working sets for main lifts alternating between weeks of 5’s, triples and singles. Working weight for each set was predetermined based on previous week but would be adjusted if need be. Training volume progressively decreases as working sets were reduced from 3 top sets to 1 top set. Assistance work was mostly just maintained during the reduced load period. Week 10 was more of a true deload where all working set weights were reduced but only to about 80% while assistance work was reduced slightly as well. Keep in mind that volume for each week would vary based on whether I was performing sets of 5, 3, or 1 for top sets.
Thoughts
– Even prior to week 1 displayed in the data, I had not taken a deload in quite some time (end of August). Performance (strength) had progressively been increasing and I didn’t feel the need so I kept at it. My HRV was consistently averaging in the low 70’s which is quite low compared to my typical average of about 80 (based on several years of data). Once I started having some nagging soft tissue problems accumulate I decided to taper the volume. I was seeing how my body and HRV responded to deloading keeping intensity high but just cutting volume. HRV trended back towards baseline though soft tissue problems weren’t quite resolved.
– Week 10 was Thanksgiving week and I traveled to my folks place. Training was reduced yet HRV decreased. I attribute this entirely to the drastic change in my nutrition during this week. Fruit and Vegetable intake decreased significantly. Processed foods and carb intake increased dramatically. It was an atrocious but delicious week of eating. This is not the first time that I’ve seen HRV change due to similar changes in eating.
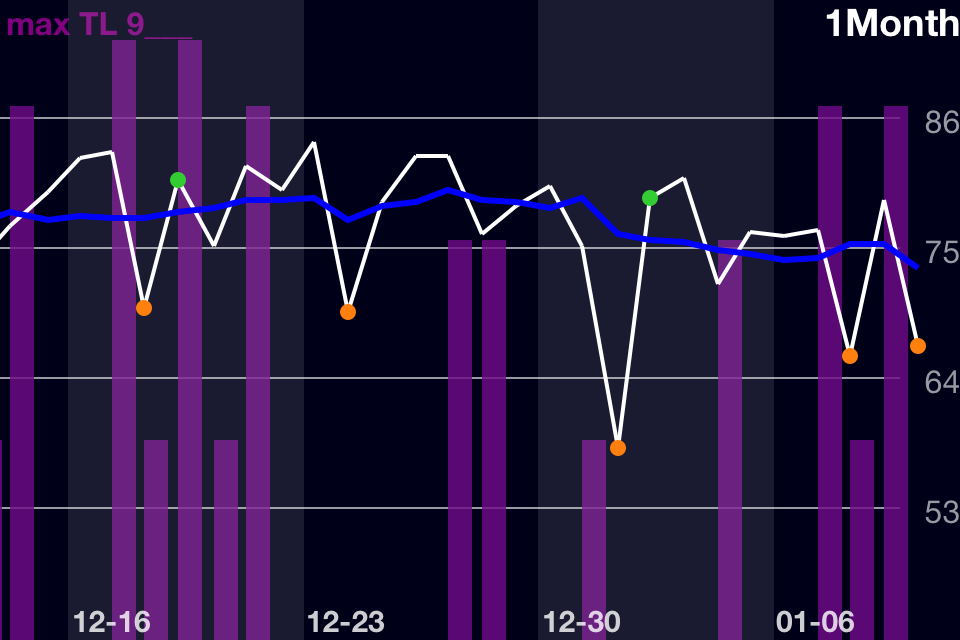
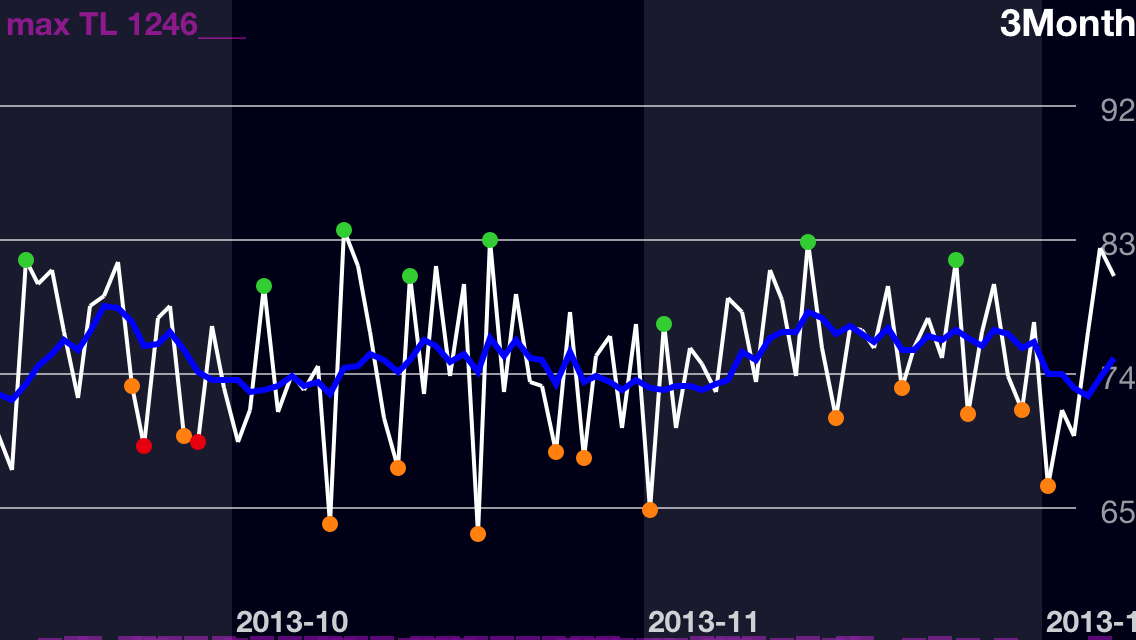
– In the chart below you can see HRV decline during the high volume/load period followed by a progressive increase during the taper. This is then disrupted with a progressive drop during Thanksgiving week of binge eating. HRV then trends back up this week as eating improves and regular training resumes.
– HRV and HR need to be taken into context when being used to guide or monitor training. Other stressors always need to be considered. Neither will ever perfectly correlate with training load as this would assume that only training affects the ANS. It also worth mentioning that HR reflected training load better than HRV in this case and simple RHR should certainly not be dismissed or overlooked.
– Acute changes in HRV/HR won’t always “make sense” or correspond to perceptions of soreness, fatigue, mood etc. (though they do quite often). The weekly mean values tend to provide a better reflection of training/life style. I don’t adjust training on a day to day basis basis until I’m approaching my top sets.