Ultrashort Versus Criterion Heart Rate Variability Among International-Level Girls’ Field Hockey Players

Here’s our latest study comparing 1 min vs 5 min HRV throughout a 4-week camp in international-level girls field hockey players. Values were highly correlated, showed similar responses to load, & similar associations with fitness. Practically same insight, 80% less time. Thanks to Drs. Gonzalez-Fimbres and Hernandez-Cruz for the collaboration.

Link to full free text below:

Image
Image

Effects of varying training load on HRV and running performance among an Olympic rugby sevens team

This study is the first of a few collaborations between Dan Howells and I involving HRV in elite rugby sevens players. Here we evaluated HRV and running performance responses  to peak training loads during preparation for the 2016 Olympic games. A practical summary follows the abstract below.

Effects of varying training load on heart rate variability and running performance among an Olympic rugby sevens team

JSAMS Abstract Flatt Howells HRV rugby sevens

How do elite seven’s players respond to substantial increments in training load? Based on previous studies, we’d expect the weekly LnRMSSD mean (LnRMSSDm) to decrease and the coefficient of variation (LnRMSSDcv) to increase relative to baseline. We’ve observed this in collegiate soccer players and sprint-swimmers.

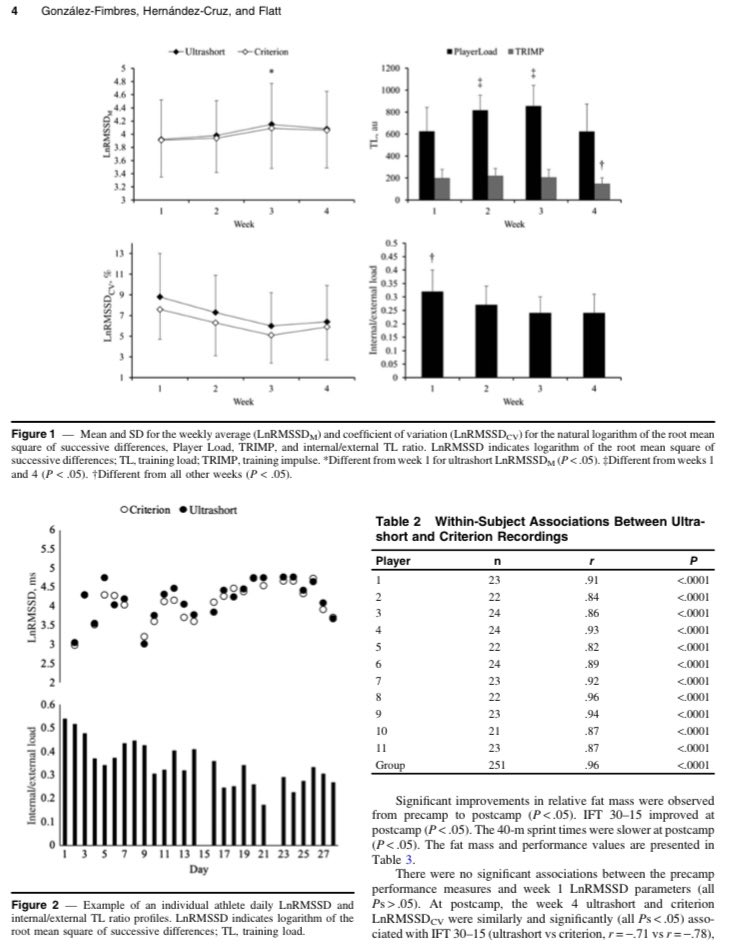
In contrast to this hypothesis, the players showed no change in LnRMSSDmean throughout two weeks of intensified training relative to a baseline week of low loads. LnRMSSDcv demonstrated a small increase during the first week of increased load (expected response) but then showed a moderate decrease during the second week of increased load, which involved greater loads than the previous week (unexpected response).

No change (or an increase) in LnRMSSDm and a reduction in LnRMSSDcv is typically observed when training loads are reduced. Less training stress results in less fluctuations in LnRMSSD. However, these players demonstrated less fluctuation in LnRMSSD despite significant increments in training load.

The discrepancy here appears to be related to how players are tolerating and adapting to the training load. We often assume that increased loads will result in fatigue accumulation and temporary negative responses. However, these elite players demonstrated no reductions in subjective indicators of recovery status during the weeks of increased load. Additionally, there was no significant decrement in running performance (maximum aerobic speed) mid-way through the intensified microcycles.

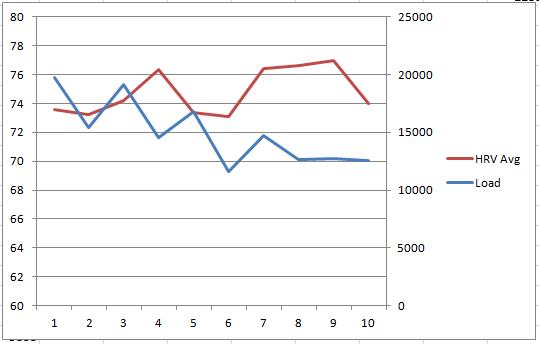
Thus, the preservation of autonomic activity (no change in LnRMSSDm) and less fluctuations (reduced LnRMSSDcv) seem to reflect a postive coping response to the training. In fact, individuals who demonstrated the lowest LnRMSSDcv during week 1 of increased load showed the most favorable changes in running performance (r = -0.74).

This is yet another study that demonstrates that reduced fluctuations in LnRMSSD (i.e., decrease in LnRMSSDcv) is associated with positive training responses in athletes.

The Practical Implications of the study were:

•When evaluated as a group, LnRMSSDcv may be a more sensitive training response marker than LnRMSSDm during training load variations among elite players.

•LnRMSSDcv did not display a linear dose–response relationship with training load. Rather, LnRMSSDcv seems to reflect an adaptive physiological response to the imposed training stimulus which may be useful for identifying individuals responding undesirably to training.

•Elite rugby players presenting large day-to-day fluctuations in LnRMSSD in response to training load variation should be monitored closely for performance decrements, particularly when nearing important competitions.

Modelling the HRV Response to Training Loads in Elite Rugby Sevens Players

New paper in collaboration with my colleagues Sean Williams, Dan Howells et al. Full-text link below.

Modelling the HRV Response to Training Loads in Elite Rugby Sevens Players

Key Points

  • A systems theory approach can be used to describe the variation in chronic HRV responses to training within elite Rugby Sevens players.
  • For the majority of athletes, model parameters can be used to accurately predict future responses to training stimuli.
  • Responses that diverge from the predicted values may serve as a useful flag for the investigation of changes in lifestyle factors.
  • Internal training load measures (sRPE) markedly outperformed external load measures (HSD) in predicting future HRV responses to training stimuli.

Abstract

A systems modelling approach can be used to describe and optimise responses to training stimuli within individuals. However, the requirement for regular maximal performance testing has precluded the widespread implementation of such modelling approaches in team-sport settings. Heart rate variability (HRV) can be used to measure an athlete’s adaptation to training load, without disrupting the training process. As such, the aim of the current study was to assess whether chronic HRV responses, as a representative marker of training adaptation, could be predicted from the training loads undertaken by elite Rugby Sevens players. Eight international male players were followed prospectively throughout an eight-week pre-season period, with HRV and training loads (session-RPE [sRPE] and high-speed distance [HSD]) recorded daily. The Banister model was used to estimate vagallymediated chronic HRV responses to training loads over the first four weeks (tuning dataset); these estimates were then used to predict chronic HRV responses in the subsequent four-week period (validation dataset). Across the tuning dataset, high correlations were observed between modelled and recorded HRV for both sRPE (r = 0.66 ± 0.32) and HSD measures (r = 0.69 ± 0.12). Across the sRPE validation dataset, seven of the eight athletes met the criterion for validity (typical error <3% and Pearson r >0.30), compared to one athlete in the HSD validation dataset. The sRPE validation data produced likely lower mean bias values, and most likely higher Pearson correlations, compared to the HSD validation dataset. These data suggest that a systems theory approach can be used to accurately model chronic HRV responses to internal training loads within elite Rugby Sevens players, which may be useful for optimising the training process on an individual basis.

Training Load and Nutrition Impact on HRV: 10 Week Data Analysis

Below is 10 weeks worth of my own training data that includes;

  • HRV – Collected daily on ithlete in standing position immediately after waking
  • HR  – Taken from the ithlete HRV measures
  • Load – Sets*Reps*Weight(lbs)
  • sRPE – Reps*RPE of session(1-10 scale)

All data is presented as weekly mean values.

HRV & Load

HRV & Load

HRV & sRPE

HRV & sRPEHR & LoadHR & Load

HR & sRPE

HR & sRPE

Data

Data

Training

– Training volume in weeks 1-5  involved 3 straight working sets for main lifts alternating between weeks of 5’s, triples and singles. Working weight for each set was predetermined based on previous week but would be adjusted if need be. Training volume progressively decreases as working sets were reduced from 3 top sets to 1 top set. Assistance work was mostly just maintained during the reduced load period. Week 10 was more of a  true deload where all working set weights were reduced but only to about 80% while assistance work was reduced slightly as well. Keep in mind that volume for each week would vary based on whether I was performing sets of 5, 3,  or 1 for top sets.

Thoughts

– Even prior to week 1 displayed in the data, I had not taken a deload in quite some time (end of August). Performance (strength) had progressively been increasing and I didn’t feel the need so I kept at it.  My HRV was consistently averaging in the low 70’s which is quite low compared to my typical average of  about 80 (based on several years of data).  Once I started having some nagging soft tissue problems accumulate I decided to taper the volume.  I was seeing how my body and HRV responded to deloading keeping intensity high but just cutting volume. HRV trended back towards baseline though soft tissue problems weren’t quite resolved.

– Week 10 was Thanksgiving week and I traveled to my folks place. Training was reduced yet HRV decreased. I attribute this entirely to the drastic change in my nutrition during this week. Fruit and Vegetable intake decreased significantly. Processed foods and carb intake increased dramatically. It was an atrocious but delicious week of eating. This is not the first time that I’ve seen HRV change due to similar changes in eating.

– In the chart below you can see HRV decline during the high volume/load period followed by a progressive increase during the taper. This is then disrupted with a progressive drop during Thanksgiving week of binge eating. HRV then trends back up this week as eating improves and regular training resumes.

Trend 9 to 12_2013

– HRV and HR need to be taken into context when being used to guide or monitor training. Other stressors always need to be considered. Neither will ever perfectly correlate with training load as this would assume that only training affects the ANS. It also worth mentioning that HR reflected training load better than HRV in this case and simple RHR should certainly not be dismissed or overlooked.

– Acute changes in HRV/HR won’t always “make sense” or correspond to perceptions of soreness, fatigue, mood etc. (though they do quite often). The weekly mean values tend to provide a better reflection of training/life style. I don’t adjust training on a day to day basis basis until I’m approaching my top sets.