Heart Rate Variability, Neuromuscular and Perceptual Recovery Following Resistance Training

Our latest study…

Heart Rate Variability, Neuromuscular and Perceptual Recovery Following Resistance Training

We quantified associations between changes in heart rate variability (HRV), neuromuscular and perceptual recovery following intense resistance training (RT). Adult males (n = 10) with >1 year RT experience performed six sets to failure with 90% of 10 repetition maximum in the squat, bench press, and pull-down. Changes (∆) from pre- to immediately (IP), 24 and 48 h post-RT were calculated for neuromuscular performance markers (counter-movement jump peak power and mean concentric bench press and squat velocity with load corresponding to 1.0 m∙s−1) and perceived recovery and soreness scales. Post-waking natural logarithm of the root-mean square of successive differences (LnRMSSD) in supine and standing positions were recorded pre-RT (5 day baseline), IP and two mornings post-RT. All parameters worsened at IP (p < 0.05). LnRMSSD measures were not different from baseline by 24 h. Neuromuscular markers were not different from pre-RT by 48 h. Perceptual measures remained suppressed at 48 h. No significant associations among ∆ variables were observed (p = 0.052–0.978). These data show varying timeframes of recovery for HRV, neuromuscular and perceptual markers at the group and individual level. Thus, post-RT recovery testing should be specific and the status of one metric should not be used to infer that of another.

Full-text is available here: https://www.mdpi.com/2075-4663/7/10/225

HRV Monitoring During Strength and High-Intensity Interval Training Overload Microcycles

Thanks to Christoph Schneider for inviting my collaboration on this new study from his PhD work. The full-text can be viewed here.

Heart Rate Variability Monitoring During Strength and High-Intensity Interval Training Overload Microcycles

Abstract

Objective: In two independent study arms, we determine the effects of strength training (ST) and high-intensity interval training (HIIT) overload on cardiac autonomic modulation by measuring heart rate (HR) and vagal heart rate variability (HRV).

Methods: In the study, 37 well-trained athletes (ST: 7 female, 12 male; HIIT: 9 female, 9 male) were subjected to orthostatic tests (HR and HRV recordings) each day during a 4-day baseline period, a 6-day overload microcycle, and a 4-day recovery period. Discipline-specific performance was assessed before and 1 and 4 days after training.

Results: Following ST overload, supine HR, and vagal HRV (Ln RMSSD) were clearly increased and decreased (small effects), respectively, and the standing recordings remained unchanged. In contrast, HIIT overload resulted in decreased HR and increased Ln RMSSD in the standing position (small effects), whereas supine recordings remained unaltered. During the recovery period, these responses were reversed (ST: small effects, HIIT: trivial to small effects). The correlations between changes in HR, vagal HRV measures, and performance were weak or inconsistent. At the group and individual levels, moderate to strong negative correlations were found between HR and Ln RMSSD when analyzing changes between testing days (ST: supine and standing position, HIIT: standing position) and individual time series, respectively. Use of rolling 2–4-day averages enabled more precise estimation of mean changes with smaller confidence intervals compared to single-day values of HR or Ln RMSSD. However, the use of averaged values displayed unclear effects for evaluating associations between HR, vagal HRV measures, and performance changes, and have the potential to be detrimental for classification of individual short-term responses.

Conclusion: Measures of HR and Ln RMSSD during an orthostatic test could reveal different autonomic responses following ST or HIIT which may not be discovered by supine or standing measures alone. However, these autonomic changes were not consistently related to short-term changes in performance and the use of rolling averages may alter these relationships differently on group and individual level.


HRV monitoring for strength and power athletes

This article is a guest post for my colleague, Dr. Marco Altini’s website. Marco is the creator of the HRV4training app that enables HRV measures to be performed with no external hardware (e.g., HR strap), just the camera/flash of your smartphone and your finger tip. He has several archived articles pertaining to HRV measurement procedures and data analysis from compiled user data that are well worth checking out.

The intro is posted below. Follow the link to read the full article.

Intro

​A definitive training program or manual on how to improve a given physical performance quality in highly trained individuals of any sport does not exist. Nor will it ever. This is because of (at least) two important facts:

  1. High inter-individual variability exists in how individuals respond to a given program.
  2. The performance outcome of a training program is not solely dependent on the X’s and O’s of training (i.e., sets, reps, volume, intensity, work:rest, frequency, etc.) but also largely on non-training related factors that directly affect recovery and adaptation.

The closest we’ll get to such a definitive training approach, (in my opinion) may be autoregulatory training. This concept accepts the 2 facts listed above and attempts to vary training accordingly in attempt to optimize the acute training stimulus to match the individual’s current performance and coping ability.

Improvements in physical performance are the result of adhering to sound training principles rather than strict, standardized training templates. A thorough understanding of sound training principles enables good coaches and smart lifters to make necessary adjustments to a program when necessary to maintain continued progress. In other words, good coaches can adapt the training program to the athlete rather than making the athlete to try and adapt to the program. This is the not so subtle difference between facilitating adaptation and trying to force it.

The theme of this article is not about traditional training principles, but rather about recovery and adaptation concepts that when applied to the process of training, can help avoid set-backs and facilitate better decision-making with regards to managing your program. Given that this site is about HRV, naturally we’re going to focus on how daily, waking measures of HRV with your Smartphone may be useful in this context. For simplicity, we will focus on one HRV parameter called lnRMSSD which reflects cardiac-parasympathetic activity and is commonly used by most Smartphone applications. Drawing from research and real-life examples of how HRV responds to training and life-style factors, I hope to demonstrate how HRV can be used by individuals involved in resistance training-based sports/activities to help guide training.


Continue reading on the HRV4training site.

Reviewing HRV, RPE, 1RM and Grip Strength Data Over 6 Weeks

I’ve been continuing to collect data on a competitive powerlifter that trains out of our facilities here at AUM. This athlete has cerebral palsy and therefore only competes in raw bench press. Currently, he can press approximately 2.21x his bodyweight (265lbs at 120lb).  I’ve posted his older training cycle data previously here and here. This time around, I’ve been tracking a few different variables that are listed and described below. The purpose of this was to see if any of the monitored variables were able to reflect or predict daily variations in 1RM strength.

1RM – Unlike previous cycles, I calculated his 1RM bench press each session based on reps performed and RPE. For example; on his first working set of the day, if he performed 3 reps at an RPE of 9 (1 rep left in the tank), this was considered a 4RM weight and approximately 85% of 1RM using Mike Tuchscherer’s 1RM formula/table. I’ve chosen this specific formula because it is designed for powerlifters. We pause each bench press rep at the bottom which obviously decreases the total amount of reps that can be performed. After trying a few different formulas I found that most were under-predicting his actual strength.

Example:

230×3 RPE @9 = 4RM

Tuchsherer’s Formula: 1RM = 271.4

ExRx.net Calculator:  1RM = 251

Obviously, since many of these are calculated and not true 1RM’s, there is some give or take with these values.

sRPE – Following his workout, I asked him to rate the entire session on a 10 point scale. I do not multiply this by total reps performed but rather just use the rating as a general indicator of how hard the workout was for him.

Hand Dynamometry – Grip strength for each hand was assessed prior to each session via hand dynamometer (starting after week 2). You’ll note that there is a difference between his right and left grip strength due to his condition.

HRV – The athlete measured HRV each morning after waking on his iPod Touch with ithlete in a seated position.

Details of First Training Cycle (Weeks 1-3):

  •  3 weeks in duration
  • Trained 3 days/week (M-W-F)
  • Monday:  sets of 3 progressing from approximately 82% in week 1 to 87% by week 3
  • Wednesday: sets of 5 progressing from approximately 75% in week 1 to 80% in week 3
  • Friday: Singles progressing from approximately 92% in week 1 to 100% in week 3

Details of Second Training Cycle (Weeks 4-6):

  • 3 weeks in duration
  • Trained 3 days/week (M-W-F)
  • Monday: Same as previous cycle
  • Wednesday: Speed work progressing from 60-70% from week 4 to week 6 (no 1rm calculations on these days)
  • Friday: Same as previous cycle

Assistance work progressed each week and would consist of rowing/pull ups, dumbbell pressing variations and some lower body exercise.

Data is presented below:

Daily HRV and sRPE

Daily HRV and sRPE

Daily HRV & 1RM

Daily HRV & 1RM

*Regarding the last two 1RM’s on the above chart, 26o is likely lower than his true 1RM that day. He smoked it but I cut him off there. The 277 1RM was based off a 3RM calculation that is probably a little higher than his current ability.

Z_1rm_HRV_sRPE_10_2013

  • Daily sRPE shows a progressive increase from week 1 -3 which accurately reflects the progressive increase in intensity for his main work.  A decrease in HRV in week 3 along with high RPE’s and a slight decline in 1RM suggests some fatigue accumulation.
  • Week 4-6 is the second training cycle. Day one of week 4 is missed and therefore this cycle doesn’t start until the Wednesday. This missed workout caused us to slightly extend the cycle to fit one more lift in on a Monday of the last week.
  • Since Wednesday’s are speed focused in the second cycle, intensity is reduced and therefore, RPE was expected to be lower. However, Wednesday of week 6, the workout is rated quite high with an 8 which also happens to be on his lowest HRV day of the entire 6 weeks. The speed emphasis prevents me from collecting a good 1RM estimation and therefore average values are based on only Mon and Fri lifts in contrast to the previous cycle that allowed for 1RMs to be calculated on all three days.
  • In week 6, HRV peaks which is in complete contrast to the first cycle where HRV bottomed out in week 3. Interestingly, session RPE’s are lower in week 6 vs. week 3. As HRV declined in week 3, RPE increased, whereas in week 6, though intensity increased, HRV continued to climb and RPE did not increase. There are several instances where HRV relates to RPE (high RPE on low HRV days and vice versa).
  • 1RM avg peaked in week 6 along with HRV avg, however I included an extra workout (the last Monday) in this average as this was the day that made up for the missed workout at the beginning of the second cycle. Therefore the average is of 8 days (4 lifts) rather than the typical 7 days (3 lifts).
  • HRV on a given day doesn’t particularly appear to be a good predictor of the subtle variation in 1RM strength in this athlete, however weekly mean values showed a strong relationship. This of course needs to be taken in context with where one is within a training cycle. You won’t magically set a PR because your HRV is high or your weekly mean is high.

Raw Data Below

Z_rawdata_10_2013

  • Grip strength testing did not start until week 3. In this athlete, it does not seem to provide any insight as to daily performance potential, fatigue etc. Perhaps this assessment is more useful for lifts directly involving grip requirements (e.g. deadlifts, Olympic lifts, etc.).
  • Though not presented, sleep ratings never really dropped below 4 out of 5 and therefore sleep did not seem to be impacted by nor affect the other variables.

This data set has a laundry list of limitations. The main one being that 1RM’s were mostly calculated based on the athletes reported RPE of a set and not a true RM attempt, thus leaving plenty of room for error.

I attribute the adjustment in cycle 2 to its success compared to cycle 1. Adding in the speed work and removing the sets of 5 resulted in less fatigue and allowed for more recovery.

This data set convinces me of nothing, but simply encourages me to continue to explore the relationship between HRV and strength in athletes. Though no conclusions should be drawn, the main findings of this small case study are as follows;

  1. In this athlete, weekly average changes in 1RM Bench Press strength were related to weekly average changes in HRV (in all but week 5)
  2. On many instances, low HRV days corresponded to higher ratings of perceived exertion, however this didn’t necessarily affect strength performance.
  3. Grip strength assessed via hand dynanometer did not appear to be a useful indicator of anything in particular (other than grip strength of course) in this athlete.
  4. The peak in HRV and Strength in week 6 along with lower than expected sRPE suggests that the second cycle was well tolerated and fatigue was minimal (likely due to the programming adjustment). This is in contrast to week 3 from the end of the first cycle where HRV fell to lowest values, as did strength, while sRPE’s peaked.

HRV and Strength Research: Implications for Strength/Power Athletes?

At this point there is quite a bit of research pertaining to HRV and aerobic exercise/endurance training. However, the application of HRV for strength/power (S/P) athletes is less clear. Today I will discuss the available research pertaining to resistance training (RT) and HRV and share some of my thoughts on the topic.

Unfortunately for S/P athletes, the majority of the research that exists involving RT and HRV do not involve athletes. Rather, most of the research tests the effects that RT has on resting HRV for the purposes of improving health/reducing mortality in elderly or diseased populations. Nevertheless, I will summarize what I’ve read.

Heffernan and colleagues (2007) found no change in HRV following 6 weeks of RT and after 4 weeks of detraining in 25 year old male untrained subjects (n=14).

Cooke and Carter (2005) saw non-significant increases in HRV following 8 weeks of RT compared to control in healthy young adults (n=22).

In middle aged folks with pre-hypertension, aerobic exercise increased HRV while RT resulted in decreases in HRV (Collier et al. 2009). In healthy young adults aerobic training improved HRV (in men but not women) while RT had no effect (Sloan et al. 2009).

Elite endurance athletes had higher HRV at rest compared to Elite power athletes but the power athletes had better resting HRV than control (Kaltsatou et al. 2011). No surprise here.

Following 16 weeks of resistance training, a high intensity group and a low intensity group of healthy older women both improved strength with no significant changes in HRV (Forte et al. 2003). These results were consistent with findings by Madden et al (2006) with the same population however they included an aerobic training group who did see increases in HRV.

RT improved HRV in women with fibromyalgia in a study by Figueroa et al. (2007) but failed to improve HRV in the same population in work by Kingsley et al. (2010).

Compared to 3 months of low intensity training (calisthenics and breathing training), intense training (combined aerobic and strength training) improved HRV at rest and in response to orthostasis (standing) in COPD patients (Camillo et al. 2011). The researchers found that better baseline HRV, muscle force and daily levels of activity were predictors of HRV changes after exercise intervention.

In healthy older men, 12 weeks of eccentric RT resulted in decreased HRV. (Melo et al. 2008)

If one’s goal is to increase HRV via exercise then I would definitely go with aerobic work as this seems to be more effective than RT, though the results are conflicting. Training protocols, subjects, health status, age, HRV measurement position and duration, etc. all vary quite a bit which likely accounts for the conflicting results. I assume that there is a volume/intensity threshold that must be met during RT periods to cause a change in resting HRV. For optimal health it is likely that a combination of aerobic work and RT will offer the most benefits.

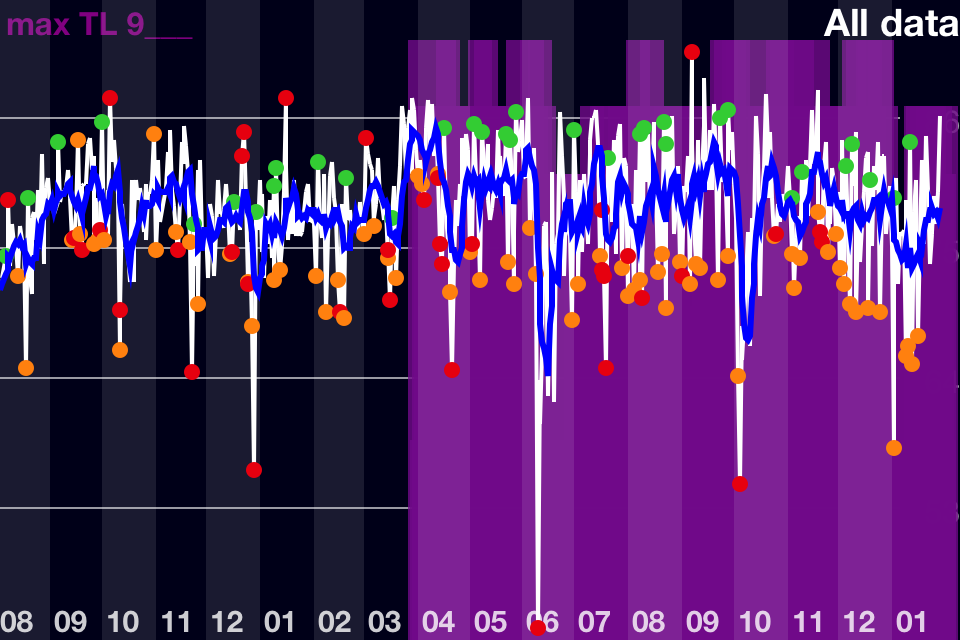
From personal experience, I see much higher scores when I incorporate more aerobic or intermittent conditioning work. In reviewing my all time HRV trend, I can clearly see that over the spring and summer (03-09) of 2012 I had considerably more green scores and higher deflections. This is in line with the time that the weather got nicer and I started doing 30-40 minute runs 3-4x/week (March was unusually warm last year). I got really sick for 2 weeks in June as I discussed here, otherwise I would expect  my trend to be even higher. Once Sept. rolled around I started working full-time again and reduced my aerobic work to 2x/week for about 2o minutes and at a lower intensity at which point baseline declines back to pre-spring/summer levels.

trendalltimejan28

Implications for S/P Athletes

The application of HRV for S/P athletes is obviously different than for elderly or diseased populations. RT is incorporated in training as a means to increase performance, not to increase vagal tone. Therefore, the utility of HRV for this population revolves around its potential ability to:

(Any research I discuss in this section has been cited previously and will not be cited again today, see my older posts for references.)

  • Predict training outcomes

–       Higher HRV at baseline results in improvements in aerobic performance (see here). Would higher baseline HRV result in better S/P improvements? If so, would purposeful manipulation of ANS prior to intensive RT periods via “aerobic” (read “work capacity”) training be of benefit? We already know the importance of GPP but is this relationship mirrored in HRV? If so, HRV may be worth monitoring during these periods.

–       Better basketball and ice hockey performance as well as endurance performance has been correlated with HRV (specifically parasympathetic tone) as I’ve discussed in previous posts. I’m not sure this relationship exists with S/P athletes but it would still be worth testing. Anecdotally, I’ve experience reduced strength performance when HRV is low due to physical fatigue. However, I haven’t really seen strength affected when HRV is low caused by other factors (sleep, other stressors, etc.) Therefore, establishing this relationship must involve careful consideration of these variables.

  • Reflect Recovery Status/Training Load, Overreaching/Non-Functional Overreaching

–       Does overreaching in S/P athletes result in a concomitant decrease in performance and HRV?  Elite female wrestlers were considered non-functionally overreached when performance decreased and HRV was significantly above or below baseline for greater than 2 weeks. Elite tennis players saw significant decreases in HRV but improved performance. Generally in endurance athletes, overreaching will result in decreased performance and a significant increase or decrease in HRV (from baseline).

–       I feel that in S/P athletes, performance probably won’t decrease concurrently with HRV assuming it is a gradual decline as a result progressively increasing training loads. Rather, HRV will probably change first indicating an accumulation of fatigue and performance will fall at some point after if loading persists. Monitoring HRV may be useful to prevent excessive fatigue/overreaching if that isn’t the goal. Perhaps it is also useful in detecting transitions from functional to non-functional overreaching (the point at which HRV changes from overly sympathetic to highly parasympathetic).

–       Does the return to baseline HRV (after overreaching) happen concurrently with return or increase in S/P performance? This was the for case elite swimmers as peak performance occurred concurrently with peak HF values (parasympathetic tone). If so HRV would be a good tool for guiding tapers and establishing best protocols for meet/competition preparation.

–       HRV is an effective tool for guiding aerobic training. Does this apply to S/P athletes? Given that HRV reflects recovery status in S/P athletes (both in the research and anecdotally) and that HRV is sensitive to pretty much all forms of stress, it would seem logical to at least consider HRV in determining daily training. HRV may serve as a guide for determining training frequency and intensity/volume based on individual recovery. More on this topic here. It would be interesting to see HRV guided vs. Pre-planned RT compared in S/P athletes.

  • Guide Periodization

–       HRV will decrease in response to an intense workout. When you perform that workout again and again, your body adapts. The workout is no longer as stressful (decrease in soreness, lack of HRV response, quick recovery, etc. What benefits can HRV offer for adjusting volumes, intensities, exercise selections, frequencies etc. in effort to continually stimulate progress? Is HRV response after a workout any indication of how effective that workout is? Of course there are other factors to consider, not just the amount of stress/fatigue a workout causes. I have repeated workouts with high perceived exertion that have had little effect on HRV. Does that indicate that a change is needed in programming?

It goes without saying that several other factors and variables should be considered when analyzing HRV. HRV is only one variable and is sensitive to a variety of factors that  can influence a result (non-training related stressors, pre-competition anxiety, etc.).

Announcement

This March I will be relocating to Alabama to work in the Human Performance Lab at Auburn University (Montgomery campus) with Dr. Mike Esco. I met Dr. Esco at the NSCA National Conference in RI last summer. Dr. Esco has been researching HRV for several years now. We have several projects tentatively planned and doing an HRV and RT study is one that we’ve been considering. Hopefully we can make it happen.

References

Camillo, C.A. et al. (2011) Improvements of heart rate variability after exercise training and its predictors in COPD. Respiratory Medicine, 105(7): 1054-1062

Cook, W.H., & Carter, J.R. (2005) Strength training does not effect vagal-cardiac control or cardiovascular baroreflex sensitivity in young healthy subjects. European Journal of Applied Physiology, 93: 719-725

Forte, R. et al. (2003) Effects of dynamic resistance training on heart rate variability in healthy older women. European Journal of Applied Physiology, 89: 85-89

Heffernan, K.S. et al. (2007) Heart rate recovery and complexity following resistance exercise training and detraining in young men. American Journal of Physiology – Heart & Circulation Physiology, 293: H3180-H3186

Kaltsatou, A. et al. (2011) The use of pupillometry in the assessment of cardiac autonomic function in elite different type trained athletes. European Journal of Applied Physiology, 111: 2079-2087

Kingsley, J.D., et al (2010). The effects of 12 weeks of resistance exercise training on disease severity and autonomic modulation at rest and after acute leg resistance exercise in women with fibromyalgia. Archives of Physical Medicine & Rehabilitation, 91: 1551-1557

Madden, K.M. et al. (2006) Exercise training and heart rate variability in older adult female subjects. Clinical & Investigative Medicine, 29: 1 – ProQuest

Melo, R.C. et al. (2008) High Eccentric strength training reduces heart rate variability in healthy older men. British Journal of Sports Medicine, 42: 59-63

Sloan, R. P., Shapiro, P.A., DeMeersman, R.E., Bagiella, E., Brondolo, E., McKinley, P.S., Slavov, I., Fang, Y., & Myers, M.M. (2009). The effect of aerobic training and cardiac autonomie regulation in young adults. American Journal of Public Health, 99(5), 921-928

HRV, Adaptation, Progression, Training Adjustments

I’ve been reviewing my HRV trends over the last few weeks to analyze how my body is handling my current training set-up. I’ve been noticing smaller drops in HRV the day following a heavy workout (sRPE9). In some instances I’ve seen a small hike in HRV the following day. Today I will provide a few thoughts on what may be happening as well as some thoughts on things to consider when analyzing your data.

It’s been demonstrated in the research quite clearly that HRV reflects recovery status in both weight lifters and aerobic athletes. Therefore, it’s reasonably safe to say that your HRV score the morning after a workout is reflecting how stressful the workout was. However, it’s extremely important to consider other variables that can affect recovery (other stressors). So taking this into consideration, HRV score reflects not so much the stress of the workout, but rather how well your body was able to respond to it since the cessation of yesterday’s training session (assuming the workout was the biggest stressor of the day).

Let’s say you performed an intense workout that you rated a 9 out of 10 on an RPE scale. The following day your HRV score will depend on the following key variables;

Nutrition: Did you provide the resources for your body to recover from the session? Proteins for structural repairs of damaged muscle fibers, fats for overall calorie intake and hormonal support and carbohydrates for glycogen re-synthesis. Was overall calorie intake sufficient? 

Purposeful Rest/Relaxation: Following the workout did you start the recovery process by relaxing, hot shower, etc.? This will allow the parasympathetic nervous system to get the recovery process underway.

Compounding stress: In contrast to the above, did you add further stress to your body? How physically active were you? What stressful events occurred and how bad were they?

Sleep: How restful was your sleep? How many hours? Were there disturbances?

Aerobic Fitness/General Physical Preparedness: The more aerobically fit you are, generally the better your HRV will be. The higher your work capacity, the more stress your body can handle. In my experience, in effort to increase performance in a given quality, it’s important to consider the overall fitness of the individual as this can limit and effect recovery, training frequency, volume, intensity, etc.

Familiarity of the Training Session: What type of workout was it? Have you performed this workout recently with similar loads? In other words, has your body adapted to the workout structure which therefore reduces the stress on the body?

I would like to elaborate on the last point since the above are pretty self-explanatory. When considering HRV response to a training session, it’s important to evaluate if you are introducing a new stress to the body via new workout structure, type and familiarity of work (aerobic, anaerobic, running, rowing, resistance, etc.). It’s been my experience that a new workout structure or unfamiliar training will create a larger drop in HRV. This is obviously because your body is not accustomed to the type of work and must work hard to adapt and recover. For example, the first time I performed a conditioning session this past year my HRV dropped immensely. However, each conditioning session thereafter provoked less and less of an HRV drop. HRV reflected my progressive adaptation to the stress. Even though the workouts may still have been perceived as hard, the body is familiar with the stimulus and homeostasis is quickly restored.

Some follow up questions based on the above discussion;

  1. Is the workout still effective if it does not provoke a marginal stress response (drop in HRV)?
  2. Should we use HRV as a guide to adjust and make changes to training structure to avoid staleness/plateau (periodization)?

In addressing question 1, it’s important to first evaluate training progress. Check your workout log. Are you still getting stronger/faster/running further, etc (whatever your training goal is). If the answer is yes, continue. Other factors and adaptations are obviously taking place.

In response to question 2, we need to carefully examine all of the above factors that affect an HRV score. If your nutrition is on point, you are reducing compounding stress, sleeping well and so forth, we can assume that the following day’s HRV is a reflection of your response to the training session.

If you’re experiencing a plateau it’s time to consider altering training. If you are a strength athlete you have a few options. Adjust volume or intensity. Adjust training sequence/frequency. Make adjustments to the lifts themselves. For example, add a pause to your bench or take it away, rotate assistance lifts, add or remove an exercise. Obviously only one major adjustment is needed. Evaluate progress, keep track of HRV trends and see if that made a difference. It’s also important to consider that training progress in more advanced athletes/lifters is non-linear. Therefore, don’t make drastic changes at the first sign of plateau. It’s okay to repeat workouts. Use your judgement on if a change is needed.

I will continue with my current training structure and set up to see if progress continues or stops and if HRV trends change or stay the same. Once I can evaluate more of my data I’ll write up a report.

Managing Training for Strength

In my last post I discussed some of the shortcomings of pre-planned training. This inspired a conversation between myself and a friend about percentage based training. Today I’d like to talk about some thoughts I have on this topic. Additionally, I will offer some potentially better strategies to help manage and adapt your training on a day to day basis.

To be clear, percentage based training (in the context of this discussion) refers to planning training loads based on a percentage of your 1 rep max in a given lift.

For example, if your 1 rep max in the Bench Press is 300, you know that 50% of this is 150. Strength is generally believed to best be built by working over 85% of your 1 rep max. From our example, 300x.85=255 and therefore 255 is 85% of our 1 rep max of 300. The purpose of using percentages is to control the level of intensity, effort and fatigue placed on the body to create a desired effect. Generally, you can perform only 1 rep with 100%, 2 reps with 95%, 3 reps with 90% and so on.

% 1RM

100

95

90

85

Reps

1

2

3

5

I think that percentage based training is most effective for novice to intermediate level lifters. This is because they are nowhere near their strength potential. Progressing from workout to workout is much more feasible for them. They can adapt better and faster to the loads because the loads simply aren’t that great yet.

Now for a more advanced trainee, percentage based programs can be less beneficial for several reasons.

  • Percentages are based off a 1rm (or a calculation of a 2-5rm) that were taken on a given day. Your strength levels can and will vary day to day based on recovery status, stress levels, nutrition and several other factors. Therefore a percentage based off the 1rm recorded on a previous day will unlikely be a true reflection of present strength levels.
    90% of your 1rm can easily be 100% on an off day. We’ve all had workouts where the weights felt heavy. We’ve also had days where the weights felt light. If you grinded out 85% for 3 hard, sloppy reps, was it really 85%? In reality it was more like 90%. This can create problems in the program because 85% x3 should generally be a very manageable lift and therefore not tax the body too much. However, since the weight was actually much heavier than 85% on that given day, we’ve created more stress and fatigue then was called for. This is how we set ourselves up for missing lifts in subsequent workouts and nothing is more frustrating than missing lifts.
  • Pre-planned percentage based training is basically telling your body that it must adapt to the training rather than allowing your training to adapt to you. Unfortunately, we do not have conscious control over how we adapt or when. Therefore, it would be much wiser to plan according to the current strength and adaptability levels of our body. We can’t force our body to get stronger.. often times when we try and do this our body tells us to suck it and we regress, or worse, we get hurt. I’ve been down that road.

How do we adapt our training to our body?

1.

I’ve become a big advocate of using RPE (ratings of perceived exertion) to manage training loads. I first learned about RPE when studying for the CSCS exam several years ago. However, it wasn’t until I read Mike Tuchscherer’s Reactive Training Systems Manual that I really started to incorporate them into my training. Essentially, with an RPE system we plan to work up to a given RPE for a given amount of reps and sets as opposed to using a percentage of a 1rm. This allows us to “pre-plan” our training in accordance with our most current strength level. The following chart shows how a RPE score corresponds to effort level.

RPE

Reps left in the tank

10

0

9

1

8

2

10 is an all out effort. It can be a 1 rep max, a 5 rep max or any number really. As long as it was an all out effort where you are unable to perform another rep. An RPE of 9 means you had 1 rep left in the tank. There is a huge difference between an RPE of 9 and 10 due to its effect on the CNS. It takes much longer to recover from a 10 than a 9. This is what makes RPE’s more accurate than percentages.

This system eliminates missed reps at a given percentage because the selected weight is now much more accurate and fits your present strength levels for that day. For more info on RPE’s check out Mike’s book and free articles on his site.

2.

Pay attention to indicators. Things such as sleep, stress, nutrition and restoration work can all have a pretty drastic effect on your strength levels and adaptability. The following is a list of different indicators you can start to monitor if you don’t already.

  • Sleep: I rate my sleep on a scale of 1-5.
    5 = 7-8 hours of sleep, no wakes or disturbances, morning wood, etc
    4= 1 disturbance or wake up during the night
    3= less than 7 hours of sleep, and/or multiple wake ups
    2=Usually if I’m sick and can’t fall asleep
    1=no sleep
    Supplementing with ZMA really helps improve the quality of my sleep.
  • Stress: Primarily for this I use HRV measurements. I’m not going to elaborate on this since I’ve written about it extensively in previous posts. If you’re unfamiliar with HRV then I highly recommend you click here and start with “HRV Explained Part 1″.

    If HRV isn’t an option for you there are other way’s to monitor your stress. I have to thank Simon Wegerif (creator of iThlete) for introducing me to this method in a conversation we had over Skype. Stress can be classified as; physical, mental or chemical.

    Physical Stress = training, labour, etc.

    Mental Stress = financial problems, fighting with a significant other or parent, travel, death in the family, etc.

    Chemical Stress = Alcohol intake, poor or inadequate nutrition, etc.

    You may not perceive things like poor nutrition or mental stressors as significant stress, but I assure you, they play a big role in how strong you’ll be on a given day and how much further training stress you can handle.

    Rate each one of these on a scale of 1-5. You’d be surprised what you discover by monitoring stress and how it relates to and effects your strength levels

    I love the HRV app because it plots your stress levels on a chart so you can see trends over time. Looking back over the trends with your training log and indicators tell you a lot about what’s working and what’s not.

  • Restoration Work: Foam rolling, stretching and moderate aerobic work can have a huge impact on your recovery and fitness levels. I will reserve writing about the benefits of aerobic work for strength athletes now since I plan to write an entire post on it in the future, but understand that a little cardio (in the form of jogging, sled dragging, etc) goes a long way in contributing (indirectly) to strength gains. I simply keep a log of what type of aerobic work I do, for how long and if I use a sled I track the weight.
  • CNS Test: Finally, I like to perform a quick CNS test after my warm-ups but before I start lifting. This can be in the form of a vertical jump, broad jump, grip test or whatever else you can think of. It’s important to be consistent. Compare your daily result to your baseline or average and that will usually indicate how your workout will go. I’ve actually found that skipping (yes, jumping rope) is a good indicator for me. Some days I can skip like a 3rd grade school girl with flawless technique. Other days I can’t get into a rhythm and stomp the rope every ten jumps. I’ve found that this has a correlation to my strength performance that day.

The longer you train and more advanced you get, the harder it is to make progress. If you haven’t adopted any of the above strategies to help monitor your training I encourage you to consider some. You have nothing to lose and only strength to gain.

Thanks for reading.