Heart rate-based indices to detect parasympathetic hyperactivity in functionally overreached athletes. A meta-analysis

Our new meta-analysis determined that parasympathetic hyperactivity in overreached endurance athletes is best detected using weekly averaged versus isolated HRV values and in the standing versus supine position.

Thanks to Agustín Manresa-Rocamora, Antonio Casanova-Lizón, Juan A. Ballester-Ferrer, José M. Sarabia, Francisco J. Vera-Garcia, and Manuel Moya-Ramón for inviting my collaboration.

The full text can be accessed at the link below:

https://onlinelibrary.wiley.com/share/author/WRPUS2WUBDYBTUBBUGQK?target=10.1111/sms.13932

Early changes in HRV relate to eventual fitness changes in collegiate soccer players

Numerous studies have shown that increases in fitness (e.g., VO2max, MAS, Yo-Yo, etc.) are associated with increased cardiac-parasympathetic activity among healthy, athletic and clinical populations. This is one of the reasons why aerobic exercise is considered to be cardio-protective, due to enhanced resting vagal-modulation.

However, there is considerable inter-individual variation in how a given individual responds to an exercise program. Following a standardized endurance training program, some individuals will show significant improvements in aerobic fitness while others will show only small improvements. Some may even regress. Why this occurs is likely due to a variety of potential variables including genetic factors, appropriateness of training stimulus and life style factors (i.e., sufficient recovery, sleep quality, nutrition, stress, etc.). Given the association between fitness changes and HRV changes, monitoring HRV throughout training may be useful in evaluating individual adaptation to a training program.

In our latest study (in press with JSCR), we wanted to determine if changes in HRV mid-way through a training program related to eventual changes in intermittent running performance in a collegiate female soccer team. It would be useful for coaches to be able to identify athletes who may not be coping well with training earlier on rather than waiting until post-testing to realize some athletes didn’t improve much. Coaches can then investigate the potential cause (i.e., fatigue, insufficient sleep, etc.) and intervene accordingly with modifications to training load or life style factors to get athletes back on track.

Before and after a 5-week conditioning program, we tested the team’s intermittent running capacity with the Yo-Yo IRT1. The conditioning program was designed based on the individuals max aerobic speed (MAS) adapted from Dan Baker’s MAS guide (link). Below is a screen shot of the conditioning program (unofficial).

MAS prog. Flatt

During week 1 and week 3, the athletes recorded their resting HRV each morning after waking with their smartphone using the ithlete HRV application which we validated previously (link). The weekly mean and weekly coefficient of variation (CV) for HRV and HR values were calculated. Change variables from week 1 to week 3 of HRV and HR (mean and CV) were correlated with the changes in Yo-Yo IRT1 performance from week 0 to week 5.

We found a very large correlation between the change in HRV CV at week 3 and Yo-Yo IRT1 changes at week 5 (r = -0.74). A large correlation was also found between the change in HRV mean and Yo-Yo IRT1 (r = 0.50). The HR measures showed only moderate correlations with the eventual changes in fitness.

Based on these results, it appears that monitoring HRV throughout training may be useful for evaluating how individual athletes are adapting to training. Specifically, we’re looking for two possible trend changes:

  1. A decrease in day-to-day fluctuation in HRV scores (i.e., decreased HRV CV)
  2. An increase in the weekly mean

Athletes demonstrating the opposite (increased CV and/or decreased weekly mean) may require a little closer attention from coaching personnel  to ensure that the training load is appropriate or that the athlete’s are taking care of the non-training factors that can be effecting their recovery.

Another novel finding of this study was that ultra-short HRV recordings (~1 min) derived from a smartphone app used by the athletes provided meaningful training status information. This indicates that HRV monitoring can be much more affordable and convenient than traditional approaches (i.e., longer recording periods with more expensive HRV tools).

I have plans for a much more elaborate post in the near future on the HRV CV. I’ll cover previous research, post some data and discuss how to interpret changes in the CV with appropriate context.

Link to current study: Evaluating individual training adaptation with Smartphone-derived heart rate variability in a collegiate female soccer team

Weekly endurance performance and HRV: A case study of a collegiate cross-country athlete

During the fall season of 2013, we collected daily HRV, perceived wellness, training load and performance (race times) from a collegiate cross country runner. We wrote this up as a case study and it was published this month in JASC.

Endurance performance relates to resting heart rate and its variability: A case study of a collegiate male cross-country athlete.

This post is a brief summary of our findings.

This athlete competed in 8 km races on Saturday’s throughout the 8 week competitive season for a total of 6 races. HRV data was collected daily with ithlete in a seated position after waking and elimination. Daily wellness questionnaires were delivered to the athletes e-mail via SurveyMonkey (thanks to Carl Valle for this idea) which asked the subject to rate his perceived sleep quality, muscle soreness, fatigue, mood and stress levels out of 5 for a total wellness score /25. Training sessions were quantified with sRPE and a basic TRIMP value. Race times were collected from the host University’s official final results.

Resting heart rate and HRV derived from the smartphone measures were averaged weekly. In addition the coefficient of variation (CV) was calculated for all weekly HR measures.

*Note: lnRMSSD (i.e., HRV) is modified by the application (lnRMSSDx20) which is how the data is presented.

Our initial hypothesis was that the weekly mean of HRV would relate best to performance (8 km races) and that HRV would be a more sensitive measure than basic RHR. However, we found a near perfect correlation between the CV of HRV and performance (r = 0.92). When the CV was high for a given week, performance was worse (slower 8 km race time) whereas when the CV was lower, performance was better. A very similar, but slightly weaker correlation was found with the CV of resting heart rate. The figure below represents the relationship between weekly HRVcv and 8 km race times.

CV 8 km

The weekly mean related less well to performance. Quoting from the paper:

It has been suggested that as a result of tapering and the associated decrease in lnRMSSDmean, the relationship between lnRMSSDmean and performance is reversed (1). This may explain our finding of only a moderate correlation between lnRMSSDmean and 8 km race time and indicates that associations between endurance performance and lnRMSSDmean must be assessed within the context of the training phase and period (1).

The CV reflects the fluctuation in a metric (i.e., HRV/HR in this case) across the week. It’s been suggested that this marker represents the fatigue (decrease in HRV) and recovery process (return toward baseline). However, we also know that non-training related stressors may also effect daily changes. Therefore, a week with higher CV likely represents higher overall stress whereas a decrease in CV might indicate lower stress and/or better recovery, etc. This however should be taken into context with other indications of training status (e.g., TL, wellness, etc.) as a decreased CV has previously been associated with non-functional overreaching in an elite female triathlete in a case study by Daniel Plews and colleagues.

Two races were held at the same course, several weeks apart at the same time of day on Saturday. See excerpt from the paper below:

HRmean and lnRMSSDmean measures were similar on both occasions this season (lnRMSSDmean 73.8, HRmean 70.1 in week 3, lnRMSSDmean 72.6, HRmean 70.5 in week 8), however lnRMSSDcv and HRcv values in week 8 were nearly half of the values in week 3 (lnRMSSDcv 17, HRcv 12.7 in week 3, lnRMSSDcv 9.2, HRcv 6.5 in week 8). Most importantly, race time was 1:49 (min:sec) faster in week 8.  

Obviously, as this was only a case study of a single athlete across a single season, our results need to be interpreted with caution. However, if you’re monitoring HRV in yourself or of athletes, it would likely be best to include the CV in addition to the weekly mean when evaluating training status.

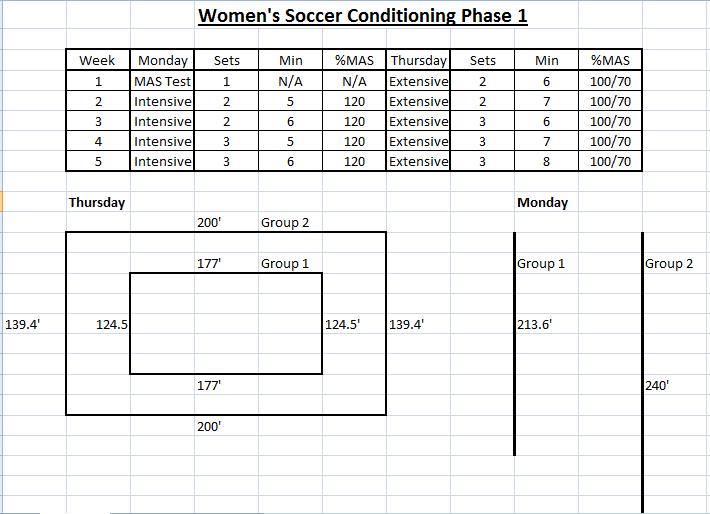
Looking ahead, we have 2 new manuscripts in review right now that evaluate the mean and CV of smartphone-derived HRV in a team of collegiate female soccer players as we make associations with training load changes and performance adaptations. These are very practical papers and the first, to my knowledge, that utilize smartphone applications with ultra-short measures (~1 min) for athlete monitoring.