New study: “Effects of Position and Injury Status on Associations Between Preseason Workload and Heart-Rate Variability Profiles in American College Football Players”
Main findings:
The effect of very high preseason training loads on HRV in college football players varies by position group.
Skill group players who consistently performed the highest total workloads had the most stable HRV, which typically reflects high/increasing fitness.
Conversely, mid-skill group players who performed the highest total workloads had the least stable HRV (often reflects fatigue), along with greater daily variation in high intensity outputs.
Thus, skill players tolerated high loads with stable HRV while mid-skill players better maintained high intensity movement and stable HRV at more moderate workloads.
HRV tended to be lower in those who were playing hurt (“go as can” status), and we suspect that the association between HRV and injury is bidirectional (low HRV precedes injury, injury causes reduced HRV).
If success leaves clues, then there was something to learn from what Dan Howells & staff did to prepare GB 7s for the 2016 Olympics where they advanced to the gold medal final with an undefeated record.
After sorting through the data (HRV, wellness, training load) and having several video and email conversations with Dan, we decided to share the story of their Olympic expedition.
Prior to analyzing the data or obtaining specific details from Dan, I anticipated substantial decrements in status markers in response to a full day in transit (travel fatigue/jet lag, etc.), pre-tournament (arousal/anxiety), & throughout the tournament (match fatigue, sleep loss).
However, data showed minimal effects of travel (decrements mostly in non-starters), no evidence of pre-competitive anxiety (values improved pre-match), & intra-tournament decrements (small in magnitude) comparable to a previous domestic tournament.
Essentially, the data suggest that the team travelled across multiple time zones, adjusted to a foreign environment, and competed successfully on the worlds biggest stage with hardly any indication of stress or fatigue. Incredible!
Although we can’t say for sure that the strategies employed by staff can explain the findings (no control group, unfortunately), we felt that the details were worth sharing.
The paper discusses various proactive and reactive interventions that were used to support training adaptation, manage travel and competition related stress/fatigue, and aid recovery in players.
I’m very grateful to Dan and staff for the collaboration and for being open with these details. There is tremendous vulnerability in giving everyone access to how you do things. Thank you, Dan. You shared tremendous insights that many coaches and players can benefit from.
As part of my PhD work at Alabama, we tracked HRV in football players from day 1 of preseason training through to the national championship. A practical summary of some key findings follow the full-text link below.
Fluctuations in HRV are expected throughout a season. However, chronically suppressed values are cause for concern. Sustained parasympathetic hypoactivity is associated with various pathological conditions and is a hallmark of stress and impaired recovery in athletes.
We learned from spring camp that day-to-day HRV recovery was delayed in linemen vs. the smaller and more aerobically fit skill players. Thus, we anticipated that linemen would be more susceptible to attenuated HRV throughout the season.
HRV started to decline by week 6 of the competitive period for linemen. A couple notable events occurred here: 1) the first of 5 consecutive SEC match-ups vs Top 25 nationally-ranked opponents and 2) the week of mid-term exams for many players.
Although significant group-level reductions for linemen weren’t observed until later, key players showed descending HRV by mid-season, in the absence of changes in PlayerLoad. Suppressed HRV preceded illness and injury in 2 starters. Temporary rest restored HRV.
Group-level reductions occurred during an intensive camp-style preparation period for the college football playoffs following the SEC championship. Most players took a hit to their HRV, but linemen were hit the hardest. Note magnitudes of the effect sizes in the table below.
HRV remain suppressed for linemen through prep weeks for the national semi-final and the national championship. Smaller decrements (non-significant) were observed for skill players. In addition to accumulating physical stress, psycho-emotional factors (pre-competitive anxiety, pressure to perform, media attention, etc) likely contributed.
Although we emphasize the toll of a season on linemen, some skill players also showed suppressed values. The table below shows the rate of change in HRV for all players. 25% of skill and 63% of linemen showed sig. descending HRV patterns throughout the season.
Linemen experience hypertension, arterial stiffening, and pathologic LV hypertrophy following 1 or more seasons. These maladaptations are possibly preceded by ANS imbalance. We hypothesize that larger players showing the worst HRV profiles suffer the greatest decrement in cardiovascular health markers.
If so, intervening when a decreasing HRV pattern is observed may not only be relevant to performance (limiting fatigue, injury-, and infection-risk), it may also help mitigate the cardiovascular toll of playing football at such a high level. Seeking funding to explore this in the future.
The findings highlight potential deficiencies in or greater taxation to the coping capacity of linemen vs. smaller players. Factors hypothesized to contribute to more prevalent ANS imbalance in linemen and potential implications for health and performance are summarized below.
Linemen need careful attention and monitoring. We need strategies to prevent ANS imbalance from occurring (load management, aerobic capacity, treatment of health conditions like sleep apnea, etc) and we need restorative methods to implement if it occurs.
Tracking HRV with a mobile app was inexpensive and easy. Time-demand from players was ~3 min/week while waiting to get taped. Though sub-optimal relative to post-waking measures, this approach enabled timely detection of descending patterns, which may be useful for guiding interventions relevant to player health and wellbeing.
Though a better understanding of the health and performance ramifications of suppressed HRV in football players is needed, a descending pattern may serve as an easily identifiable red flag requiring attention from performance and medical staff.
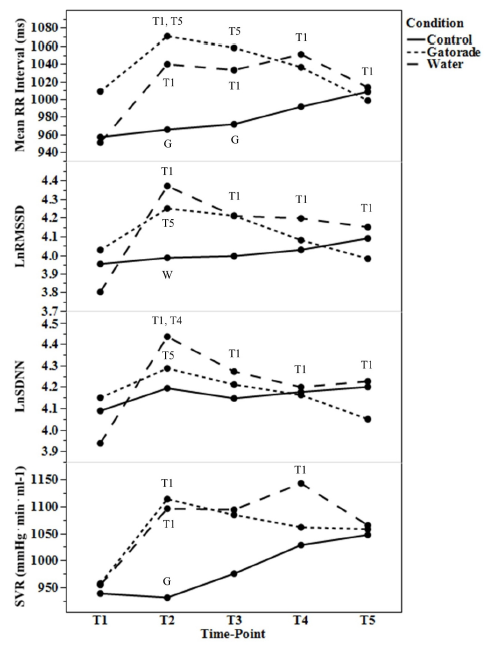
Context: we previously resorted to standardized HRV measures performed in the athletic training room with college football players to overcome non-compliance with post-waking tests.
Problem: pre-training hydration practices confound HRV measures. Players typically opt for cold bottles of water or Gatorade. Thus, we needed to determine how much and for how long these drinks impacted HRV.
Findings: Gatorade had small effects that lasted about 45 min. Effects of water were larger and persisted for 60 min.
Key points:
If measuring HRV in a lab/clinic/training facility, be mindful of recent fluid ingestion. HRV measures obtained within 60 min of 591 ml water or 45 min of an equal volume of Gatorade will be capturing their physiology effects and result in falsely elevated values. This would result in misinterpretation of autonomic status.
Intensive training periods tend to increase RHR and decrease HRV, reflecting stress and fatigue. However, adaptations to heat exposure (e.g., plasma volume expansion) tend to have the opposite effects. So we wanted to see what happens when players were exposed to both intense training and intense heat stress during preseason camp.
Despite increases in perceived fatigue throughout the 2-week period, RHR and HRV reflected responses consistent with heat acclimation.
HRV initially decreased in linemen, then peaked after a day of rest. Non-linemen faired a little better with smaller decrements in perceived fatigue and more frequent day-to-day improvements in RHR and HRV.
These results indicate that heart rate parameters and perceived fatigue are independent markers of training status, and that desirable cardiovascular adaptations can occur in the presence of soreness and fatigue.
This is especially important for tech companies who try to infer recovery status from HRV alone. As HRV improved throughout camp, an app’s algorithm would report to coaches that players are well-recovered. Given that no player feels well-recovered during preseason camp in the heat, the technology suddenly loses credibility for being wrong and will likely be dismissed.
This is unfortunate because the heart rate parameters are likely reflecting important adaptations that may indicate better tolerance to training in the heat, a reduced exercising heart rate, and improved fitness. Thus, I encourage users to ignore “recovery” scores and interpret the data in appropriate context.
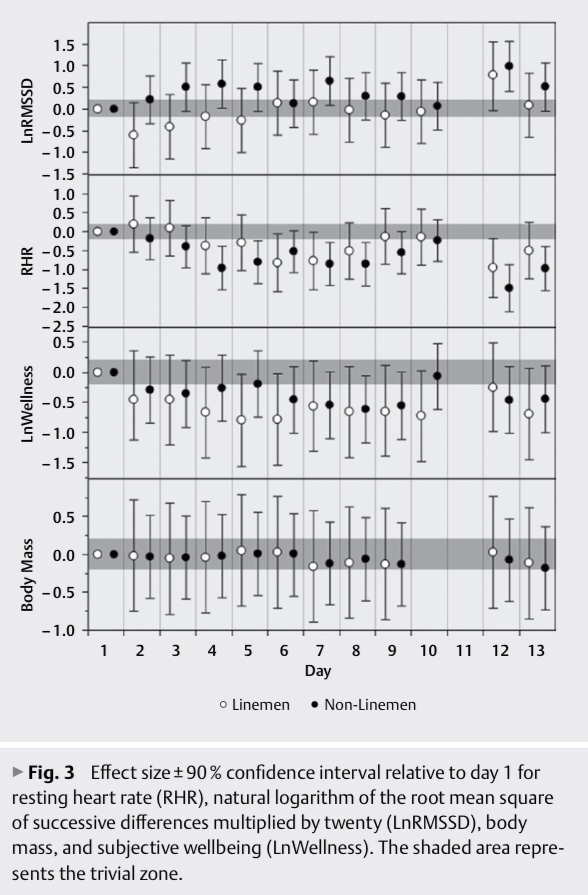
We aimed to characterize cardiac-autonomic responses to a 13-day preseason camp in the heat among an American college football team. Players were categorized as linemen (n=10) and non-linemen (n=18). RHR, natural logarithm of the root-mean square of successive differences multiplied by twenty (LnRMSSD), and subjective wellbeing (LnWellness) were acquired daily. Effect sizes±90% confidence interval showed that for linemen, LnRMSSD decreased (moderate) on day 2 (71.2±10.4) and increased (moderate) on day 12 (87.1±11.2) relative to day 1 (77.9±11.2) while RHR decreased (small–moderate) on days 6, 7, and 12 (67.7±9.3–70.4±5.5 b∙min-1) relative to day 1 (77.1±10.1 b∙min-1). For non-linemen, LnRMSSD increased (small–large) on days 3–5, 7, 12, and 13 (83.4±6.8–87.6±8.5) relative to day 1 (80.0±6.5) while RHR decreased (small–large) on days 3–9, 12, and 13 (62.1±5.2–67.9±8.1 b∙min-1) relative to day 1 (70.8±6.2 b∙min-1). Decrements in LnWellness were observed on days 4–10 and 13 for linemen (moderate) and on days 6–9, 12, and 13 for non-linemen (small–moderate). Despite reductions in LnWellness, cardiac-autonomic parameters demonstrated responses consistent with heat-acclimation, which possibly attenuated fatigue-related decrements.
Our latest study investigates the relationship between subjective indicators of recovery status and HRV among NCAA Division 1 sprint-swimmers. The main findings were:
1) Perceived sleep quality showed the strongest relationship with post-waking LnRMSSD.
2) LnRMSSD demonstrated stronger associations with subjective parameters than resting heart rate.
We report both group and individual relationships. The full text is available here.
Heart rate variability (HRV) is a physiological marker of training adaptation among athletes. However, HRV interpretation is challenging when assessed in isolation due to its sensitivity to various training and non-training-related factors. The purpose of this study was to determine the association between athlete-self report measures of recovery (ASRM) and HRV throughout a preparatory training period. Ultra-short natural logarithm of the root mean square of successive differences (LnRMSSD) and subjective ratings of sleep quality, fatigue, muscle soreness, stress and mood were acquired daily for 4 weeks among Division-1 sprint-swimmers (n = 17 males). ASRM were converted to z-scores and classified as average (z-score −0.5–0.5), better than average (z-score > 0.5) or worse than average (z-score < −0.5). Linear mixed models were used to evaluate differences in LnRMSSD based on ASRM classifications. LnRMSSD was higher (p < 0.05) when perceived sleep quality, fatigue, stress and mood were better than average versus worse than average. Within-subject correlations revealed that 15 of 17 subjects demonstrated at least one relationship (p < 0.05) between LnRMSSD and ASRM variables. Changes in HRV may be the result of non-training related factors and thus practitioners are encouraged to include subjective measures to facilitate targeted interventions to support training adaptations.
Figure 1
Effect sizes ± 90% confidence interval for resting heart rate parameters relative to subjective categorization.
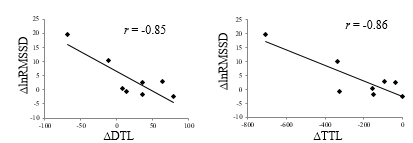
Here’s a brief look at a new paper of ours in press with JSCR. This is a very small study that we submitted as “Research Note” that looked at changes in HRV (via finger pulse sensor) and training load (via Polar Team2) across preseason training in D-1 women’s soccer players.
The purpose of this study was to track changes in training load (TL) and recovery status indicators throughout a 2-week preseason and to interpret the meaning of these changes on an individual basis among 8 Division-1 female soccer players. Weekly averages for heart ratevariability (lnRMSSD), TL and psychometrics were compared with effect sizes (ES) and magnitude based inferences. Relationships were determined with Pearson correlations. Group analysis showed a very likely moderate decrease for total training load (TTL) (TTL week 1 = 1203 ± 198, TTL week 2 = 977 ± 288; proportion = 1/2/97, ES = -0.93) and a likely small increase in lnRMSSD (week 1 = 74.2 ± 11.1, week 2 = 78.1 ± 10.5; proportion = 81/14/5, ES = 0.35). Fatigue demonstrated a very likely small improvement (week 1 = 5.03 ± 1.09, week 2 = 5.51 ± 1.00; proportion = 95/4/1; ES = 0.45) while the other psychometrics did not substantially change. A very large correlation was found between changes in TL and lnRMSSD (r = -0.85) while large correlations were found between lnRMSSD and perceived fatigue (r = 0.56) and soreness (r = 0.54). Individual analysis suggests that 2 subjects may benefit from decreased TL, 2 subjects may benefit from increased TL and 4 subjects may require no intervention based on their psychometric and lnRMSSD responses to the TL. Individual weekly changes in lnRMSSD varied among subjects and related strongly with individual changes in TL. Training intervention based on lnRMSSD and wellness responses may be useful for preventing the accumulation of fatigue in female soccer players.
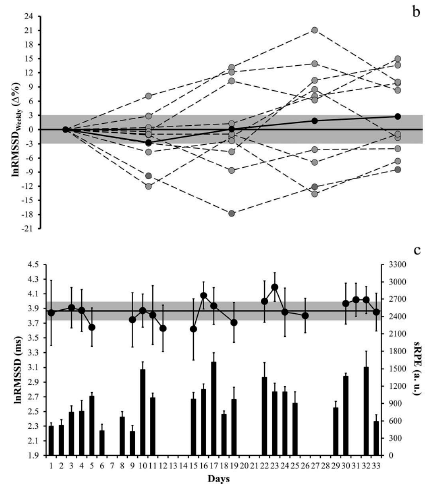
Here’s a quick look at our latest collaboration with Dr. Fabio Nakamura and colleagues, published in J Sport Sci: Sci Med Football. This paper nicely demonstrates the inter-individual variation in HRV responses to training in team sports. An interesting finding was the large negative relationship between the weekly mean of lnRMSSD and the weekly CV of lnRMSSD. Essentially, the athletes with higher HRV tended to show smaller daily fluctuations in HRV and vice versa. This is likely an effect of higher fitness, which we (and others) have touched on in previous studies.
This study aimed to compare the weekly natural log of the root-mean-square difference of successive normal inter-beat (RR) intervals (ln RMSSDWeekly) and its coefficient of variation (ln RMSSDCV) in response to 5 weeks of preseason training in professional male futsal players. A secondary aim was to assess the relationship between ln RMSSDWeekly and ln RMSSDCV. The ln RMSSD is a measure of cardiac–vagal activity, and ln RMSSDCV represents the perturbations of cardiac autonomic homeostasis, which may be useful for assessing how athletes are coping with training. Ten futsal players had their resting ln RMSSD recorded prior to the first daily training session on four out of approximately five regular training days·week−1. Session rating of perceived exertion (sRPE) was quantified for all training sessions. Despite weekly sRPE varying between 3455 ± 300 and 5243 ± 463 arbitrary units (a.u.), the group changes in ln RMSSDWeekly were rated as unclear (using magnitude-based inference), although large inter-individual variability in ln RMSSD responses was observed. The ln RMSSDCV in weeks 4 and 5 were likely lower than the previous weeks. A large and significant negative correlation (r = −0.53; CI 90%: −0.36; −0.67) was found between ln RMSSD and ln RMSSDCV. Therefore, monitoring individual ln RMSSD responses is suggested since large inter-individual variations may exist in response to futsal training. In addition, higher values of ln RMSSD are associated with lower oscillations of cardiac autonomic activity.
HRV fluctuates to a certain extent on a daily basis. I’ve seen athletes with coefficient of variations (CV, a marker of deviation from the weekly mean) as low as 2% to >15%. An athlete’s CV changes over time, which itself serves as what I believe to be, an important indication of training adaptation. The CV is related to individual fitness level and training stress and possibly even performance potential. Measurement position will also affect the CV with lower CV’s observed in the supine position compared to standing.
Here’s an important lesson I’ve learned about interpreting HRV in athletes. A daily change in HRV can occur for a number of reasons, and may or may not have any meaningful impact on acute performance or “readiness”. Putting too much focus on an acute change in HRV without stepping back and observing the overall trend is a bit myopic. This isn’t to say that daily changes aren’t useful, just that a full appreciation of the training process, including the evolution of the trend in response to training will enable better analysis and therefore decision-making. This is because longitudinal changes in an athlete’s HRV trend do not occur for no reason. Increases, decreases, greater fluctuation, less fluctuation, when assessed over time, are all very meaningful.
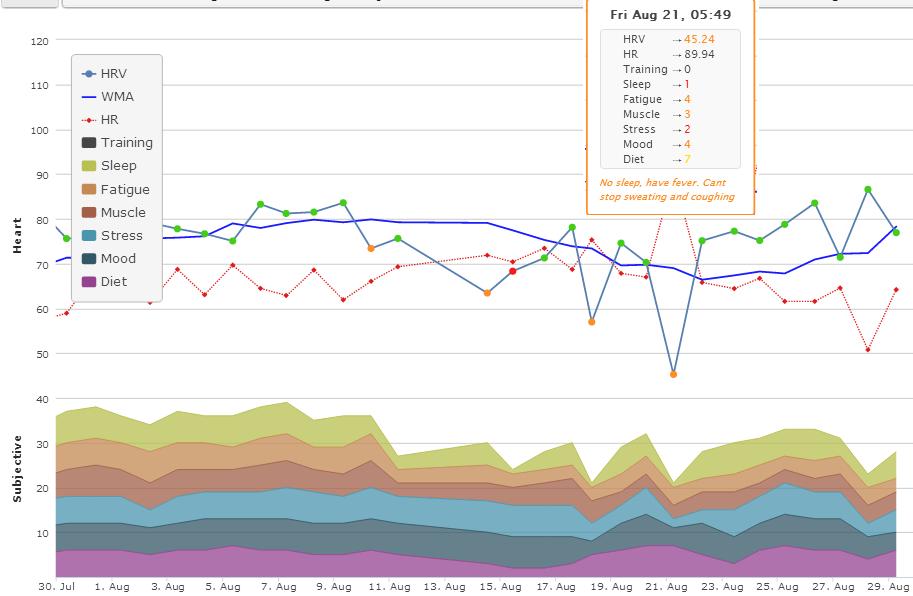
Observe the screenshot below which details the last 6 months of a high level collegiate sprint-swimmers trend. The data pretty much interprets itself when you compare the changes in the trend to changes in training and life events.
What can we observe from this?
Greater fluctuation and a decreasing trend during heavy training stress
Less fluctuation and an increasing trend during reduced training stress
Greater fluctuation and a decreasing trend during normal training with increased academic stress (preparing for and writing exams). Thanks to recent work from Bryan Mann, we know that this increase in non-training related stress may put athletes at greater risk of injury or illness.
I strongly believe that to use HRV effectively, you need to consider the changes in the trend, and not just the day to day stuff. When asked what HRV products are worthwhile or what do I think of App X or product Z, I always suggest that they invest in one that provides the best visualization of the data over time and includes other markers of training status (i.e., load, wellness, etc.). This enables more meaningful interpretation of the data and can therefore be more insightful and useful when determining the appropriate action to take with regards to training program adjustment.
At what point should the coach or trainer implement a training or lifestyle intervention when an athlete is showing warning signs of excess fatigue?
This is easy to determine when looking back on the data retrospectively, but in real-time this can be a challenging question to answer. Especially when performance remains relatively stable during the early stages. There’s a sometimes blurry line between being too soft (changing the plan at every red flag) and being too hard (ignoring too many red flags).
In observing this athletes trend, it appears that the situation could’ve been easily avoided had some type of intervention been made early enough. The trend for HRV, and perceived measures of sleep quality, fatigue, soreness and stress all indicate that this athlete is heading for trouble.
With poor sleep and high levels of training/non-training related stress the immune system is compromised and the athlete gets sick.
At what point do we intervene? Intervention starts with a conversation. The conversation acknowledges a red flag and helps determine what means of action to take (if any at all). In this situation, the first uncharacteristically low sleep rating should’ve started the conversation.