Highlights from our new study for the special issue on “Wearables and the ANS” in Autonomic Neuroscience (full text below).
Aim 1: Test the validity of the Polar H10 vs ECG for HRV and standard cardiac autonomic reflex tests using a time-efficient protocol (see Pic 3).
Aim 2: Determine the extent to which supine RMSSD captures variability in other cardiovagal markers (deep breathing test, orthostatic reflex test, standing RMSSD).
Findings:
Relative agreement was near-perfect across all metrics, with negligible bias, narrow 95% limits of agreement, and MAPE consistently <1%.
Supine HRV explained between none and half of the variance in markers of cardiovagal function from separate assessments.
We explain why supine HRV is limited as a standalone index with examples (see Pic 4).
Instead of conventional supine HRV, which provides 1 assessment in ~10 min (5 min stabilization, 5 min recording), consider this shorter (8 min) protocol that includes 4 distinct assessments for a more comprehensive evaluation.
For remote monitoring, chest-strap ECG assessment should be prioritized over optical wearable sensors such as wristbands and smartwatches, which remain susceptible to substantial error in HRV estimation.
The H10’s ease of use, low cost, and lack of disposable electrodes make it well-suited for remote monitoring and field-based testing, while its high measurement accuracy supports its use in laboratory or clinical settings when traditional ECG is impractical or unavailable.
Our recent study in national-level wrestlers shows that post‑match foam rolling, and to a lesser extent static stretching, may modestly improve acute post-match HRV recovery vs. passive rest, with neutral effects on CMJ performance. More research needed. Full text below.
Our recent paper evaluating acute HRV and blood pressure responses to two different styles of upper-body resistance exercise in trained men shows that:
– For greater hypotensive effects, traditional sets > cluster sets – For faster cardiac-parasympathetic reactivation, cluster sets > traditional sets
New study of ours comparing the Biostrap Kairos wristband to ECG for HRV assessment.
The Kairos wristband offers on-demand heart rate variability (HRV) assessment through its “Spot Check” feature, enabling standardized recordings for clinical, research, or self-tracking purposes, but its validity is untested. Therefore, we compared the Kairos wristband to electrocardiography (ECG) for resting HRV assessment in young adults, and investigated the influence of skin pigmentation (M-index) on measurement accuracy.
Here’s a new study from our lab entitled “Self-recorded heart rate variability profiles are associated with health and lifestyle markers in young adults”. The full text can be accessed for free through this link: https://rdcu.be/cUd9T. A practical summary is provided below.
We’ve been tracking ANS status in athletes via daily ultra-short HRV for nearly 10 years now. In general, we (and others) have found that higher and more stable values are often observed in athletes who are more aerobically fit and who are adapting well to training. Contrastingly, lower and less stable values are commonly observed when athletes are stressed, fatigued from training, and not adapting favorably.
There is also a sizable body of research showing that isolated HRV derived from clinical and laboratory assessment is associated with a variety of health and lifestyle markers in general and clinical populations. Healthier individuals tend to have higher vagal-mediated HRV, are less likely to develop chronic diseases, and often live longer. There is also research showing that less stable HR parameters (i.e., greater day-to-day fluctuation) are independently associated with an increased risk of cardiovascular events in older adults. Importantly, HRV is modifiable. With lifestyle improvement, one can make their HRV higher and more stable. Here’s a case example showing substantial improvements in HRV and other healthy markers with improvements in various lifestyle factors: https://hrvtraining.com/2021/08/10/increasing-hrv-and-cardiovascular-health-10-year-case-study/.
Thus, similar to how we track HRV in athletes to guide training and monitor adaptations, we hypothesize that regular folks can track their HRV to guide lifestyle behaviors towards those that increase cardiac-parasympathetic function, thereby supporting health and longevity. However, no previous investigations have examined the association between self-recorded HRV and health/lifestyle metrics in young adults using accessible HRV tools and ultra-short (60-s) daily recordings. Therefore, that’s what we set out to do.
We had subjects perform 60-s post-waking HRV recordings in the supine and standing position with a cost-free smartphone application and Bluetooth chest strap for 7 days. They also wore an Actigraph on their wrist to measure activity levels and sleep profiles. Following the observation period, we obtained a variety of cardiovascular, metabolic, and psychoemotional health markers in the laboratory.
As anticipated, higher and/or more stable HRV parameters were generally associated with more favorable cardiovascular (higher VO2max, lower systolic and diastolic blood pressure, and lower aortic stiffness), metabolic (lower body fat percentage, fasting glucose, and LDL-C), and psychoemotional (lower perceived stress) health markers. Some variation between sexes and recording positions were noted. Additionally, most, but not all, associations weakened after adjusting for VO2max, supporting previous work indicating that increasing fitness is one of the most effective ways to increase HRV and derive health benefits associated with increased parasympathetic (and reduced sympathetic) modulation. For more details and conclusions, see the full text here: https://rdcu.be/cUd9T
If success leaves clues, then there was something to learn from what Dan Howells & staff did to prepare GB 7s for the 2016 Olympics where they advanced to the gold medal final with an undefeated record.
After sorting through the data (HRV, wellness, training load) and having several video and email conversations with Dan, we decided to share the story of their Olympic expedition.
Prior to analyzing the data or obtaining specific details from Dan, I anticipated substantial decrements in status markers in response to a full day in transit (travel fatigue/jet lag, etc.), pre-tournament (arousal/anxiety), & throughout the tournament (match fatigue, sleep loss).
However, data showed minimal effects of travel (decrements mostly in non-starters), no evidence of pre-competitive anxiety (values improved pre-match), & intra-tournament decrements (small in magnitude) comparable to a previous domestic tournament.
Essentially, the data suggest that the team travelled across multiple time zones, adjusted to a foreign environment, and competed successfully on the worlds biggest stage with hardly any indication of stress or fatigue. Incredible!
Although we can’t say for sure that the strategies employed by staff can explain the findings (no control group, unfortunately), we felt that the details were worth sharing.
The paper discusses various proactive and reactive interventions that were used to support training adaptation, manage travel and competition related stress/fatigue, and aid recovery in players.
I’m very grateful to Dan and staff for the collaboration and for being open with these details. There is tremendous vulnerability in giving everyone access to how you do things. Thank you, Dan. You shared tremendous insights that many coaches and players can benefit from.
Some questions I aimed to address in analyzing >10 years of daily HRV:
Is it possible to substantially increase HRV for an extended period of time (>1 year)?
Can a reasonably healthy individual make long-term increases in HRV through aging? (limited to 10 years in my case)
Are changes in self-recorded HRV associated with changes in other health markers?
What are some likely factors that contributed to changes in HRV and health markers?
Brief Intro
People with lower HRV are more likely to die of any cause than people with higher HRV. In addition, nearly every known risk factor for cardiovascular disease is also associated with HRV, including:
Age
Gender
Inflammation
Hypertension
Hyperglycemia
Dyslipidemia
Diabetes
Overweight/obesity
Smoking
Stress
Physical activity
Lifestyle factors (diet, nutrition, sleep)
Bolded risk factors are modifiable with lifestyle intervention. Generally, improvement in one or more of these will often also improve HRV. Though HRV decreases as we get older, individuals with a greater number of healthy lifestyle behaviors tend to maintain higher HRV through aging and live longer.
The amount of day-to-day fluctuation in HRV also seems to be relevant, independent of absolute HRV values. We’ve found the coefficient of variation (CV) of RMSSD to be a very sensitive marker to training adaptations in athletes of a variety of ages and skill-levels (lower CV values generally better). In clinical settings, high visit-to-visit (to the clinic) variability in HR and blood pressure measures are independent predictors of cardiovascular morbidity and mortality. Similar results have been obtained from self-recorded (home-based) measures.
I started tracking my HRV in 2011 to determine if it was a useful training tool for powerlifting. I also wanted to know if it would be worth tracking in the team-sport athletes that I was coaching. There was evidence that HRV-guided training was superior to pre-planned approaches for endurance exercise and that it could help avoid overtraining. Over the short term (day-to-day, week-to-week), my HRV decreased with stress, when training got excessive, when I got sick, from too much alcohol, eating poorly, etc. It increased with good sleep, reduced training load, visiting family, more aerobic exercise, etc. Seeing how various behaviors and events impacted my numbers was educational. However, my long-term HRV (year-to-year) didn’t seem to change. I had a very clear average range that my body always reverted, for nearly 8 years!
I became somewhat doubtful that I could make a long-term improvement in values. Perhaps maintaining them was good enough, I thought. However, in the last few years, along with some fairly substantial changes in my lifestyle and life circumstances, my values seemed to have dramatically improved. To be sure, I dumped all of my data into some software and had a look. I also compiled relevant health markers that I’ve had measured over the years (blood work and arterial stiffness) to see how they tracked with the changes in HRV. Below is my story and the data.
Relevant Personal History
My training history and anthropometric characteristics will be relevant to some of the health markers I’ll present. I grew up playing contact sports, including hockey (age 4-16), rugby (age 12-15), and American football (D-line, age 16-21). After undergrad, I started coaching (football and S&C) and competing in powerlifting. During my football days, my weight got as high as 270 lb. For powerlifting, I competed in the 242 lb weight class (age 21-24, pic below). At age 24 (mid-2011, when I started tracking HRV), I relocated to do my Masters in Exercise Science and work as a GA with S&C. Subsequently (2013), I was a visiting researcher and adjunct professor at Auburn Montgomery where I formally began researching HRV with Dr. Mike Esco (eventually my PhD advisor). After a few projects under my belt, I pursued a PhD in Human Performance at Alabama (2014-2017). In mid-2017, I took (and remain) in a faculty position at Georgia Southern University (Armstrong campus in Savannah). From 2011-2018 I did not compete in powerlifting, but trained as if I might do so at any time.
Competing raw at 242 lb
My priorities before 2018 were:
1. Performance (strength and size)
2. Health
For reasons I’ll elaborate on later, my priorities around 2018 shifted to:
1. Health
2. Performance (strength and size)
HRV Recordings
RHR and LnRMSSD (a parasympathetic HRV index) values (n = 3598 measures) were derived from 1-min recordings performed in the standing position after waking and urinating. We’ve extensively investigated the validity of 1 min recordings for RMSSD. From 2011–2020 I used the ithlete app. We’ve previously compared ithlete vs. ECG and found good agreement for both the chest strap and finger sensor. Mid-August 2020, I upgraded my phone and it was no longer compatible with the finger sensor (no headphone slot). Thus, I began using the HRV4Training app with finger PPG enabled by the phones camera and flash. To be sure that values weren’t excessively different between tools, I performed several simultaneous recordings (finger sensor on left middle finger, HRV4training PPG on left index finger). Results below show decent agreement between apps. The magnitude of change in my HRV substantially exceeds the mean bias. Thus, I’m confident that changes were not an effect of inter-device error. Moreover, my values increased prior to the change in apps.
Tables: Comparison of RHR and LnRMSSD between ithlete finger sensor and HRV4Training camera PPG.
RHR
LnRMSSD
HRV4T
ithlete
Bias
HRV4T
ithlete
Bias
67.7
66
1.7
3.92
3.95
-0.03
61
61
0
3.73
3.7
0.03
62.5
62
0.5
3.80
3.75
0.05
65.6
65
0.6
3.84
3.7
0.14
63.2
63
0.2
4.02
4.05
-0.03
68
68
0
3.83
3.85
-0.02
69
67
2
3.86
3.75
0.11
67.1
67
0.1
3.78
3.7
0.08
56.4
58
-1.6
3.72
3.75
-0.03
56.9
56
0.9
3.70
3.75
-0.05
56.8
57
-0.2
3.75
3.7
0.05
Mean
63.11
62.73
0.38
3.81
3.79
0.03
SD
4.80
4.29
0.97
0.09
0.12
0.06
95% LOA RHR
95% LOA RMSSD
Upper
2.28
Upper
0.15
Lower
-1.51
Lower
-0.10
Data
I’ve assessed month-to-month and year-to-year values so we can focus on long-term changes. Below are a variety of different figures representing my RHR and LnRMSSD values over the last decade (I’ve converted Ln to raw values for some figures). Note that 2011 values only include 5 months (Aug–Dec) of data and 2021 only includes 7 (Jan–July). Thus, values should be compared to full-year data (2012–2020) with this in mind.
Click on figures for greater clarity and to zoom.
Figure 1. Month-to-month mean and SD of LnRMSSD and RHR values.
I’ll mention only a few notable observations here. There was a clear and sustained reduction in RHR in spring 2016. This corresponds with completion of my comprehensive final exams and HRV tracking with football through spring camp. Stress levels were very high. I was terrified of failing comps. For several months, I studied harder than you could possibly imagine. I knew that if I could pass comps, I would complete the PhD. Having published several projects previously, I was less concerned about the subsequent dissertation process. After acing comps and successfully completing spring camp data collection (first project with football), I felt tremendous relief. Everything I’d been working towards since ~2011 was coming together. In my head, I had essentially secured my future. Although I thoroughly enjoyed the process, I was liking the prospect of not living like a poor grad student for much longer. RHR remains relatively stable thereafter whereas LnRMSSD decreases in response to season-long HRV data collection with football (late 2016, early 2017), defending my dissertation, job search/interview, and relocation (all spring 2017). LnRMSSD starts to trend up in 2019 (more on this later). Note increased values in 2020 before changing apps.
Figure 2. Violin plots of daily RHR and LnRMSSD by year. Each dot represents a single day. Generally, outlier dots (low LnRMSSD, high RHR) correspond with being sick, which tends to occur once or twice per year, usually during/after travelling to visit family.
Figure 3. Bar graph of values by year. Here, I’ve included LnRMSSD values relative to HR (green). This provides some indication that HRV increased in recent years, independent of changes in HR. It’s not ideal to calculate this ratio with mixed units, but it should sufficiently represent the general trend.
Figure 4. LnRMSSD values by year with age norms (horizontal lines) and notes of key changes in lifestyle and life circumstances likely attributable to the increase in HRV
This figure puts the magnitude of recent HRV changes into perspective. With a small LnRMSSD increase in 2019, I dropped an age-class. In 2020-2021, my HRV has become comparable to that of teenaged boys. Notes on the figure are fairly self-explanatory. HRV is influenced by a variety of factors and I believe that each item on the list contributed in some way to the increased values. Will elaborate on explaining changes below.
Revaluating Priorities
Although I will always be passionate about HRV in sport, I have recently taken greater interest in HRV as a behavior-modification tool for health. This topic is something I’ve been peripherally interested in since 2011. In ~2019, my self-education (via textbooks, journal articles, podcasts, colleagues, etc.) and research activity shifted to HRV in health and disease. My training also shifted to prioritize health. I still lift heavy, but I’m less concerned with being as big and strong as humanly possible (more on this below). It was becoming clear to me that such goals were not conducive to my cardiovascular health. A few key events triggered this dramatic change:
1) My bloodwork in 2015 revealed an unfavorable lipid profile (LDL-C and Total-C were high), which planted a seed.
2) In tracking HRV in college football players, we observed that linemen demonstrated sustained reductions in LnRMSSD throughout the season. In some cases, RHR’s were ~100 bpm. To explain these findings, I went down a rabbit hole on cardiovascular health in linemen. The research was grim. What effect had years of football and powerlifting training (high volumes of static hemodynamic stress), in addition to a fairly high body mass, have on my cardiovascular health? *Because it’s relevant in the current context, I’ll mention that I have never used anabolic steroids. Thus, these should not be considered as potential factors that affected the health markers I’ll share below.
3) Occasional episodes of obstructive sleep apnea (not formally diagnosed by a physician), mostly following a day where I’d overeat. I had no idea until my wife would describe what my breathing (or lack thereof) sounded like in the middle of the night. My roommate at a conference also pointed it out. This condition is common in larger individuals (e.g., linemen, powerlifters) and is associated with an increased risk of cardiovascular disease.
4) With a new lab toy in 2018, I learned that I had fairly stiff arteries for my age. I have a very limited family history of cardiovascular disease (despite most of us having high cholesterol), but I had to consider that no previous family member has had my body mass or lifestyle. I’ve included a pic below from my football days (~270 lb, ~2006) so you can see how I compared to some family members. Collectively, these events (among others) prompted me to prioritize health over performance.
To clarify, it’s not like I was living a terribly unhealthy lifestyle from 2011-2018. Health was still a priority, just not number one. I ate primarily whole foods (ample fruits and vegetables), lifted 4 days per week, and performed some form of aerobic exercise ~90 min per week. But there was certainly room for improvement. Let’s be honest, it’s hard to maintain 250 lb eating spinach and chicken breasts. Binge eating once or twice per week was pretty standard. The BBQ and mac n cheese in Alabama were the real deal, and there was a Cheesecake Factory nearby. Stress was high. I took on a lot of work and there was a lot of uncertainty (I relocated 5 times during this period). Thus, the type of changes I needed to make were easy to identify.
The impact of reduced work-related obligations (i.e., stress) due to the pandemic cannot be overstated. I say this while acknowledging that the pandemic brought substantial stress and hardship for others. We were fortunate that this was not the case for us. Working from home gave me 100% control over my schedule and allowed me to maintain a strict routine (I thrive with routine). I’m a very happy person when I can eat, train, work, and sleep at consistent times. I’m also mostly an introvert, so I didn’t mind less social activity. Moreover, I was able to dedicate more time to analyzing data and writing papers. I love teaching and interacting with students, but I find the research component to be the most challenging and gratifying part of my job. These psychological factors undoubtedly contributed to the improved HRV, likely via less reductions.
Not being able to go to restaurants during the lockdown further improved my diet. We’d typically go downtown for dinner ~1x/week and I’d overeat every time. I couldn’t lift for weeks. This was the first time I did not perform heavy barbell movements for an extended period of time (>1 week) since I was 16 years old. With facility closures, I resorted to body weight circuits, burpees, and a ton of jump-rope. It was around this time that I really started to notice that my HRV was increasing and becoming more stable (screen shot below). It was also the first time I seriously considered that my powerlifting training was preventing my values from improving. But it was hard to rule out the effects of other factors (reduced work stress, improved diet, etc).
LnRMSSDx20 from lockdown in 2020
Training has changed slightly with my shift in priorities, but is still taken very seriously (put a gym in the garage, pic of beautiful rack below). Although, I’ll admit that the first two pieces of equipment that I bought were a treadmill and an air bike. I continue to lift 4x/week and perform relatively heavy singles and triples, etc. But I don’t use a belt and I leave a minimum of 1 or 2 reps in the tank (minimal grind). I do more bodyweight movements for assistance exercises and maintain a higher tempo (less rest, supersets, etc.) for the cardiovascular stimulus. My overall volume is lower. I’ve eliminated overuse issues (and associated joint inflammation). I start and finish each training session with 10 min steady-state on the air bike. I do another 30 min on the air bike on non-lifting days (1 day continuous, 1 day tempo, 1 day HIIT). Under these conditions, I still aim to progressively increase strength and muscle mass, but I’m less bothered if my numbers are static for a while. I enjoy the training nonetheless.
Beautiful Rack
Screen-shots below show how my body mass changed (-10 lb) in 2019 with my shift in interest and priorities, and how my step-count skyrocketed after Jen (my wife) and I adopted a puppy (summer 2020). We named her Penny Lane and she’s also shown below. My body composition is better and I’ve pretty much eliminated episodes of sleep apnea.
Body mass change through 2019
Increase in step-count in 2020
Penny Lane
My body mass has held steady at ~235 lb since Dec. 2019. I’ve averaged ~15000 steps per day (training sessions excluded) for nearly a year now (daily range: ~12000 – 28000 steps). This is largely attributable to getting a dog and having to do my lawn twice/week most of the year. The massive bump in physical activity and time spent outdoors in Savannah’s parks and trails (i.e., nature) likely had some impact on my numbers. Moreover, timing of the walks (post-waking, and post-meals) directly improves metabolic responses to feeding and may indirectly contribute to improved numbers long-term.
I’ve been eating twice/day (~noon and 6 pm) since shortly before the pandemic. I rarely binge and eat minimal processed foods. Plenty of meat, seafood, nuts, fruits and vegetables. Our combined income doubled in the last couple years. This has reduced financial stress and enabled us eat higher quality foods. Living on the coast, we eat fresh seafood 1-3x per week. I upgraded my fish oil from Costco-brand to Carlson’s liquid fish oil and take a higher daily dose.
Figure 5. LnRMSSD coefficient of variation (CV) by year. CV = (SD/Mean)*100
Greater fluctuation in values are generally associated with poorer health and lower fitness (there are exceptions). For example, unhealthy individuals tend to show the highest day-to-day variation in HRV, whereas highly fit athletes show the least day-to-day variation. My HRV fluctuations peaked during the PhD (not surprising) and have since progressively improved. Recall that 2011 only included 5 months, so that value (5.66%) is likely an inaccurate representation of the full year. I believe most app companies are drastically underestimating the value of this parameter. Many apps don’t even report it. That will likely change.
Arterial Stiffness
Pulse wave velocity is a marker of arterial stiffness. Stiff arteries are bad news in terms of cardiovascular risk. Football linemen experience arterial stiffening following one or more seasons at the collegiate level. Chronic lifters (i.e., powerlifters and strength athletes) have stiffer arteries than healthy controls, and stiffness seems to be associated with length of training history (greater history of lifting = stiffer arteries). This does not bode well for me. A couple years ago, we acquired a tool in our lab that measures pulse wave velocity via carotid-femoral applanation tonometry. This is when I learned that my arteries were much stiffer than norms for my age (values in the range of 50-59 year olds!). With the aforementioned changes to my lifestyle, I was able to see nice improvement in this value (dropped an age group) with the increase in my HRV (see below).
Figure 6. Pulse wave velocity and daily averages for steps, RMSSD, and RHR from the full month of Oct. 2019 and Oct 2020.
RMSSD improved despite a similar RHR. This is relevant because there is great debate among researchers that HRV is explained almost entirely by RHR. I strongly disagree with this. They are certainly correlated in cross-sectional studies, but with self-tracking over time, dissociation is common. Note that a daily change from 60-85 ms is nothing to write home about, but a monthly average change of this magnitude is substantial.
Stiff arteries are problematic for a variety of reasons. For one, arterial baroreceptors (embedded within the arterial wall of the carotid bodies and aortic arch) are sensitive to stretch/deformation, thereby relaying information about blood pressure changes to the brain. They cannot detect changes in pressure very well if the wall they reside in becomes stiff. Without important information from baroreceptors about pressure changes, blood pressure can become dysregulated. Vagal modulation of HR is one of the primary ways that the brain regulates blood pressure. Thus, reducing arterial stiffness may enhance cardio-vagal baroreflex sensitivity, which may improve regulation of blood pressure and improve HRV.
Bloodwork
Thanks to Carl Valle and Inside Tracker, I’ve had some bloodwork done (“Ultimate” panel https://www.insidetracker.com/ultimate/) a few times over the past several years. Importantly, I have bloodwork from mid-PhD in fall 2015 when my HRV was lower and from late summer 2021, when my HRV was substantially higher. Although the gap between measures is lengthier than ideal, the changes are still worth examining. The figure below highlights key changes in relevant biomarkers and HRV.
Figure 7. Absolute changes in blood biomarkers and HRV parameters (month average).
Virtually all biomarkers improved (to varying degrees) along with the increase in HRV, as to be expected with the noted lifestyle changes. My triglyceride/HDL-C ratio (a predictor of cardiovascular disease risk) improved from 2.2 to 1.5. There is research linking hsCRP (systemic inflammation), vitamin D, lipid profiles, and cortisol (stress hormone) to HRV. I will not attempt to make any association here given the length of time between measures and overall sensitivity of HRV to a variety of factors. But the directionality of changes support the idea that improving HRV through lifestyle changes is likely associated with improvements in some blood biomarkers.
Wrap-up
Based on my analysis and interpretation of my data, it seems that:
A “reasonably” healthy individual can make long-term increases in HRV, despite aging 10 years
Changes in self-recorded HRV seem to be associated (in some form) with changes in other health markers
Changes in lifestyle factors unquestionably contributed to improved HRV, and in turn, a likely reduction in cardiovascular risk. However, the extent to which any given change in lifestyle (walking, diet, weight loss, stress reduction, etc.) contributed to the change in HRV is unclear. I suspect there is synergy among the various factors.
It feels strange to publicly share a lot of these personal details, but I think there is value in this n=1 case study. I’m hopeful this story encourages others to take greater interest in their cardiovascular health. A great place to start would be to find out your numbers.
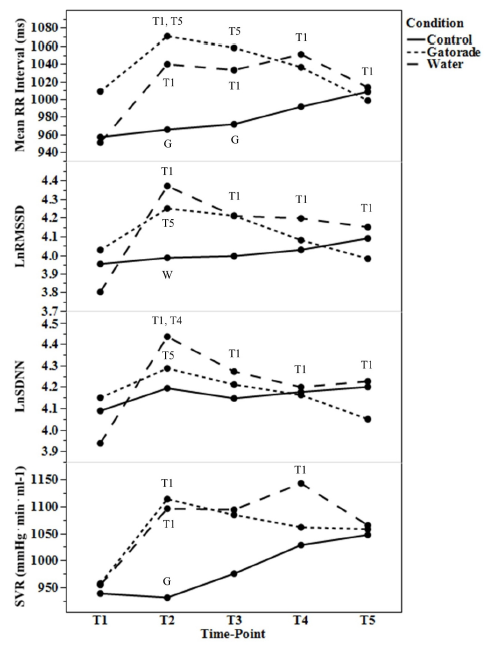
Context: we previously resorted to standardized HRV measures performed in the athletic training room with college football players to overcome non-compliance with post-waking tests.
Problem: pre-training hydration practices confound HRV measures. Players typically opt for cold bottles of water or Gatorade. Thus, we needed to determine how much and for how long these drinks impacted HRV.
Findings: Gatorade had small effects that lasted about 45 min. Effects of water were larger and persisted for 60 min.
Key points:
If measuring HRV in a lab/clinic/training facility, be mindful of recent fluid ingestion. HRV measures obtained within 60 min of 591 ml water or 45 min of an equal volume of Gatorade will be capturing their physiology effects and result in falsely elevated values. This would result in misinterpretation of autonomic status.
When first getting started with tracking HRV in athletes, the inter-individual variation in trend characteristics can be confusing. Some athletes will display very high values and others will show lower values. Likewise, some will show quite stable values while others display substantial day-to-day variation. Naturally, the following question arises: why do some athletes have higher and more stable values than others?
Collegiate swim rosters typically include a mixed roster of athletes (males and females with a broad range of experience and skill). In this investigation we compared HRV trend characteristics between the national-level (including 6 Olympians) and conference-level sprint-swimmers throughout 4 weeks of standardized preparatory training. We also obtained details of individual training history.
The main findings were that national-level swimmers had higher and more stable HRV (higher mean LnRMSSD, lower LnRMSSD coefficient of variation) than their conference-level teammates. Differences in trend characteristics were attributable to a greater history of training and competing among the national-level swimmers (i.e., greater training age).
Whether these findings can be explained by greater aerobic fitness (we don’t think so), greater familiarity with training (possibly), or chronic physiological adaptations (possibly) among the higher-level swimmers is unclear.
The findings may be of some practical use for coaches when interpreted with previous work (see links below). For example, preliminary expectations with HRV monitoring should be that higher-level swimmers will display higher and more stable values throughout training and vice-versa for lower-level athletes. This may be interpreted to mean that the higher-level athletes could tolerate greater loads or that the lower-level athletes may need reduced loads. However, it is unclear if these training modifications would offer any performance/adaptation advantage. In addition, a higher-level athlete showing lower and less-stable values may be cause for concern (fatigue, stress, detraining, etc. depending on context). Whereas a lower-level athlete displaying higher and more stable values is likely adapting well to the training.
We’ve previously assessed how overload and tapering impact HRV in sprint-swimmers here.
We’ve previously assessed associations between subjective indicators of recovery and daily HRV in sprint-swimmers here.
Our new meta-analysis determined that parasympathetic hyperactivity in overreached endurance athletes is best detected using weekly averaged versus isolated HRV values and in the standing versus supine position.
Thanks to Agustín Manresa-Rocamora, Antonio Casanova-Lizón, Juan A. Ballester-Ferrer, José M. Sarabia, Francisco J. Vera-Garcia, and Manuel Moya-Ramón for inviting my collaboration.