New study: “Effects of Position and Injury Status on Associations Between Preseason Workload and Heart-Rate Variability Profiles in American College Football Players”
Main findings:
The effect of very high preseason training loads on HRV in college football players varies by position group.
Skill group players who consistently performed the highest total workloads had the most stable HRV, which typically reflects high/increasing fitness.
Conversely, mid-skill group players who performed the highest total workloads had the least stable HRV (often reflects fatigue), along with greater daily variation in high intensity outputs.
Thus, skill players tolerated high loads with stable HRV while mid-skill players better maintained high intensity movement and stable HRV at more moderate workloads.
HRV tended to be lower in those who were playing hurt (“go as can” status), and we suspect that the association between HRV and injury is bidirectional (low HRV precedes injury, injury causes reduced HRV).
New study of ours comparing the Biostrap Kairos wristband to ECG for HRV assessment.
The Kairos wristband offers on-demand heart rate variability (HRV) assessment through its “Spot Check” feature, enabling standardized recordings for clinical, research, or self-tracking purposes, but its validity is untested. Therefore, we compared the Kairos wristband to electrocardiography (ECG) for resting HRV assessment in young adults, and investigated the influence of skin pigmentation (M-index) on measurement accuracy.
Here’s a new study from our lab entitled “Self-recorded heart rate variability profiles are associated with health and lifestyle markers in young adults”. The full text can be accessed for free through this link: https://rdcu.be/cUd9T. A practical summary is provided below.
We’ve been tracking ANS status in athletes via daily ultra-short HRV for nearly 10 years now. In general, we (and others) have found that higher and more stable values are often observed in athletes who are more aerobically fit and who are adapting well to training. Contrastingly, lower and less stable values are commonly observed when athletes are stressed, fatigued from training, and not adapting favorably.
There is also a sizable body of research showing that isolated HRV derived from clinical and laboratory assessment is associated with a variety of health and lifestyle markers in general and clinical populations. Healthier individuals tend to have higher vagal-mediated HRV, are less likely to develop chronic diseases, and often live longer. There is also research showing that less stable HR parameters (i.e., greater day-to-day fluctuation) are independently associated with an increased risk of cardiovascular events in older adults. Importantly, HRV is modifiable. With lifestyle improvement, one can make their HRV higher and more stable. Here’s a case example showing substantial improvements in HRV and other healthy markers with improvements in various lifestyle factors: https://hrvtraining.com/2021/08/10/increasing-hrv-and-cardiovascular-health-10-year-case-study/.
Thus, similar to how we track HRV in athletes to guide training and monitor adaptations, we hypothesize that regular folks can track their HRV to guide lifestyle behaviors towards those that increase cardiac-parasympathetic function, thereby supporting health and longevity. However, no previous investigations have examined the association between self-recorded HRV and health/lifestyle metrics in young adults using accessible HRV tools and ultra-short (60-s) daily recordings. Therefore, that’s what we set out to do.
We had subjects perform 60-s post-waking HRV recordings in the supine and standing position with a cost-free smartphone application and Bluetooth chest strap for 7 days. They also wore an Actigraph on their wrist to measure activity levels and sleep profiles. Following the observation period, we obtained a variety of cardiovascular, metabolic, and psychoemotional health markers in the laboratory.
As anticipated, higher and/or more stable HRV parameters were generally associated with more favorable cardiovascular (higher VO2max, lower systolic and diastolic blood pressure, and lower aortic stiffness), metabolic (lower body fat percentage, fasting glucose, and LDL-C), and psychoemotional (lower perceived stress) health markers. Some variation between sexes and recording positions were noted. Additionally, most, but not all, associations weakened after adjusting for VO2max, supporting previous work indicating that increasing fitness is one of the most effective ways to increase HRV and derive health benefits associated with increased parasympathetic (and reduced sympathetic) modulation. For more details and conclusions, see the full text here: https://rdcu.be/cUd9T
If success leaves clues, then there was something to learn from what Dan Howells & staff did to prepare GB 7s for the 2016 Olympics where they advanced to the gold medal final with an undefeated record.
After sorting through the data (HRV, wellness, training load) and having several video and email conversations with Dan, we decided to share the story of their Olympic expedition.
Prior to analyzing the data or obtaining specific details from Dan, I anticipated substantial decrements in status markers in response to a full day in transit (travel fatigue/jet lag, etc.), pre-tournament (arousal/anxiety), & throughout the tournament (match fatigue, sleep loss).
However, data showed minimal effects of travel (decrements mostly in non-starters), no evidence of pre-competitive anxiety (values improved pre-match), & intra-tournament decrements (small in magnitude) comparable to a previous domestic tournament.
Essentially, the data suggest that the team travelled across multiple time zones, adjusted to a foreign environment, and competed successfully on the worlds biggest stage with hardly any indication of stress or fatigue. Incredible!
Although we can’t say for sure that the strategies employed by staff can explain the findings (no control group, unfortunately), we felt that the details were worth sharing.
The paper discusses various proactive and reactive interventions that were used to support training adaptation, manage travel and competition related stress/fatigue, and aid recovery in players.
I’m very grateful to Dan and staff for the collaboration and for being open with these details. There is tremendous vulnerability in giving everyone access to how you do things. Thank you, Dan. You shared tremendous insights that many coaches and players can benefit from.
Here’s an October 2021 update on my quest to reduce arterial stiffness. For the original story and context, see previous post here.
After a year of >15 000 steps/day, continued adherence to improved nutrition, and a modified training approach, I saw another nice reduction in carotid-femoral pulse wave velocity (cf-PWV) along with an increase in RMSSD (see figure below).
RMSSD values (post-waking, standing position) from this October were the highest I’ve recorded to date. It seems that the more I try to reduce cf-PWV and improve my cardiovascular health, the more my HRV increases, despite no change in RHR. This strengthens my view that HRV can be an effective behavior-modification tool for health.
An important training modification that I implemented this October was changing my 10-min post-lift steady state air bike ride to intervals. The protocol is simply to pedal hard (though sub-maximally) for the first 10 s of every min for 10 min (excluding the first minute). Over ~4 weeks my “sprint” intensity naturally increased from ~450-500 to ~500-550 watts and recovery intensity from ~150 to ~180 watts. I’m pretty confident that this change accounts for the further increase in RMSSD. I performed a very similar protocol back in 2014 (post-lift intervals, 2014 figure re-posted below) for 2 weeks and saw an immediate increase and stabilization in my RMSSD values (middle of trend, LnRMSSDx20), which reverted to “normal” after cessation. My October 2021 PWV assessment occurred 2 weeks after starting this protocol, so it’s hard to say how much this may have had an effect.
Post-RT interval training may be a more time-efficient method to counteract the intense RT-induced arterial stiffening. Studies have shown that 30 min steady state, or 10 min of intervals on a bike attenuate post-RT increases in cf-PWV. Only 10 min of steady state riding attenuates RT-induced endothelial dysfunction (which is what originally inspired me to include this after my lifts). In terms of practicality, most lifters will unlikely perform 30 min of aerobic work post-RT. Ten min may be an easier sell. The intervals I’ve been experimenting with may be intense enough to provoke the desired effects, though short and submaximal enough for long-term use. Spearheaded by my incredibly intelligent and competent GA, Joe Vondrasek, we plan to investigate this further next year. We need to determine how such a protocol impacts both cardiovascular health markers and RT adaptations (i.e., day-to-day recovery, interference effect, etc).
I’m happy with the progress I’ve made thus far in reducing arterial stiffness (8.6 to 7.2 m/s). For context, below are norms for cf-PWV from this study. My values are now much closer to norms for my age group. Moving forward, my goal is to resume heavier powerlifting training while maintaining step-count, post-lift interval training, and aerobic work on non-lifting days to see if I can keep PWV under control while building my strength back up to respectable levels.
As part of my PhD work at Alabama, we tracked HRV in football players from day 1 of preseason training through to the national championship. A practical summary of some key findings follow the full-text link below.
Fluctuations in HRV are expected throughout a season. However, chronically suppressed values are cause for concern. Sustained parasympathetic hypoactivity is associated with various pathological conditions and is a hallmark of stress and impaired recovery in athletes.
We learned from spring camp that day-to-day HRV recovery was delayed in linemen vs. the smaller and more aerobically fit skill players. Thus, we anticipated that linemen would be more susceptible to attenuated HRV throughout the season.
HRV started to decline by week 6 of the competitive period for linemen. A couple notable events occurred here: 1) the first of 5 consecutive SEC match-ups vs Top 25 nationally-ranked opponents and 2) the week of mid-term exams for many players.
Although significant group-level reductions for linemen weren’t observed until later, key players showed descending HRV by mid-season, in the absence of changes in PlayerLoad. Suppressed HRV preceded illness and injury in 2 starters. Temporary rest restored HRV.
Group-level reductions occurred during an intensive camp-style preparation period for the college football playoffs following the SEC championship. Most players took a hit to their HRV, but linemen were hit the hardest. Note magnitudes of the effect sizes in the table below.
HRV remain suppressed for linemen through prep weeks for the national semi-final and the national championship. Smaller decrements (non-significant) were observed for skill players. In addition to accumulating physical stress, psycho-emotional factors (pre-competitive anxiety, pressure to perform, media attention, etc) likely contributed.
Although we emphasize the toll of a season on linemen, some skill players also showed suppressed values. The table below shows the rate of change in HRV for all players. 25% of skill and 63% of linemen showed sig. descending HRV patterns throughout the season.
Linemen experience hypertension, arterial stiffening, and pathologic LV hypertrophy following 1 or more seasons. These maladaptations are possibly preceded by ANS imbalance. We hypothesize that larger players showing the worst HRV profiles suffer the greatest decrement in cardiovascular health markers.
If so, intervening when a decreasing HRV pattern is observed may not only be relevant to performance (limiting fatigue, injury-, and infection-risk), it may also help mitigate the cardiovascular toll of playing football at such a high level. Seeking funding to explore this in the future.
The findings highlight potential deficiencies in or greater taxation to the coping capacity of linemen vs. smaller players. Factors hypothesized to contribute to more prevalent ANS imbalance in linemen and potential implications for health and performance are summarized below.
Linemen need careful attention and monitoring. We need strategies to prevent ANS imbalance from occurring (load management, aerobic capacity, treatment of health conditions like sleep apnea, etc) and we need restorative methods to implement if it occurs.
Tracking HRV with a mobile app was inexpensive and easy. Time-demand from players was ~3 min/week while waiting to get taped. Though sub-optimal relative to post-waking measures, this approach enabled timely detection of descending patterns, which may be useful for guiding interventions relevant to player health and wellbeing.
Though a better understanding of the health and performance ramifications of suppressed HRV in football players is needed, a descending pattern may serve as an easily identifiable red flag requiring attention from performance and medical staff.
When first getting started with tracking HRV in athletes, the inter-individual variation in trend characteristics can be confusing. Some athletes will display very high values and others will show lower values. Likewise, some will show quite stable values while others display substantial day-to-day variation. Naturally, the following question arises: why do some athletes have higher and more stable values than others?
Collegiate swim rosters typically include a mixed roster of athletes (males and females with a broad range of experience and skill). In this investigation we compared HRV trend characteristics between the national-level (including 6 Olympians) and conference-level sprint-swimmers throughout 4 weeks of standardized preparatory training. We also obtained details of individual training history.
The main findings were that national-level swimmers had higher and more stable HRV (higher mean LnRMSSD, lower LnRMSSD coefficient of variation) than their conference-level teammates. Differences in trend characteristics were attributable to a greater history of training and competing among the national-level swimmers (i.e., greater training age).
Whether these findings can be explained by greater aerobic fitness (we don’t think so), greater familiarity with training (possibly), or chronic physiological adaptations (possibly) among the higher-level swimmers is unclear.
The findings may be of some practical use for coaches when interpreted with previous work (see links below). For example, preliminary expectations with HRV monitoring should be that higher-level swimmers will display higher and more stable values throughout training and vice-versa for lower-level athletes. This may be interpreted to mean that the higher-level athletes could tolerate greater loads or that the lower-level athletes may need reduced loads. However, it is unclear if these training modifications would offer any performance/adaptation advantage. In addition, a higher-level athlete showing lower and less-stable values may be cause for concern (fatigue, stress, detraining, etc. depending on context). Whereas a lower-level athlete displaying higher and more stable values is likely adapting well to the training.
We’ve previously assessed how overload and tapering impact HRV in sprint-swimmers here.
We’ve previously assessed associations between subjective indicators of recovery and daily HRV in sprint-swimmers here.
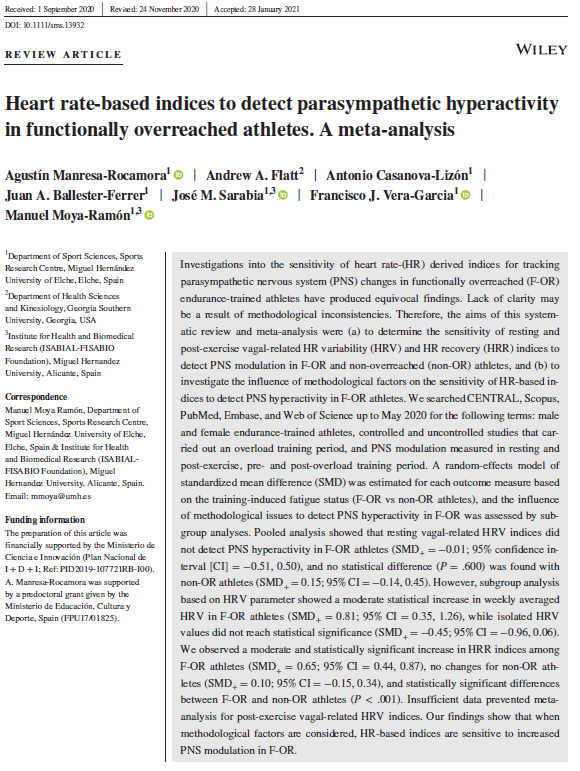
Our new meta-analysis determined that parasympathetic hyperactivity in overreached endurance athletes is best detected using weekly averaged versus isolated HRV values and in the standing versus supine position.
Thanks to Agustín Manresa-Rocamora, Antonio Casanova-Lizón, Juan A. Ballester-Ferrer, José M. Sarabia, Francisco J. Vera-Garcia, and Manuel Moya-Ramón for inviting my collaboration.
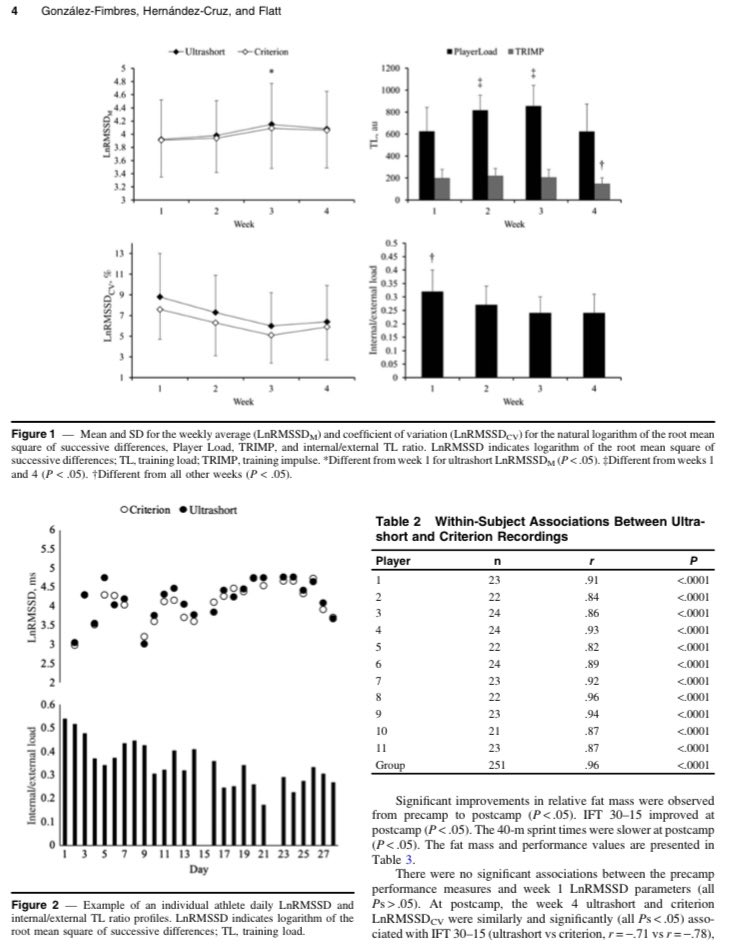
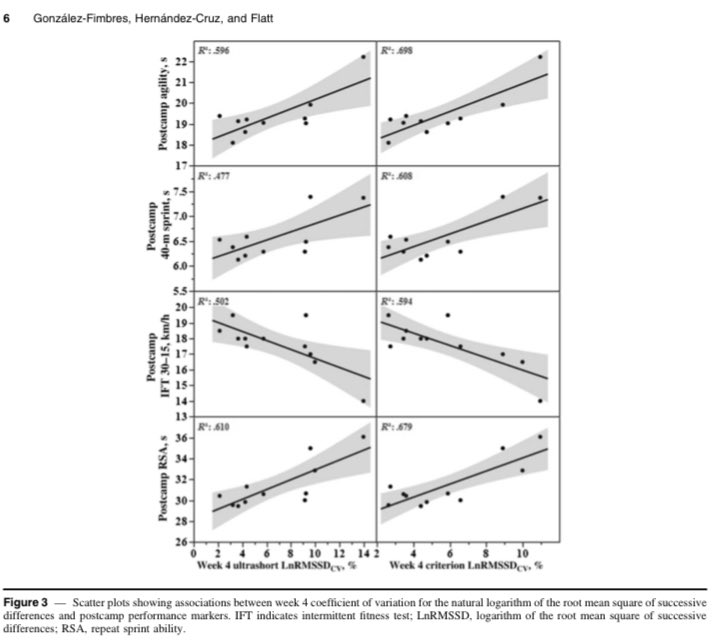
Here’s our latest study comparing 1 min vs 5 min HRV throughout a 4-week camp in international-level girls field hockey players. Values were highly correlated, showed similar responses to load, & similar associations with fitness. Practically same insight, 80% less time. Thanks to Drs. Gonzalez-Fimbres and Hernandez-Cruz for the collaboration.
Intensive training periods tend to increase RHR and decrease HRV, reflecting stress and fatigue. However, adaptations to heat exposure (e.g., plasma volume expansion) tend to have the opposite effects. So we wanted to see what happens when players were exposed to both intense training and intense heat stress during preseason camp.
Despite increases in perceived fatigue throughout the 2-week period, RHR and HRV reflected responses consistent with heat acclimation.
HRV initially decreased in linemen, then peaked after a day of rest. Non-linemen faired a little better with smaller decrements in perceived fatigue and more frequent day-to-day improvements in RHR and HRV.
These results indicate that heart rate parameters and perceived fatigue are independent markers of training status, and that desirable cardiovascular adaptations can occur in the presence of soreness and fatigue.
This is especially important for tech companies who try to infer recovery status from HRV alone. As HRV improved throughout camp, an app’s algorithm would report to coaches that players are well-recovered. Given that no player feels well-recovered during preseason camp in the heat, the technology suddenly loses credibility for being wrong and will likely be dismissed.
This is unfortunate because the heart rate parameters are likely reflecting important adaptations that may indicate better tolerance to training in the heat, a reduced exercising heart rate, and improved fitness. Thus, I encourage users to ignore “recovery” scores and interpret the data in appropriate context.
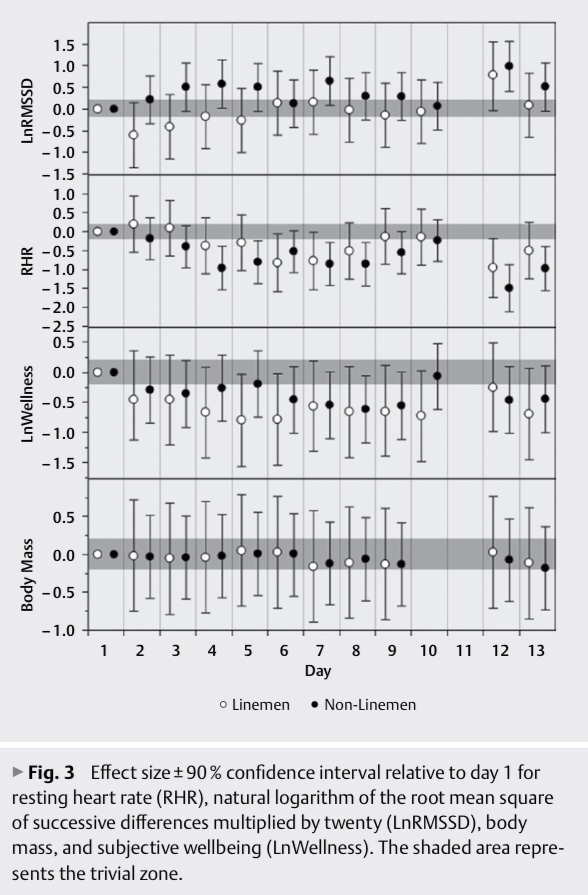
We aimed to characterize cardiac-autonomic responses to a 13-day preseason camp in the heat among an American college football team. Players were categorized as linemen (n=10) and non-linemen (n=18). RHR, natural logarithm of the root-mean square of successive differences multiplied by twenty (LnRMSSD), and subjective wellbeing (LnWellness) were acquired daily. Effect sizes±90% confidence interval showed that for linemen, LnRMSSD decreased (moderate) on day 2 (71.2±10.4) and increased (moderate) on day 12 (87.1±11.2) relative to day 1 (77.9±11.2) while RHR decreased (small–moderate) on days 6, 7, and 12 (67.7±9.3–70.4±5.5 b∙min-1) relative to day 1 (77.1±10.1 b∙min-1). For non-linemen, LnRMSSD increased (small–large) on days 3–5, 7, 12, and 13 (83.4±6.8–87.6±8.5) relative to day 1 (80.0±6.5) while RHR decreased (small–large) on days 3–9, 12, and 13 (62.1±5.2–67.9±8.1 b∙min-1) relative to day 1 (70.8±6.2 b∙min-1). Decrements in LnWellness were observed on days 4–10 and 13 for linemen (moderate) and on days 6–9, 12, and 13 for non-linemen (small–moderate). Despite reductions in LnWellness, cardiac-autonomic parameters demonstrated responses consistent with heat-acclimation, which possibly attenuated fatigue-related decrements.