I’ve been continuing to work with Zarius out of our lab here at AUM. I provided a detailed account of his recent powerlifting meet prep and competition data in this post. Zarius is 22 years old, weighs 120lbs and has Cerebral Palsy. Due to travel/work schedules we have had a hard time completing a solid training cycle since his last competition earlier this summer. We were finally able to get a good 1 month of training in before one of us had to travel again. Here is an overview of the training and HRV data from our most recent training cycle.
The Plan:
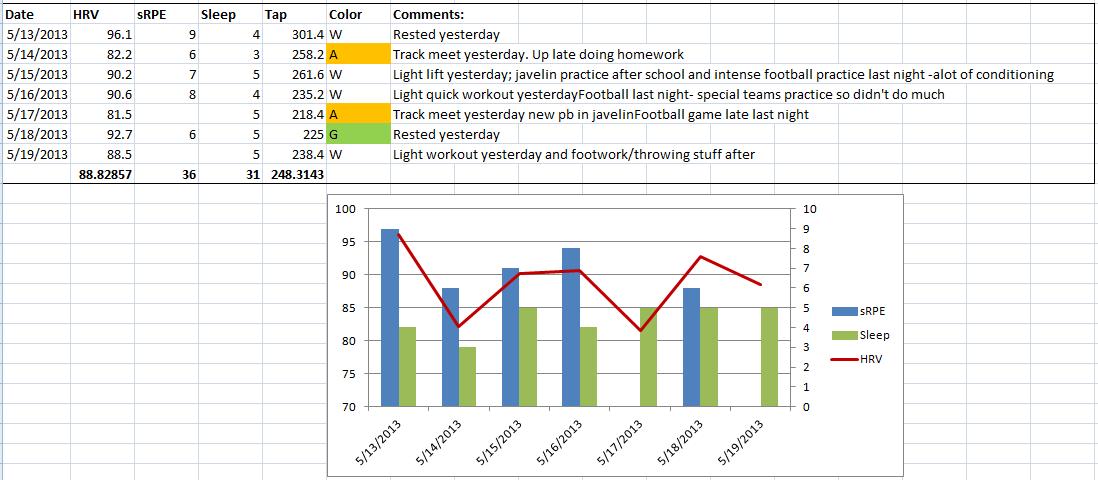
Our schedules allow for 3 training days per week. We train full body every Mon-Wed-Fri. Zarius is able to do some lower body exercises and we always finish each session with some walking laps around the track. (As an aside, prior to getting involved with the Human Performance Lab here at AUM about a year ago, Zarius’ main mode of transportation was his wheel chair. Now he walks most of the time. A testament to the great work done by Dr. Esco and the staff here at AUM as well as the effort put forth by Zarius.) Since we’re not currently preparing for a meet, we only performed the competition press once per week and performed incline and narrow-grip press on the other two training days as his main movements. I also started recording RPE for each set of his main lifts. There is definitely a learning curve to using RPE so I take the earlier values with a grain of salt. Volume for the main lifts remained constant while intensity increased each week. For his assistance work we just did some basic progressive overload. Since we wouldn’t be training for at least a week after the training cycle I wanted to overreach him a little. Zarius recorded his HRV each morning after waking with ithlete in a seated position.
The Data and Analysis:
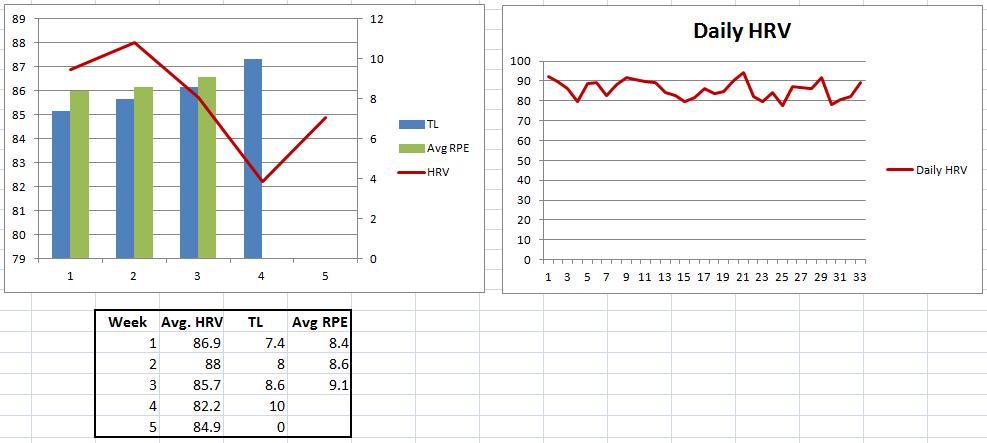
* Training Load (TL) above is simply referring to the average intensity (%1RM) that we used for his main lifts that week. 7.4=74% , etc. For his future cycles, I’ll be collecting sRPE as he gets more comfortable with the rating system.
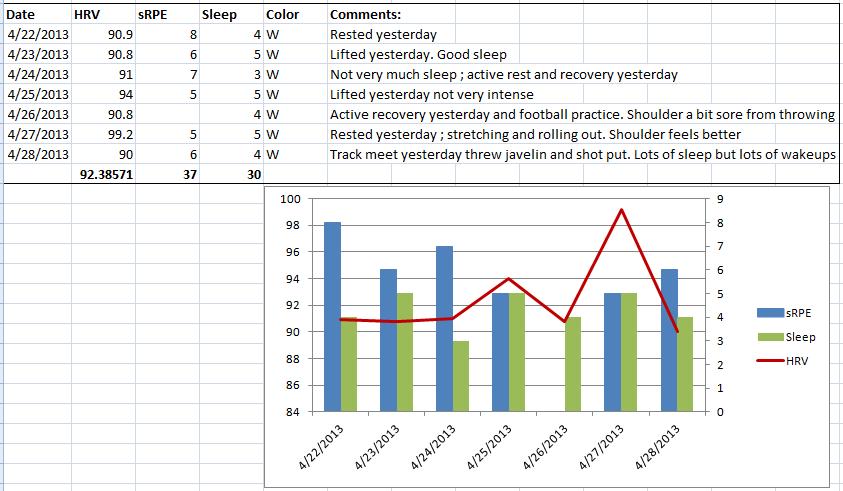
Week 1:
– Lowest intensity week
– Avg. RPE for main lift this week was 8.4
– Previous week mean HRV was 85.2 to serve as a baseline, though not on chart. Near +2 increase (86.9) in HRV after week 1.
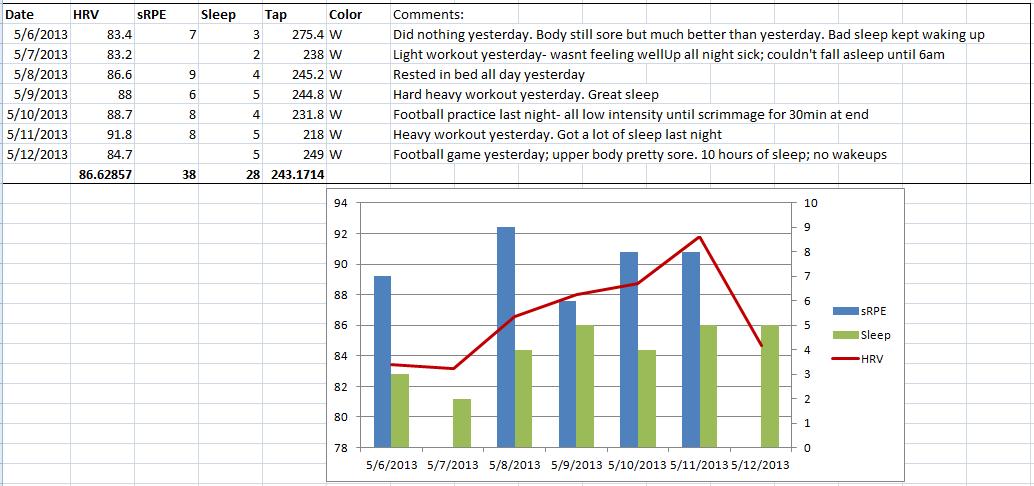
Week 2:
– Intensity increases
– Avg. RPE for main lifts this week increases slightly to 8.6
– +1 increase in week mean HRV. Training is well tolerated and apparently not very stressful.
Week 3:
– Highest intensity week
– Avg. RPE for main lifts this week increases to 9.1. This week he had four RPE@10 compared to week 2 which had 1 RPE@10 and 0 in week 1. (RPE@10 means it was a maximal set, no further reps could be performed)
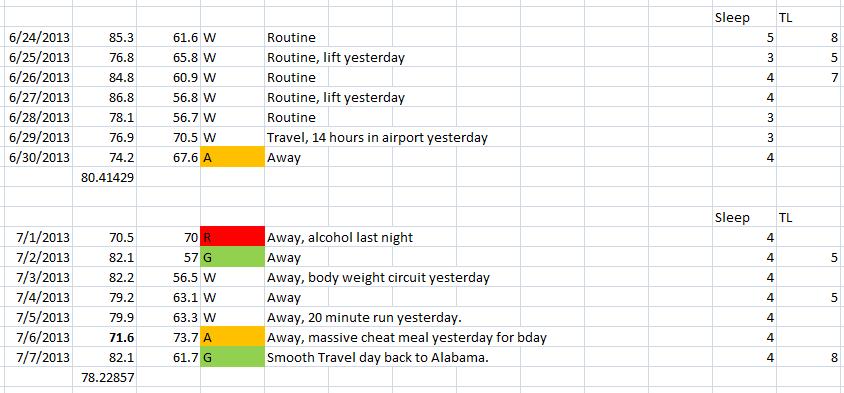
– As expected and consistent with his previous meet prep cycle, HRV declines this week -2.3 to 85.7. You’ll note that on weekends his HRV tends to climb back up, indicating good recovery even though the week was quite physically stressful.
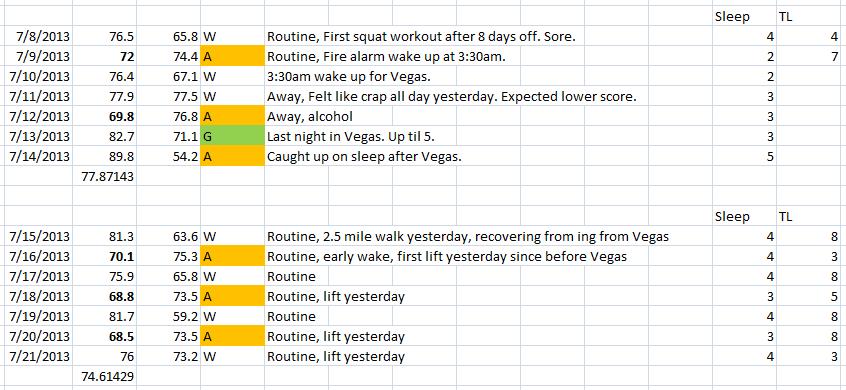
Week 4:
– Low intensity lift on Monday
– Bench 1RM Test with competition rules (pause and rack command) on Wednesday. Zarius pressed 260lbs cleanly (at 120lbs bodyweight) which is a 10lb Gym personal record and is 5lbs over his competition best of 255lbs.
– – 3.5 change in HRV this week down to 82.2. This is consistent with his competition cycle where HRV reached lowest values the week of competition. However, we deloaded after week 3 of his competition prep which allowed HRV to recover and peak going in to competition. In this case, due to time constraints, we tested before the deload. It’s possible he may have been stronger with a proper deload before testing.
Week 5:
– No training this week due to travel
– HRV week mean returns to baseline at 84.9 (the week before the start of the cycle with no training had a week mean HRV of 85.2).
Overall, this was a successful training cycle based on the result of his 1RM test. Training to at or very near failure with high intensity appeared to have a large effect on his HRV during training evidenced by the downward trend starting in week 3. Though volume was reduced considerably, the 1RM test day appeared to be very taxing as it had the biggest effect on his HRV (consistent with his previous competition). During week 5 where there were no training sessions, HRV returned to baseline values.
Here is a little video interview that the local media did on Zarius. Take a second and check it out. http://www.montgomeryadvertiser.com/apps/pbcs.dll/article?AID=2013130726027