Early HRV changes relate to the prospective change in VO2max in female soccer players

It’s been a good start to the Thanksgiving break with the  acceptance of our latest study entitled “Initial weekly HRV response is related to the prospective change in VO2max in female soccer players” in IJSM (Abstract below).

We’re currently working on supporting these findings with a much larger sample size in the new year.

ABSTRACT

The aim of this study was to determine if the early response in weekly measures of HRV, when derived from a smart-phone application, were related to the eventual change in VO2max following an off-season training program in female soccer athletes. Nine female collegiate soccer players participated in an 11-week off-season conditioning program. In the week immediately before and after the training program, each participant performed a test on a treadmill to determine maximal oxygen consumption (VO2max). Daily measures of the log-transformed root mean square of successive R-R intervals (lnRMSSD) were performed by the participants throughout week 1 and week 3 of the conditioning program. The mean and coefficient of variation (CV) lnRMSSD values of week 1 showed small (r = -0.13, p= 0.74) and moderate (r = 0.57, p = 0.11), respectively, non-significant correlations to the change in VO2max at the end of the conditioning program (∆VO2max). A significant and near-perfect correlation was found between the change in the weekly mean lnRMSSD values from weeks 1 and 3 (∆lnRMSSDM) and ∆VO2max (r = 0.90, p = 0.002). The current results have identified that the initial change in weekly mean lnRMSSD from weeks 1 to 3 of a conditioning protocol was strongly associated with the eventual adaptation of VO2max.


When do we intervene?

At what point should the coach or trainer implement a training or lifestyle intervention when an athlete is showing warning signs of excess fatigue?

This is easy to determine when looking back on the data retrospectively, but in real-time this can be a challenging question to answer. Especially when performance remains relatively stable during the early stages. There’s a sometimes blurry line between being too soft (changing the plan at every red flag) and being too hard (ignoring too many red flags).

In observing this athletes trend, it appears that the situation could’ve been easily avoided had some type of intervention been made early enough. The trend for HRV, and perceived measures of sleep quality, fatigue, soreness and stress all indicate that this athlete is heading for trouble.

downward trend

With poor sleep and high levels of training/non-training related stress the immune system is compromised and the athlete gets sick.

At what point do we intervene? Intervention starts with a conversation. The conversation acknowledges a red flag and helps determine what means of action to take (if any at all). In this situation, the first uncharacteristically low sleep rating should’ve started the conversation.

Effect of Water Ingestion on HRV: Implications for daily measures

One of the more challenging aspects of implementing HRV monitoring with athletes is ensuring that daily measures are performed reliably. Unreliable or inconsistent measurement procedures can lead to invalid data (false positives or false negatives) and therefore a misinterpretation of training and recovery status. With ultra-short HRV recordings (i.e., ~60 s) it is even more important that measures be strictly standardized to improve the quality of the data.

Waking measures are preferred to capture one’s HRV in a truly rested condition, before any external stimuli can confound the measure. A potential confounding variable that users should be aware of is the effect that water ingestion has on various physiological processes that stimulate autonomic activity and thus alter one’s HRV. This was brought to my attention several years ago by my colleague, Dr. James Heathers.

Immediate changes in HRV take place following water consumption that can last for up to 45 minutes or longer. For example, Routledge and colleagues1 tested the effects of 500 ml water ingestion on HRV in 10 healthy individuals between the ages of 24 and 34 years. On two separate occasions, the subjects reported to the lab in a randomized order for 500 ml water ingestion or 20 ml water ingestion (control). The experiments took place at 8 am before the subjects had anything to eat or drink and after bladder emptying. For a 30 minute period, subjects rested in a semi-supine position before water ingestion. HRV was determined from 5-min ECG windows immediately before and at 5, 20 and 35-min post water ingestion.

Resting HR on average was between 2 – 7 bpm lower than control throughout the post-consumption 45-min period. RMSSD increased between 8 -13 ms during this period compared to control which increased between 2 – 8.8 ms.

Experiment

Out of curiosity I conducted a similar but much smaller experiment (n=1) to see how HRV responded to 500 ml water ingestion. The data is analyzed in 5-min segments before and after drinking in the seated position with a 1-min period excluded from analysis during which the water was ingested. The tachogram and results are posted below.

water tachogram

Tachogram including pre and post water ingestion

pre water consumption

Pre

Post water results

Post

In Martin Buchheit’s, recent review paper, a 3% smallest worthwhile change for lnRMSSD is suggested. In this situation water consumption resulted in an increase in lnRMSSD nearly 2x the smallest worthwhile change.

results table water hrv

*Note that lnRMSSDx20 represents the modified HRV value provided by HRV app’s like ithlete. This has been highlighted for those who are only familiar with these values.

Why does water consumption increase HRV?

The autonomic responses to water ingestion appear to initially be due to the stimulation of osmoreceptors within the gut which causes vasoconstriction (a sympathetic response) and a slight increase in total peripheral resistance.2 Increased baroreceptor sensitivity and increased cardiac-vagal stimulation are thought to occur to counteract the pressor effect (increases in blood pressure) which is why we see a slowdown in resting HR and increase in HRV.2 Effects from the Renin-Angiotensin-Aldosterone system can also not be ruled out given their role in mediating body fluid levels that can effect cardiovascular responses. Water temperature may also have an effect as 250 ml of ice water appears to increase HRV to a greater extent than room-temperature water.3 This may be due to stimulation of thermal vagal receptors in the esophagus.3 Additionally, water ingestion following exercise has been shown to increase parasympathetic reactivation.4

Implications for Daily Monitoring

Tell your athletes to wait until after measuring their HRV to drink fluids and to do so consistently. Otherwise, values may be obscured with a false positive when they drink fluids before the measure.

References:

  1. Routledge, H.C., Chowdhary, S., Coote, J. H., & Townend, J. N. (2002). Cardiac vagal response to water ingestion in normal human subjects. Clinical Science103, 157-162.
  2. Brown, C. M., Barberini, L., Dulloo, A. G., & Montani, J. P. (2005). Cardiovascular responses to water drinking: does osmolality play a role?.American Journal of Physiology-Regulatory, Integrative and Comparative Physiology289(6), R1687-R1692.
  3. Chiang, C. T., Chiu, T. W., Jong, Y. S., Chen, G. Y., & Kuo, C. D. (2010). The effect of ice water ingestion on autonomic modulation in healthy subjects.Clinical Autonomic Research20(6), 375-380.
  4. Oliveira, T. P., Ferreira, R. B., Mattos, R. A., Silva, J. P., & Lima, J. R. P. (2011). Influence of water intake on post-exercise heart rate variability recovery.Journal of Exercise Physiology Online.

3 Month HRV and Wellness trends of two D1 Athletes

Below are the HRV trends of two NCAA D1 athletes from a team we’ve been working with over a 3 month period of virtually the same training schedule.

  • The vertical gray bars represent average perceived wellness (9 point scale)
  • The dotted horizontal black line is daily HRV
  • The thin black horizontal line is the 7-day rolling average
  • The dashed parallel horizontal lines represent the smallest worthwhile change (SWC = 0.5xCV)
  • HRV and wellness was acquired daily by the athletes with the ithlete finger sensor in the seated position.

Interestingly, these two athletes have very similar responses. About 3 weeks into the trend was a very intense training camp that was held out of state before Christmas. One athlete appears to experience more fatigue than the other with nearly the whole week below the SWC and a more pronounced decrease in wellness. HRV and wellness for both athletes improve over Christmas break. Following Christmas there is an intense 2-week training period followed by a reduction in training load. Both athletes frequently fall below the SWC here. Athlete A oscillates up and down while Athlete B remains below the SWC for nearly an entire week along with a decrease in wellness (middle of the trends). Both athletes trend upward after the intense training period and remain steady throughout the last half of the trend.

Athlete A

Athlete B

What makes things interesting is when athletes do not respond as expected. This is when the monitoring becomes invaluable as training intervention becomes extremely important.

HRV and Reaction Test Data and some updates on our HRV research

I posted some data a couple of months ago comparing my HRV to my tap test results to see if there was any correlation between the two. You can see that post here if you missed it. It was around that time that I also started using a Reaction Test app. Today I’ll be posting and reviewing my Reaction Test data with my HRV data to see what it might reveal. At the end of the post I’ll provide some brief updates on what’s been happening since I started working in the Human Performance Lab here at Auburn (Montgomery).

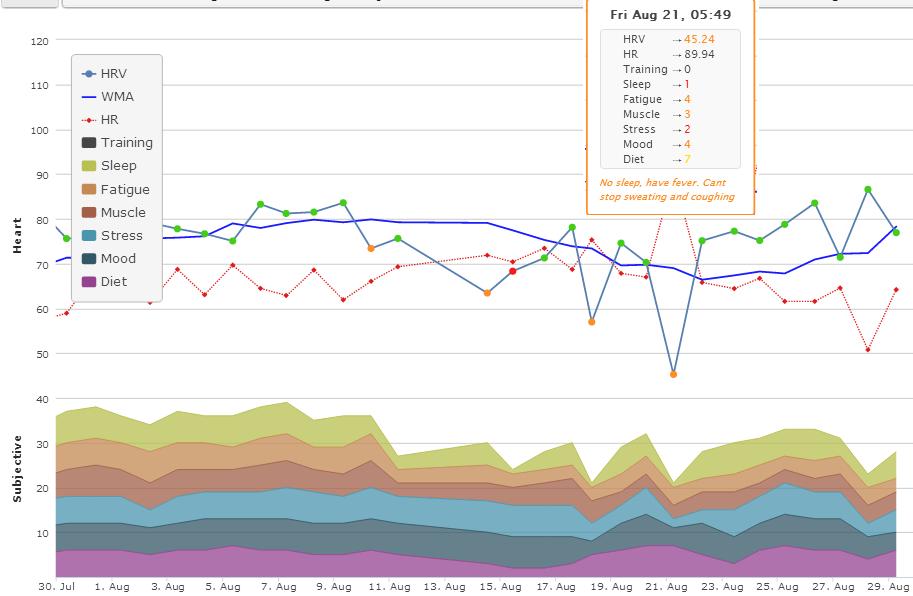
HRV: I continue to use ithlete as my main HRV metric. Daily measurements are performed each morning after waking and bladder emptying. All measurements are performed in the standing position with paced breathing. The HRV value provided by ithlete is Ln RMSSD x 20; a time domain measure of parasympathetic tone.

Reaction Test: The reaction test is performed after my HRV test and my Tap test (I’m still doing these but will not include them today). All reaction tests were performed using right index finger. The app functions as follows;

  1. initiate app
  2. Tap target area to start the test
  3. React to stimuli (color change) as fast as possible by tapping the screen
  4. Repeat for a total of 5 reactions (variable time intervals between)

Image

I used excel to calculate daily average with the reaction test data (plotted on the charts below).

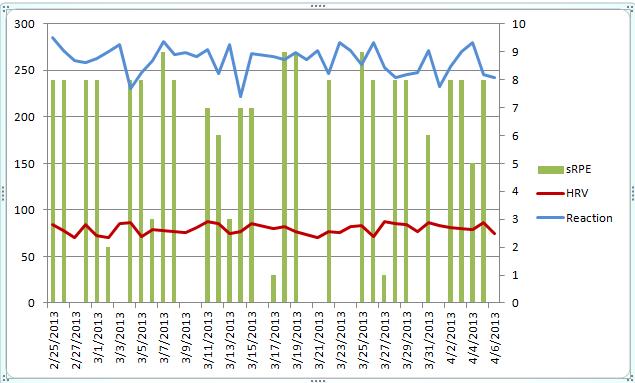
Keep in mind that for a correlation between high HRV and good Reaction Test, we want to see an inverse relationship in the trends. We’re looking for a fast Reaction time (trending down) with a higher HRV score (trending up).

Chart 1 – HRV, Reaction Test Average and Session RPE (secondary axis)  

Image

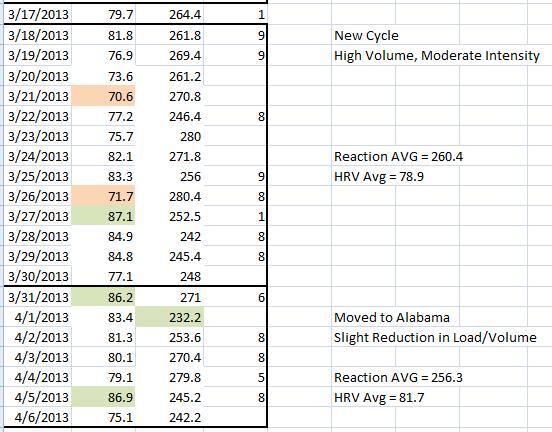
For more clarity I’ve also included excel screen shots of the raw data. I’ve sectioned off 4 different areas and noted the goal/purpose of that particular time of training. It works out so that there is a High Intensity section, a Deload section, a High Volume Section, and a Semi-Deload section. The “Semi-Deload” period occurs over the past week that I’ve moved to Alabama. I figured it would be wise to scale intensity and volume back very slightly while I settle in to a new place and new work environment. To give an example, I essentially removed a main working set and stuck with familiar weights. Assistance work was relatively unchanged.

ImageImage

* I must have forgotten to perform a reaction test or forgot to save it on 03/16 which was a Saturday and therefore it is not included.

I’ve highlighted any score that was +/- 10% from the total average. So for exampme; if HRV was 10% higher than the average of all HRV scores, I would shade that day green. Likewise for Reaction Test. Red shading denotes 10% or greater reduction.

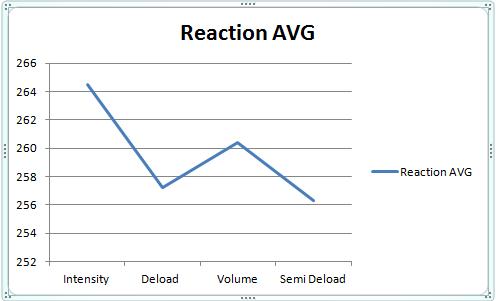
After examining the acute relationship between Reaction Test and HRV I decided to examine the averages for each training block. I’ve shifted my focus lately a little bit more on weekly trend changes vs. daily trend changes. As you can see in the charts below, there is a very strong relationship between HRV AVG and Reaction Test AVG during each training section.

ImageImage

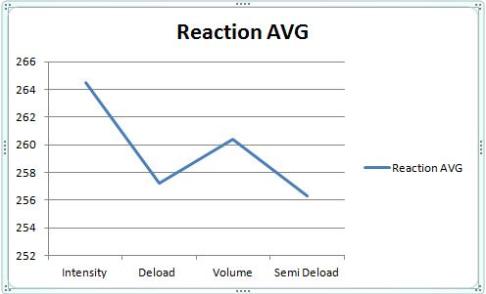
–          Intensity Section – This section was the last 2 weeks of my 9 week training cycle that I performed after the Christmas break (discussed here). Volume was low but intensity was Maximal. HRV is at it’s lowest average while Reaction Test is at its highest (slowest reaction time) average.

–          Deload – During the deload week HRV average rebounds to peak levels while reaction time improves to near peak levels.

–          High Volume – This marks the start of a new training cycle. HRV drops quite a bit and Reaction Time average increases (slower reaction).

–          Semi-Deload – HRV returns to near peak values while Reaction Test peaks (quickest reaction time average).

From this data set, intensity appeared to have the biggest effect on Reaction Test average and HRV average. High volume work with moderate intensity also had a significant impact on these averages. It should be kept in mind that the Intensity period followed several weeks of training and therefore some fatigue had already been accumulated. I didn’t start using the reaction test until late February.  HRV and Reaction averages improve over periods of reduced training load.

Given that I was able to hit some PR’s in the gym during the Intensity section (under high fatigue), I’m inclined to say at this point, based on this data set, that these tests are not necessarily indicators of performance potential (strength), but rather markers of fatigue. In the future I would like to see how these tests match up with “finer” motor skills in other athletes.

Quick Updates

I made it safely to Montgomery, AL after a nice visit with some family at my folks place in Cincinnati over Easter. Total travel time was about 17.5 hours. We wasted no time in getting to work in the lab. We’ve got 3 projects going on right now (the first two being more health related  as opposed to sports/performance).

  1. I’m helping Dr. Esco complete a study comparing post-exercise HRV recovery after two different modes of exercise (cycling vs. treadmill at same intensity/duration).
  2. We are starting a new study comparing post-exercise HRV in middle aged men after 3 modes or resistance training; Eccentric only; Concentric Only; Traditional Resistance Training
  3. We have put the wheels in motion for a cross-validation study comparing ithlete to EKG. We did some pilot work with about 6 subjects so far and have IRB Forms and Consent Forms about ready for submission. We’ll measure ithlete and EKG simultaneously in about 20 males and 20 females then run the data. This is a very important study to me. In order to improve what we know about HRV and performance, we need more data. Using EKG’s in the field is not practical. What we need to start seeing is data from athletes that are performing measurements at home when they wake up. The device needs to be extremely easy to use and the data needs to be immediately available to the coach. At this time, smart phone app’s are the best way to do this. There are plenty of limitations with this but at the end of the day, if we’re going to apply this stuff in a team setting we need easy to use, affordable tools.
  4. This last project doesn’t exist yet. But I’m hoping to collect data on either the men’s tennis team or the women’s soccer team. I’ll provide more info on this if and when it starts to take shape.

Let me be clear right from the start in saying that Dr. Esco is running the show here. I’ve learned a ton from him already about the research process and anything that I accomplish over the next little while will be because of him.

Lastly, I attended my first Roller Derby which was quite the experience.

HRV Data from a High School Sprinter

Here is some more data and analysis from a nationally ranked high school sprinter (Junior) that I have using ithlete. Please note that the sprinter trains primarily with his sprint coach. I work with him roughly 3 days/week on mobility, restoration, etc.  He was an ideal candidate for monitoring HRV as he is an extremely motivated and dedicated athlete and there was no doubt in my mind that he could handle the daily measurements. The data stops in early January because he somehow broke the HRV receiver I gave him. A new one has been ordered recently I’ve been told. This data collection is primarily for observational purposes since I do not control or manipulate his training as mentioned above.

November

ZWNovTable

ZWNovtrend

  •  After 1 week of using ithlete, I had him start using the comments section and sleep score.
  • His resting heart rate was higher than I expected. I had him perform his measurements standing but in hindsight I should’ve had him do them seated based on his RHR.
  • HRV average is mid 70’s which is what I expect from an anaerobic athlete. Still would expect his HR to be at least in the high 60’s in standing position.
  • Clearly he stays up super late on weekends and sleeps in late. Been on his case about this. 

First Half of December

ZWDec1Table

 ZWDec1Trend1

  • HR/HRV average remains consistent. Coping with training well.
  • Race day on 12/7, hit a PB in his part of the relay. Not a hard race, treated as practice.
  • Reports of back soreness that persisted long enough for him to seek treatment (documented in next table).

Christmas Break – Second Half of December & Early January 

ZWXmasTable

ZWXmasTrend

  •  This last section of data is from his Christmas break. Interestingly his HRV average drops and his RHR increases. I attribute this to the change in routine (off of school), staying up late regularly, etc. I also notice changes in my HRV when my routine is interrupted. The body likes consistency.
  • Things appear to be going well though as he seldom gets below baseline scores (amber).
  • Race day on 1/6 and hits a PB on 60m.

Given that this athlete is still young and taking advantage of “newbie” strength gains, I would expect him to hit PB’s relatively consistently on the track. Based on his trend, fatigue was never really an issue. More training may have been well tolerated.

I’d like to get him to start using the training load feature too now to get a better idea of how hard his workouts are (perceptively).