Season-long heart rate variability tracking reveals autonomic imbalance in American college football players

As part of my PhD work at Alabama, we tracked HRV in football players from day 1 of preseason training through to the national championship. A practical summary of some key findings follow the full-text link below.

Fluctuations in HRV are expected throughout a season. However, chronically suppressed values are cause for concern. Sustained parasympathetic hypoactivity is associated with various pathological conditions and is a hallmark of stress and impaired recovery in athletes.

We learned from spring camp that day-to-day HRV recovery was delayed in linemen vs. the smaller and more aerobically fit skill players. Thus, we anticipated that linemen would be more susceptible to attenuated HRV throughout the season.

HRV started to decline by week 6 of the competitive period for linemen. A couple notable events occurred here: 1) the first of 5 consecutive SEC match-ups vs Top 25 nationally-ranked opponents and 2) the week of mid-term exams for many players.

Although significant group-level reductions for linemen weren’t observed until later, key players showed descending HRV by mid-season, in the absence of changes in PlayerLoad. Suppressed HRV preceded illness and injury in 2 starters. Temporary rest restored HRV.

Group-level reductions occurred during an intensive camp-style preparation period for the college football playoffs following the SEC championship. Most players took a hit to their HRV, but linemen were hit the hardest. Note magnitudes of the effect sizes in the table below.

HRV remain suppressed for linemen through prep weeks for the national semi-final and the national championship. Smaller decrements (non-significant) were observed for skill players. In addition to accumulating physical stress, psycho-emotional factors (pre-competitive anxiety, pressure to perform, media attention, etc) likely contributed.

Although we emphasize the toll of a season on linemen, some skill players also showed suppressed values. The table below shows the rate of change in HRV for all players. 25% of skill and 63% of linemen showed sig. descending HRV patterns throughout the season.

Linemen experience hypertension, arterial stiffening, and pathologic LV hypertrophy following 1 or more seasons. These maladaptations are possibly preceded by ANS imbalance. We hypothesize that larger players showing the worst HRV profiles suffer the greatest decrement in cardiovascular health markers.

If so, intervening when a decreasing HRV pattern is observed may not only be relevant to performance (limiting fatigue, injury-, and infection-risk), it may also help mitigate the cardiovascular toll of playing football at such a high level. Seeking funding to explore this in the future.

The findings highlight potential deficiencies in or greater taxation to the coping capacity of linemen vs. smaller players. Factors hypothesized to contribute to more prevalent ANS imbalance in linemen and potential implications for health and performance are summarized below.

Linemen need careful attention and monitoring. We need strategies to prevent ANS imbalance from occurring (load management, aerobic capacity, treatment of health conditions like sleep apnea, etc) and we need restorative methods to implement if it occurs.

Tracking HRV with a mobile app was inexpensive and easy. Time-demand from players was ~3 min/week while waiting to get taped. Though sub-optimal relative to post-waking measures, this approach enabled timely detection of descending patterns, which may be useful for guiding interventions relevant to player health and wellbeing.

Though a better understanding of the health and performance ramifications of suppressed HRV in football players is needed, a descending pattern may serve as an easily identifiable red flag requiring attention from performance and medical staff.

Heart Rate Variability in College Football Players throughout Preseason Camp in the Heat

Here’s a quick look at our latest study examining cardiac-autonomic responses to preseason camp in the heat among college football players. The free full text can be accessed here: Heart rate variability in college football players throughout preseason camp in the heat IJSM

Intensive training periods tend to increase RHR and decrease HRV, reflecting stress and fatigue. However, adaptations to heat exposure (e.g., plasma volume expansion) tend to have the opposite effects. So we wanted to see what happens when players were exposed to both intense training and intense heat stress during preseason camp.

Despite increases in perceived fatigue throughout the 2-week period, RHR and HRV reflected responses consistent with heat acclimation.

HRV initially decreased in linemen, then peaked after a day of rest. Non-linemen faired a little better with smaller decrements in perceived fatigue and more frequent day-to-day improvements in RHR and HRV.

These results indicate that heart rate parameters and perceived fatigue are independent markers of training status, and that desirable cardiovascular adaptations can occur in the presence of soreness and fatigue.

This is especially important for tech companies who try to infer recovery status from HRV alone. As HRV improved throughout camp, an app’s algorithm would report to coaches that players are well-recovered. Given that no player feels well-recovered during preseason camp in the heat, the technology suddenly loses credibility for being wrong and will likely be dismissed.

This is unfortunate because the heart rate parameters are likely reflecting important adaptations that may indicate better tolerance to training in the heat, a reduced exercising heart rate, and improved fitness. Thus, I encourage users to ignore “recovery” scores and interpret the data in appropriate context.

ABSTRACT 

We aimed to characterize cardiac-autonomic responses to a 13-day preseason camp in the heat among an American college football team. Players were categorized as linemen (n=10) and non-linemen (n=18). RHR, natural logarithm of the root-mean square of successive differences multiplied by twenty (LnRMSSD), and subjective wellbeing (LnWellness) were acquired daily. Effect sizes±90% confidence interval showed that for linemen, LnRMSSD decreased (moderate) on day 2 (71.2±10.4) and increased (moderate) on day 12 (87.1±11.2) relative to day 1 (77.9±11.2) while RHR decreased (small–moderate) on days 6, 7, and 12 (67.7±9.3–70.4±5.5 b∙min-1) relative to day 1 (77.1±10.1 b∙min-1). For non-linemen, LnRMSSD increased (small–large) on days 3–5, 7, 12, and 13 (83.4±6.8–87.6±8.5) relative to day 1 (80.0±6.5) while RHR decreased (small–large) on days 3–9, 12, and 13 (62.1±5.2–67.9±8.1 b∙min-1) relative to day 1 (70.8±6.2 b∙min-1). Decrements in LnWellness were observed on days 4–10 and 13 for linemen (moderate) and on days 6–9, 12, and 13 for non-linemen (small–moderate). Despite reductions in LnWellness, cardiac-autonomic parameters demonstrated responses consistent with heat-acclimation, which possibly attenuated fatigue-related decrements.

Daily Heart Rate Variability before and after Concussion in an American College Football Player

Our latest paper is a case report demonstrating substantial changes in HRV following concussion in a college football player. The full text can be accessed here. The main findings were:

1: The post-concussion HRV trend appeared similar to trends commonly associated with training fatigue. Therefore, staff should investigate the possibility of an unreported concussion when similar trends are observed in athletes. 

2. Alterations in HRV persisted well beyond return to play clearance. This may have implications for clinical treatment and return to play considerations.

3. Since HRV demonstrated greater daily fluctuation post-concussion, isolated (i.e., single time-point) HRV recordings are likely inadequate for assessing persisting effects on the autonomic nervous system. Thus, near-daily HRV assessment may be required.

4. The convenient methodology used to monitor HRV (60-second finger-pulse plethysmography on a mobile application) can feasibly be implemented with an entire roster of athletes.

Abstract

This case report demonstrates the effects of sport-related concussion (SRC) on heart rate variability (HRV) in an American college football player. Daily measures of resting, ultra-short natural logarithm of the root mean square of successive differences (LnRMSSD), subjective wellbeing, and Player Load were obtained each training day throughout a 4-week spring camp and 4 weeks of preseason training. SRC occurred within the first 2 weeks of the preseason. During spring camp and preseason pre-SRC, the athlete demonstrated minimal day-to-day fluctuations in LnRMSSD, which increased post-SRC (LnRMSSD coefficient of variation pre-SRC ≤ 3.1%, post-SRC = 5.8%). Moderate decrements in daily-averaged LnRMSSD were observed post-SRC relative to pre-SRC (Effect Size ± 90% Confidence Interval = −1.12 ± 0.80), and the 7-day rolling average fell below the smallest worthwhile change for the remainder of the preseason. LnRMSSD responses to SRC appeared similar to trends associated with stress and training fatigue. Therefore, performance and sports medicine staff should maintain regular communication regarding player injury and fatigue status so that HRV can be interpreted in the appropriate context. Detection and monitoring of autonomic dysregulation post-SRC may require near-daily assessment, as LnRMSSD showed greater daily fluctuations rather than chronic suppression following the head injury.

Image

New Podcast Episode: HRV monitoring in team sports

Thanks to Dr. Marc Bubbs for having me on the show to discuss HRV in team sports. Details and episode links below.

In Season 3, Episode 7 Dr. Bubbs interviews Dr. Andrew Flatt PhD to discuss applications of heart rate variability (HRV) monitoring in team sport athletes. Dr. Flatt reviews the basic physiology of HRV, how pre-season testing can inform your training and recovery plans, how in-season monitoring influences decision making, and new findings on HRV results in larger athletes, such as linemen in American football. Dr. Flatt also discusses how the “other 22-hours” in the day – sleep, long-haul travel, mental and emotional stress, etc. – impact the nervous system and HRV measures, and finally provides some practical tips on how to collect HRV measurements, validated apps, and red flags to avoid when interpreting results.

Summary of This Episode

7:00 – What Is HRV?

7:45 – What impacts HRV scores in athletes

11:00 – Pre-season HRV trends in team sport athletes

13:20 – Olympic vs. national level swimmer HRV values

25:00 – In-season monitoring in collegiate football players

33:00 – Strategies for improving recovery as competitive season progresses

40:00 – Monitoring – a tool to start a conversation

46:30 – Different “apps” to implement with clients

57:00 – Evolution of research in HRV and team sports


https://www.stitcher.com/podcast/dr-bubbs-performance-podcast/e/58826132?autoplay=true

HRV responses to in-season training among D-1 college football players

During spring training camp, we found that Linemen demonstrate the greatest reductions in LnRMSSD at ~20 h post-training, followed by Mid-Skill and Skill, possibly reflecting inadequate cardiovascular recovery between consecutive-day sessions for the larger players, despite lower PlayerLoad values. (Full-text available here)

Our first follow-up study during the early  part of the competitive season found the same position-based trend, where Linemen demonstrated the greatest reductions in LnRMSSD at ~20 h post-training, followed by Mid-Skill and Skill. However, the magnitude of the reductions in LnRMSSD during the in-season were smaller relative to spring camp. We speculate that both reduced PlayerLoad values (15-22% lower than spring camp) and adaptation to intense preseason training in the heat and humidity during the preceding weeks account for the smaller LnRMSSD reductions observed during the early part of the competitive season. (Full-text available here: Cardiac_Autonomic_Responses_to_In_Season_Training_Among_Division1_College_Football_Players)

Cardiac-Autonomic Responses to In-Season Training Among Division-1 College Football Players.

Despite having to endure a rigorous in-season training schedule, research evaluating daily physiological recovery status markers among American football players is limited. The purpose of this study was to determine if recovery of cardiac-autonomic activity to resting values occurs between consecutive-day, in-season training sessions among college football players. Subjects (n = 29) were divided into groups based on position: receivers and defensive backs (SKILL, n = 10); running backs, linebackers and tight-ends (MID-SKILL, n = 11) and linemen (LINEMEN, n = 8). Resting heart rate (RHR) and the natural logarithm of the root-mean square of successive differences multiplied by twenty (LnRMSSD) were acquired at rest in the seated position prior to Tuesday and Wednesday training sessions and repeated over three weeks during the first month of the competitive season. A position × time interaction was observed for LnRMSSD (p = 0.04), but not for RHR (p = 0.33). No differences in LnRMSSD between days was observed for SKILL (Tuesday = 82.8 ± 9.3, Wednesday = 81.9 ± 8.7, p > 0.05). Small reductions in LnRMSSD were observed for MID-SKILL (Tuesday = 79.2 ± 9.4, Wednesday = 76.2 ± 9.5, p < 0.05) and LINEMEN (Tuesday = 79.4 ± 10.5, Wednesday = 74.5 ± 11.5, p < 0.05). The individually averaged changes in LnRMSSD from Tuesday to Wednesday were related to PlayerLoad (r = 0.46, p = 0.02) and body mass (r = -0.39, p = 0.04). Cardiac-parasympathetic activity did not return to resting values for LINEMEN or MID-SKILL prior to the next training session. Larger reductions in LnRMSSD tended to occur in players with greater body mass despite having performed lower workloads, though some individual variability was observed. These findings may have implications for how coaches and support staff address training and recovery interventions for players demonstrating inadequate cardiovascular recovery between sessions.

Figure 1

Our next paper, currently in production, will feature HRV responses among positions throughout the entire preparatory and competitive season.

HRV and Training Load Among NCAA D-1 Football Players Throughout Spring Camp

For our first study with football, we wanted to determine if cardiovascular recovery from training varied among positional groups (i.e., Skill, Mid-Skill and Linemen). We also looked at some longitudinal relationships between cardiac-autonomic and training load parameters throughout spring camp.

We found that Linemen take longer to recover between training sessions than the other positions. This may have important implications for the competitive season because despite differences in recovery time among positional groups, football teams train on a fixed schedule. This may make Linemen more susceptible to developing signs and symptoms of overtraining, getting hurt or sick, etc. Fortunately, we captured data from the competitive season, too. That paper is forthcoming. Full-text link:

The purpose of this study was to determine whether recovery of cardiac-autonomic activity to baseline occurs between consecutive-day training sessions among positional groups of a collegiate football team during Spring camp. A secondary aim was to evaluate relationships between chronic (i.e., 4-week) heart rate variability (HRV) and training load parameters. Baseline HRV (lnRMSSD_BL) was compared with HRV after ∼20 hours of recovery before next-day training (lnRMSSDpost20) among positional groups composed of SKILL (n = 11), MID-SKILL (n = 9), and LINEMEN (n = 5) with a linear mixed model and effect sizes (ES). Pearson and partial correlations were used to quantify relationships between chronic mean and coefficient of variation (CV) of lnRMSSD (lnRMSSD_chronic and lnRMSSDcv, respectively) with the mean and CV of PlayerLoad (PL_chronic and PL_cv, respectively). A position × time interaction was observed for lnRMSSD (p = 0.01). lnRMSSD_BL was higher than lnRMSSDpost20 for LINEMEN (p < 0.01; ES = large), whereas differences for SKILL and MID-SKILL were not statistically different (p > 0.05). Players with greater body mass experienced larger reductions in lnRMSSD (r = -0.62, p < 0.01). Longitudinally, lnRMSSDcv was significantly related to body mass (r = 0.48) and PL_chronic (r = -0.60). After adjusting for body mass, lnRMSSDcv and PL_chronic remained significantly related (r = -0.43). The ∼20-hour recovery time between training sessions on consecutive days may not be adequate for restoration of cardiac-parasympathetic activity to baseline among LINEMEN. Players with a lower chronic training load throughout camp experienced greater fluctuation in lnRMSSD (i.e., lnRMSSDcv) and vice versa. Thus, a capacity for greater chronic workloads may be protective against perturbations in cardiac-autonomic homeostasis among American college football players.
LnRMSSD Spring Camp Football
Full-text on RG Link

Monitoring Training in a High School Football Player

Though I’m currently a solid 17 hour drive away from home, I still correspond with several athletes I formerly worked with prior to my relocation. I’ve got a few athletes sending me their ithlete data every week. I finally had time to sit down and analyze some of it and so today I’ll present and discuss the past four weeks worth of data from a high school football player.

Basic Descriptors

This athlete is currently a high school sophomore and will be the starting Quarterback for his high school Varsity Football Team. In addition to high school football, this athlete is also competing in track and field (Javelin, Shot Put and Triple Jump) and summer football.

Monitoring Variables

HRV: The athlete measures HRV with ithlete in a standing position  every morning after waking and bladder emptying.

Subjective Sleep Score: Following his HRV measurement, sleep was rated (1-5 scale) and comments were entered regarding the previous days events on the ithlete app.

sRPE: I also asked the athlete to provide a rating of perceived exertion score after each training session, practice or competition (1-10 scale) and input this into the ithlete training load feature. This is not multiplied by session duration.

Reaction Test: Lastly, the athlete performed a simple reaction test with this application after ithlete to assess psycho-motor speed.

My rationale for the selected variables is quite simple:

  1. These tools/metrics are simple, inexpensive and non-invasive
  2. The total time required to complete these is between 3-5 minutes each day. Keeping them easy and quick helps with compliance which as you’ll see, was a non-issue for this athlete.
  3. I wanted both objective and subjective markers
  4. The Reaction test often gets talked about but rarely do I see any data. After having some personal success with it I decided to test it out with him.

4 Weeks of Data and Analysis

The following data is from the last 4 weeks where the athletes Track&Field  and Football schedules overlapped, resulting in a significant increase in physical stress. I have no influence on his current training, schedule, etc. and therefore this analysis is entirely retrospective. Furthermore, I always recommend that training and life style remain unchanged when people start using ithlete. After a few months of training we then analyze the data and determine what course of action to take from there. By making training/life style manipulations right from the start it will be hard to determine how effective they may be. With that said, the data is presented below, broken down into each constituent week.

*Note: Click images to enlarge. Reaction test results fall under “Tap” in the tables starting in week 2.
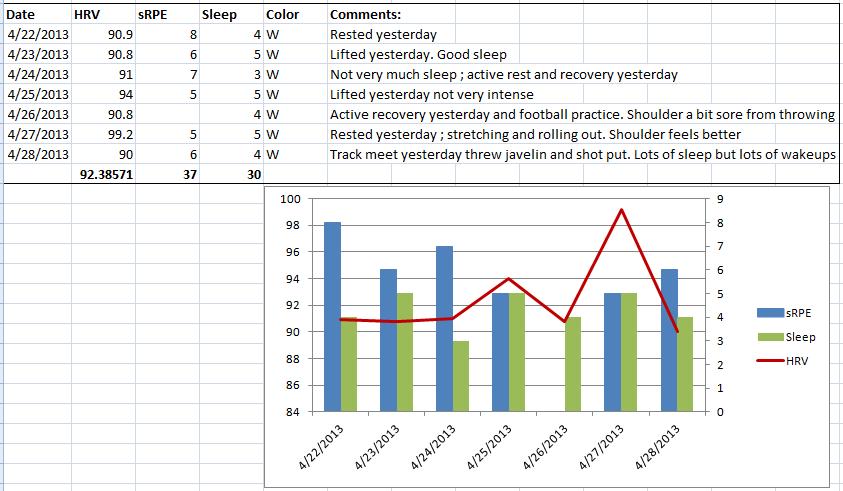
Week 1

Week 1

Week 1:

  •  No Reaction Test data this week, commences in week 2.
  • Training appears to be well tolerated all week with a spike in HRV after a rest day followed by a track meet on Saturday 4/28. The track meet appears to be more stressful than is perceived by the athlete based on the 9 point drop.
  • Training load weekly sum is 31
  • HRV weekly mean is 92.4
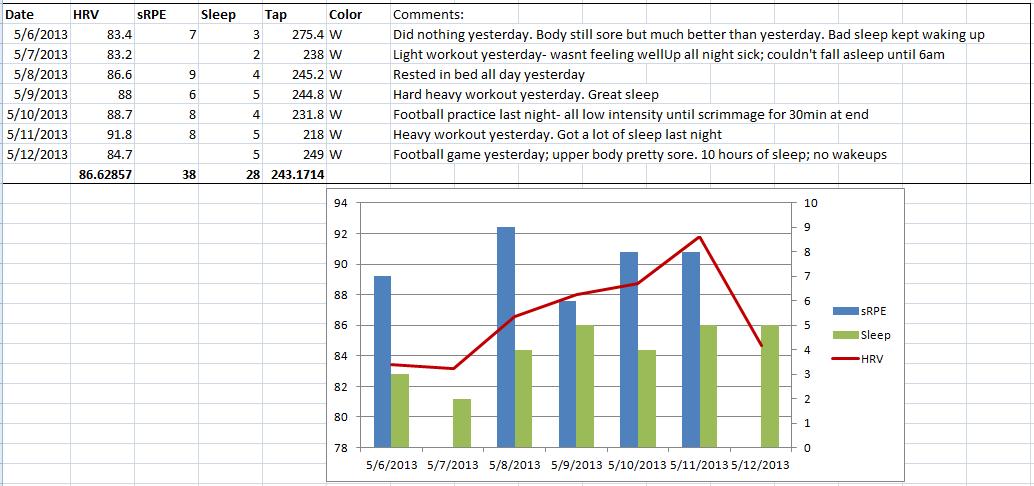
Week 2

Week 2

Week 2:

  • He appears to be insufficiently recovered from the track meet and persists with intense training. HRV remains below 90 all week while the previous week stayed above 90.
  • With some fatigue accumulated he has a track meet on Friday followed by a Football game on Saturday. The trend this week indicates high fatigue compared to the previous week.
  • Training load weekly sum increases by 16%.
  • HRV weekly  mean drops by 8 points; Sleep total drops slightly, First Reaction weekly mean is 262.1
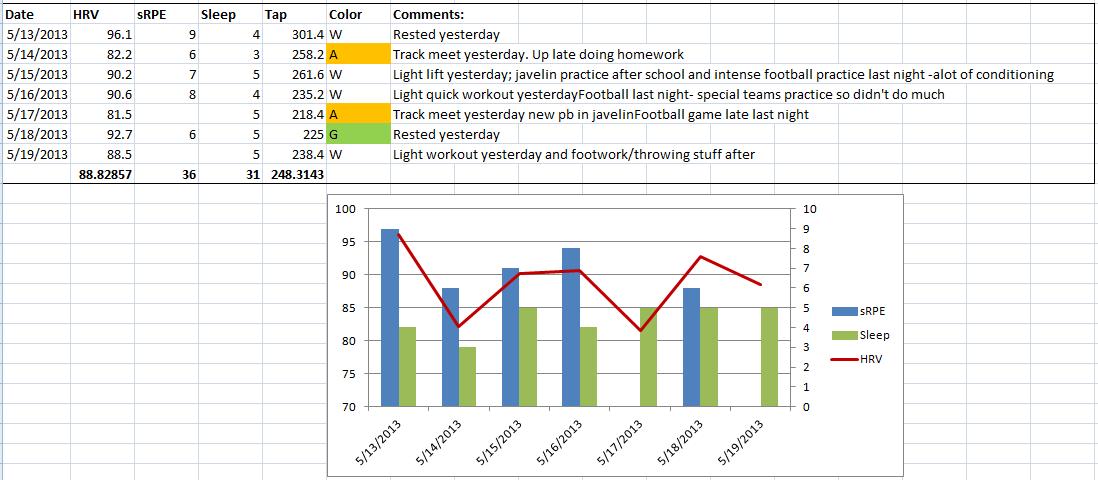
Week 3

Week 3

Week 3:

  • Poor sleep and high soreness is reported early this week after the very stressful previous week. On 5/7 he stays home from school with cold/flu symptoms.
  • He recovers quickly and the rest of the week looks pretty good as his HRV trends back  up over 90.
  • Football game on Saturday causes a decent drop in HRV. Sunday is a rest day.
  • HRV weekly mean improves to 86.6; Training load decreased; Reaction speed decreased (faster).

Week 4

Week 4

Week 4:

  • HRV peaks at 96 after a much needed day off on Sunday
  • 2 Track meets this week with a new personal best throw; perceived training load decreases slightly and HRV started trending up approaching 90.
  • HRV weekly mean increases slightly, Sleep quality increases, Reaction Time is similar to previous week (slight increase).

4 Week Trend

4 Week Trend

Further Analysis 

In the screen shot below, I’ve included a table and chart of the weekly mean of HRV and Reaction Time, as well as the weekly sums of Training Load and Sleep score. In the table to the right I’ve calculated some correlations.

Mean Values, Correlations

Mean Values, Correlations

Brief Thoughts

This data set supports the theory of monitoring not just the daily, but also the weekly trend changes in HRV. However, keeping tabs on the day to day changes, particularly after intense workouts or competition, can allow for more appropriate training load manipulations to try and influence the weekly changes. This is particularly important during a competitive season where overreaching is not desired. Clearly in this case, the athlete experienced some overreaching after the abrupt increase in physical stress evidenced by his illness, disturbed sleep etc. However, the overreaching was short-term and the consequences short-lived as he quickly recovers. When HRV peaks in week 4 we also see an increase in performance (Track PR). Of course the overreaching easily could have been avoided had he not been trying to train for and compete in two different sports at the same time. However, this is the reality of many high school athletes who try and juggle multiple sports in the same season.

Similar to my experience discussed here, his Reaction test essentially mirrored HRV when the weekly means were calculated. Perceived training load clearly had the biggest effect on these two variables. Unfortunately we didn’t incorporate the Reaction Test until week 2 so keep that in mind when looking at the correlation values as week 1 was not included with Reaction Time.

In this case, I do not believe that the RPE of the competitions provided a good reflection of actual competition stress. In many cases when he had a competition, HRV would decline quite a bit yet the RPE would be moderate. Competing adds another element of stress unaccounted for in these situations which should be considered by coaches.

I believe that this athletes short term overreaching and subsequent illness and sleep disturbances could easily have been avoided. Reacting to the decrease in HRV, increase in Reaction time, increased soreness, poor sleep ,etc. by allowing for more recovery time likely would’ve averted this. However, how this would effect his performance in the following weeks when HRV peaks and he see’s an increase in performance is unknown. After several days of a decreasing trend in HRV, rest should be strongly considered, particularly during competition periods.

The comments section of ithlete was valuable in communicating to me brief details about what in particular may be causing stress. This is an undervalued and underrated feature in my opinion.

HRV and Reaction test weekly mean and perceived training load weekly sum each appear to be sensitive markers of the physical stress load experienced by this athlete. Adjusting training loads appropriately in response to these variables may have prevented the unintentional overreaching and illness experienced by this athlete. From this set of data we can conclude that HRV, Reaction test and perceived exertion ratings were effective markers of training status with this athlete.