New Study: Monitoring weekly HRV in futsal players during the preseason

Here’s a quick look at our latest collaboration with Dr. Fabio Nakamura and colleagues, published in J Sport Sci: Sci Med Football. This paper nicely demonstrates the inter-individual variation in HRV responses to training in team sports. An interesting finding was the large negative relationship between the weekly mean of lnRMSSD and the weekly CV of lnRMSSD. Essentially, the athletes with higher HRV tended to show smaller daily fluctuations in HRV and vice versa. This is likely an effect of higher fitness, which we (and others) have touched on in previous studies.
ABSTRACT

This study aimed to compare the weekly natural log of the root-mean-square difference of successive normal inter-beat (RR) intervals (ln RMSSDWeekly) and its coefficient of variation (ln RMSSDCV) in response to 5 weeks of preseason training in professional male futsal players. A secondary aim was to assess the relationship between ln RMSSDWeekly and ln RMSSDCV. The ln RMSSD is a measure of cardiac–vagal activity, and ln RMSSDCV represents the perturbations of cardiac autonomic homeostasis, which may be useful for assessing how athletes are coping with training. Ten futsal players had their resting ln RMSSD recorded prior to the first daily training session on four out of approximately five regular training days·week−1. Session rating of perceived exertion (sRPE) was quantified for all training sessions. Despite weekly sRPE varying between 3455 ± 300 and 5243 ± 463 arbitrary units (a.u.), the group changes in ln RMSSDWeekly were rated as unclear (using magnitude-based inference), although large inter-individual variability in ln RMSSD responses was observed. The ln RMSSDCV in weeks 4 and 5 were likely lower than the previous weeks. A large and significant negative correlation (r = −0.53; CI 90%: −0.36; −0.67) was found between ln RMSSD and ln RMSSDCV. Therefore, monitoring individual ln RMSSD responses is suggested since large inter-individual variations may exist in response to futsal training. In addition, higher values of ln RMSSD are associated with lower oscillations of cardiac autonomic activity.

HRV futsal Fig 1

Full Text on Research Gate

Reviewing Survey Monkey as a free tool for Daily Wellness Questionnaires

Working with athletes in a team setting versus one on one or in small groups limits our ability to engage in small talk with each athlete before training or during warm-up. Being able to ask the athlete how they’re feeling, how they slept, how sore they are, what they’ve been eating, etc., provides insight as to the general state of the athlete and may be used to guide training on that particular day. Small modifications based on insight garnered from these conversations can help you determine if you’ll be pushing it a little harder or reducing the volume a little. Essentially, this is the simplest form of monitoring and managing training. However, it’s difficult to have 20 of these conversations before a workout with an entire team.

A popular method for acquiring this information without having to have individual conversations is to have your athletes respond to a “Wellness” questionnaire that surveys the athletes on their perceived quality of sleep, stress levels, soreness, etc. A brand new study from the JSCR by Gastin et al (2013), demonstrate the effectiveness of daily Wellness questionnaires (among many others). A team of Australian Football players were surveyed daily throughout their season with a brief questionnaire asking the athletes to rate levels of sleep quality, soreness, muscular strain, stress and so forth. Results showed that subjective ratings of physical and psychological wellness responded to weekly training adjustments. Scores reflected improved wellness (less strain, better sleep, etc) throughout the week allowing for optimal states for competition followed by significant decreases in overall wellness following competition. Scores also showed improvement during periods of unloading. Perhaps most interestingly, questionnaire scores discriminated individual differences for muscle strain following a competition as players with higher maximum speed reported higher levels of muscle strain. Evidently, simple daily questionnaires can prove to be quite insightful and useful for monitoring athletes.

If you’re part of a well funded program, you can purchase fancy software that will allow for easy data collection, interpretation and visualization of the data. Unfortunately this is not a luxury that most coaches have, particularly those involved in youth and amateur sports. In discussing this topic with Carl Valle a while back, he suggested Survey Monkey as a simple and free tool for collecting this data. So I created an account and have been testing it out over the last little while. Below are screen shots of its features, and some brief descriptions of how it works, pros, cons, etc.

Below is a screen shot of the survey I’ve been using. Thanks to Mladen Jovanovic, John Fitzpatrick, Aiden Oakley, Rhys Morris and Josh Dixon for their insights earlier this summer on survey options and collection methods. To my knowledge, this survey was created by Martin Buchheit.

wellness questionnaire

Creating a free account with Survey Monkey simply requires the user to provide an email address and create a password. However, the free account has restrictions (discussed later) but can be unlocked with upgrading and paying for premium accounts.

Admittedly, I am not the most tech savvy guy, so the number one thing I was hoping for was that it would be user friendly and intuitive… and it was.

Below is the screen for creating a new survey. Once you’ve created a survey you can re-create it easily with “Copy an existing survey”.

SM1

Creating survey questions:SM2

Once you’ve created your survey:SM3

Sending options for your survey:SM4

Add e-mail addresses of your athletes for email collection:SM5

Personalize the email (Default Shown):SM6

Schedule your survey delivery:SM7

Analyze results as a group:SM8

Or analyze results by individual:SM9

And the feature you’re likely wondering about… SM10

Sorry folks, need to upgrade your account to export data. They need to make money somehow, right?

A screenshot of what the athlete see’s in their email on their smart phone (this can be customized):

photo 1

A view of the actual survey after following the link from the email on Smart Phone:

photo 2

Pros:

  • Easy to create and send surveys
  • Nice visualization of the data
  • Can assess results as a team or individual with several options of how you want the data presented
  • Can schedule when the survey is to be delivered
  • All of these features are free
  • This can also be used to collect sRPE info by scheduling the survey to be sent at the appropriate time, provided you know session duration or total reps.

RPE

Cons:

  • As far as I’m aware, you must re-create the survey and schedule to send it every day. This takes about 2 minutes. If any of you are Survey Monkey experts and know how to automatically re-send the same survey with a new collector please tell me.
  • Data can be exported easily to excel but you must pay to upgrade your account for this feature
  • A numeric value is not assigned to a given rating e.g., 1-5 points. This must be done manually in excel so that you can create daily totals (out of 25 possible points). See Mladen’s free spreadsheet for more on this here

Hopefully this was helpful.

HRV and Training Cycle Review of Powerlifter with CP

I’ve been continuing to work with Zarius out of our lab here at AUM. I provided a detailed account of his  recent powerlifting meet prep and competition data in this post. Zarius is 22 years old, weighs 120lbs and has Cerebral Palsy. Due to travel/work schedules we have had a hard time completing a solid training cycle since his last competition earlier this summer. We were finally able to get a good 1 month of training in before one of us had to travel again. Here is an overview of the training and HRV data from our most recent training cycle.

The Plan:

Our schedules allow for 3 training days per week. We train full body every Mon-Wed-Fri. Zarius is able to do some lower body exercises and we always finish each session with some walking laps around the track. (As an aside, prior to getting involved with the Human Performance Lab here at AUM about a year ago, Zarius’ main mode of transportation was his wheel chair. Now he walks most of the time. A testament to the great work done by Dr. Esco and the staff here at AUM as well as the effort put forth by Zarius.) Since we’re not currently preparing for a meet, we only performed the competition press once per week and performed incline and narrow-grip press on the other two training days as his main movements. I also started recording RPE for each set of his main lifts. There is definitely a learning curve to using RPE so I take the earlier values with a grain of salt. Volume for the main lifts remained constant while intensity increased each week. For his assistance work we just did some basic progressive overload. Since we wouldn’t be training for at least a week after the training cycle I wanted to overreach him a little. Zarius recorded his HRV each morning after waking with ithlete in a seated position.

The Data and Analysis:

Z_Data_07_2013

* Training Load (TL) above is simply referring to the average intensity (%1RM) that we used for his main lifts that week. 7.4=74% , etc. For his future cycles, I’ll be collecting sRPE as he gets more comfortable with the rating system.

Week 1:

–          Lowest intensity week

–          Avg. RPE for main lift this week was 8.4

–          Previous week mean HRV was 85.2 to serve as a baseline, though not on chart. Near +2 increase (86.9) in HRV after week 1.

Week 2:

–          Intensity increases

–          Avg. RPE for main lifts this week increases slightly to 8.6

–          +1 increase in week mean HRV. Training is well tolerated and apparently not very stressful.

Week 3:

–          Highest intensity week

–          Avg. RPE for main lifts this week increases to 9.1. This week he had four RPE@10 compared to week 2 which had 1 RPE@10 and 0 in week 1. (RPE@10 means it was a maximal set, no further reps could be performed)

–          As expected and consistent with his previous meet prep cycle, HRV declines this week -2.3 to 85.7. You’ll note that on weekends his HRV tends to climb back up, indicating good recovery even though the week was quite physically stressful.

Week 4:

–          Low intensity lift on Monday

–          Bench 1RM Test with competition rules (pause and rack command) on Wednesday. Zarius pressed 260lbs cleanly (at 120lbs bodyweight) which is a 10lb Gym personal record and is 5lbs over his competition best of 255lbs.

–          – 3.5 change in HRV this week down to 82.2. This is consistent with his competition cycle where HRV reached lowest values the week of competition. However, we deloaded after week 3 of his competition prep which allowed HRV to recover and peak going in to competition. In this case, due to time constraints, we tested before the deload. It’s possible he may have been stronger with a proper deload before testing.

Week 5:

–          No training this week due to travel

–          HRV week mean returns to baseline at 84.9 (the week before the start of the cycle with no training had a week mean HRV of 85.2).

Overall, this was a successful training cycle based on the result of his 1RM test. Training to at or very near failure with high intensity appeared to have a large effect on his HRV during training evidenced by the downward trend starting in week 3. Though volume was reduced considerably, the 1RM test day appeared to be very taxing as it  had the biggest effect on his HRV (consistent with his previous competition). During week 5 where there were no training sessions, HRV returned to baseline values.

Here is a little video interview that the local media did on Zarius. Take a second and check it out. http://www.montgomeryadvertiser.com/apps/pbcs.dll/article?AID=2013130726027

HRV and Training Density

I’m about to start week 3 of a new training cycle. In reviewing my HRV trend from the past two weeks you’ll see a massive change from week 1 to week 2. Clearly, last week was significantly more stressful than week 1. This was unintentional. I decided to do some calculations to see what may have happened.

1 Month Trend

1 Month Trend

The goal of this phase is to progressively accumulate volume with moderate loads over a 3 week period with a slight reduction in week 4. However, I am very undisciplined in these phases and always go heavier than I should, too soon. I vary set/rep ranges each week but try and stick to lower RPE’s. I like to really focus on technique development during these phases since the loads are supposed to be lighter.

Here is what the two weeks looked like for my main working sets (assistance work not included as it was very similar):

Week # of Lifts Total Volume Avg. RPE
1 70 43300 7-8
2 56 43200 8-9

Total volume was pretty much unchanged but should’ve increased slightly. RPE generally went up to 9’s on my last set in each workout of week 2 (straight sets) but should’ve remained at 8 or below (no chance I was taking weight off the bar though -my meathead-self trumps my logical-self in the gym quite often). Number of lifts decreased by 20% yet volume was matched due to a relative increase in intensity; too much, too soon. If my goal was to increase training density, than I would’ve been quite successful.

I selected weight ranges in week 2 that should’ve been at the appropriate RPE based on estimations. However, for whatever reason, starting on Monday the weight didn’t feel as light as it should have. Rather than lower the load like I should have, I simply performed less sets.

Regarding HRV, I do expect to see some progressive decline as volume increases,  but not a -8 weekly change. Though I can’t think of anything major outside of training that could’ve contributed to the significant change in the trend, non-training related stressors are always a factor, whether we perceive them to be or not.

In conclusion I failed to accomplish my goal of progressively increasing volume with moderate loads but rather increased training density purely as a result of undisciplined load selection. HRV responded with a significant decrease in the trend and I am now starting week 3 in the hole. Lesson learned.

Monitoring Training in a High School Football Player

Though I’m currently a solid 17 hour drive away from home, I still correspond with several athletes I formerly worked with prior to my relocation. I’ve got a few athletes sending me their ithlete data every week. I finally had time to sit down and analyze some of it and so today I’ll present and discuss the past four weeks worth of data from a high school football player.

Basic Descriptors

This athlete is currently a high school sophomore and will be the starting Quarterback for his high school Varsity Football Team. In addition to high school football, this athlete is also competing in track and field (Javelin, Shot Put and Triple Jump) and summer football.

Monitoring Variables

HRV: The athlete measures HRV with ithlete in a standing position  every morning after waking and bladder emptying.

Subjective Sleep Score: Following his HRV measurement, sleep was rated (1-5 scale) and comments were entered regarding the previous days events on the ithlete app.

sRPE: I also asked the athlete to provide a rating of perceived exertion score after each training session, practice or competition (1-10 scale) and input this into the ithlete training load feature. This is not multiplied by session duration.

Reaction Test: Lastly, the athlete performed a simple reaction test with this application after ithlete to assess psycho-motor speed.

My rationale for the selected variables is quite simple:

  1. These tools/metrics are simple, inexpensive and non-invasive
  2. The total time required to complete these is between 3-5 minutes each day. Keeping them easy and quick helps with compliance which as you’ll see, was a non-issue for this athlete.
  3. I wanted both objective and subjective markers
  4. The Reaction test often gets talked about but rarely do I see any data. After having some personal success with it I decided to test it out with him.

4 Weeks of Data and Analysis

The following data is from the last 4 weeks where the athletes Track&Field  and Football schedules overlapped, resulting in a significant increase in physical stress. I have no influence on his current training, schedule, etc. and therefore this analysis is entirely retrospective. Furthermore, I always recommend that training and life style remain unchanged when people start using ithlete. After a few months of training we then analyze the data and determine what course of action to take from there. By making training/life style manipulations right from the start it will be hard to determine how effective they may be. With that said, the data is presented below, broken down into each constituent week.

*Note: Click images to enlarge. Reaction test results fall under “Tap” in the tables starting in week 2.

Week 1

Week 1

Week 1:

  •  No Reaction Test data this week, commences in week 2.
  • Training appears to be well tolerated all week with a spike in HRV after a rest day followed by a track meet on Saturday 4/28. The track meet appears to be more stressful than is perceived by the athlete based on the 9 point drop.
  • Training load weekly sum is 31
  • HRV weekly mean is 92.4
Week 2

Week 2

Week 2:

  • He appears to be insufficiently recovered from the track meet and persists with intense training. HRV remains below 90 all week while the previous week stayed above 90.
  • With some fatigue accumulated he has a track meet on Friday followed by a Football game on Saturday. The trend this week indicates high fatigue compared to the previous week.
  • Training load weekly sum increases by 16%.
  • HRV weekly  mean drops by 8 points; Sleep total drops slightly, First Reaction weekly mean is 262.1
Week 3

Week 3

Week 3:

  • Poor sleep and high soreness is reported early this week after the very stressful previous week. On 5/7 he stays home from school with cold/flu symptoms.
  • He recovers quickly and the rest of the week looks pretty good as his HRV trends back  up over 90.
  • Football game on Saturday causes a decent drop in HRV. Sunday is a rest day.
  • HRV weekly mean improves to 86.6; Training load decreased; Reaction speed decreased (faster).
Week 4

Week 4

Week 4:

  • HRV peaks at 96 after a much needed day off on Sunday
  • 2 Track meets this week with a new personal best throw; perceived training load decreases slightly and HRV started trending up approaching 90.
  • HRV weekly mean increases slightly, Sleep quality increases, Reaction Time is similar to previous week (slight increase).
4 Week Trend

4 Week Trend

Further Analysis 

In the screen shot below, I’ve included a table and chart of the weekly mean of HRV and Reaction Time, as well as the weekly sums of Training Load and Sleep score. In the table to the right I’ve calculated some correlations.

Mean Values, Correlations

Mean Values, Correlations

Brief Thoughts

This data set supports the theory of monitoring not just the daily, but also the weekly trend changes in HRV. However, keeping tabs on the day to day changes, particularly after intense workouts or competition, can allow for more appropriate training load manipulations to try and influence the weekly changes. This is particularly important during a competitive season where overreaching is not desired. Clearly in this case, the athlete experienced some overreaching after the abrupt increase in physical stress evidenced by his illness, disturbed sleep etc. However, the overreaching was short-term and the consequences short-lived as he quickly recovers. When HRV peaks in week 4 we also see an increase in performance (Track PR). Of course the overreaching easily could have been avoided had he not been trying to train for and compete in two different sports at the same time. However, this is the reality of many high school athletes who try and juggle multiple sports in the same season.

Similar to my experience discussed here, his Reaction test essentially mirrored HRV when the weekly means were calculated. Perceived training load clearly had the biggest effect on these two variables. Unfortunately we didn’t incorporate the Reaction Test until week 2 so keep that in mind when looking at the correlation values as week 1 was not included with Reaction Time.

In this case, I do not believe that the RPE of the competitions provided a good reflection of actual competition stress. In many cases when he had a competition, HRV would decline quite a bit yet the RPE would be moderate. Competing adds another element of stress unaccounted for in these situations which should be considered by coaches.

I believe that this athletes short term overreaching and subsequent illness and sleep disturbances could easily have been avoided. Reacting to the decrease in HRV, increase in Reaction time, increased soreness, poor sleep ,etc. by allowing for more recovery time likely would’ve averted this. However, how this would effect his performance in the following weeks when HRV peaks and he see’s an increase in performance is unknown. After several days of a decreasing trend in HRV, rest should be strongly considered, particularly during competition periods.

The comments section of ithlete was valuable in communicating to me brief details about what in particular may be causing stress. This is an undervalued and underrated feature in my opinion.

HRV and Reaction test weekly mean and perceived training load weekly sum each appear to be sensitive markers of the physical stress load experienced by this athlete. Adjusting training loads appropriately in response to these variables may have prevented the unintentional overreaching and illness experienced by this athlete. From this set of data we can conclude that HRV, Reaction test and perceived exertion ratings were effective markers of training status with this athlete.

4 Months of HRV, sRPE, Tap Test and Sleep score: Charts, Tables and Analysis

Since about mid-September of 2012 I started using a CNS Tap Test to see if it provided any indication of training fatigue or if it correlated with my HRV. In addition to tracking my tap test and HRV, I’ve also documented  sRPE and sleep score.

Descriptions

Tap Test – On the tap test app,  perform as many taps as possible in 10 seconds with right index finger and left index finger. I charted these values both separately as Right and Left as well as there total (sum). Tap test was performed immediately following morning HRV test.

HRV – Standard ithlete HRV measurement performed immediately after waking and bladder emptying. The measurements were all performed in the standing position. The ithlete uses the following formula for the HRV value:  20 x Ln (RMSSD). RMSSD is a time domain measure that reflects parasympathetic tone and has been shown to correlate reliably with the high frequency component of frequency domain measures (Sinnreich et al. 1998).

sRPE – Following a workout session I would rate perceived exertion on a scale of 1-10. Generally, active recovery/aerboic work would fall between 1-5 while resistance sessions fell between 6-10.

Sleep Score – I used the ithlete sleep rating score to track sleep quality. On a scale of 1-5 I would rate sleep quality after HRV measurement. Generally, an uninterrupted 7-8 hour sleep was rated as 5. One disturbance/wake was given a 4, etc.

Not Discussed – Today I will not be including discussion on strength performance in relation to HRV or Tap test as I did not really keep track of this. However, in the future I will do this once I determine the best way to quantify this.

Below are the charts with brief comments regarding training/stress for that month.

OCTOBER

Oct_data

– High stress and lack of training in early October due to work related trip over 3-4 days.

NOVEMBER

Nov_data

– Most consistent training month, most sessions completed, most stable HRV, highest HRV Avg, highest Tap Test Avg, highest sleep score. (more on averages and sleep at the end)

DECEMBER

Dec_data

– Highest strength demonstrated in this month out of the 4. Training interruption over the Christmas holiday.

JANUARY

Jan_data

– HRV effected by NYE party but Tap Test appears unaffected (alcohol, late night, etc.). Detrained slightly from lack of training of holidays. Training resumes, transitioning to lifting 4 days/week. Lowest HRV avg, lowest tap sum avg, fewest aerobic sessions.

Comparison of HRV, Sleep, and Tap Test Averages 

Avg_data1

data table avg

– HRV and Tap Test both peak during November which also has the highest average sleep rating. However from the table above you can see that these are by very small percentages.

– In the table and chart below you can see that peak HRV and peak Tap average also occur during the month of most consistent training, most aerobic sessions and most overall training sessions.

– HRV, Tap Test Left, Right and Sum all reach lowest averages in January. January also has the fewest aerobic sessions and comes after a period of detraining (discussed in depth here) in late December.

Comparison of HRV, # of Aerobic Sessions, # of Resistance Sessions & Sum of all sessions

lift_vs_hrv

lift_vs_hrv_table

Main Findings

Highest HRV avg, highest sleep avg, highest tap sum avg, highest left tap avg all occur in November. This corresponds with most total and most aerobic training sessions.

Conversely, lowest HRV avg, lowest tap left, right and sum average occur during January which also corresponds with fewest aerobic sessions but not with lowest sleep avg.

As you can clearly see, there is very little variation in month to month values  and therefore no significant or meaningful conclusions can really be made. However, my HRV data does fall inline with the overwhelming amount of research that shows HRV increases in response to aerobic exercise.

In a future experiment I will track performance ratings in addition to all of the other variables to see if there is any correlation. I will also plan some overload training to see how these markers respond. My training was relatively static during these 4 months.

Correlation between HRV, sRPE and subjective fatigue in athletes

Today I will review the research I’ve read that investigates the relationship between perceived exertion ratings of a workout session (sRPE), subjective levels of fatigue and HRV in effort to examine the usefulness of HRV in reflecting training load in athletic populations. Like all of my articles, this report is based on my interpretation of the research and perspectives from personal experience.

The Research

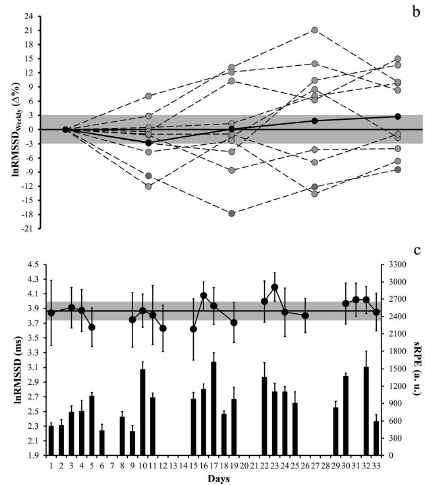
In a brand new study from the JSCR, Sartor and colleagues (2013) followed elite male gymnasts (n=6, age 16) over 10 weeks of training. HRV was monitored daily every other week while sRPE was collected immediately following each workout. HRV strongly correlated to previous day sRPE in both supine (HF%, HF%/LF%) and supine to seated measurements (mean RR, mean HR, HF%, SD1). Relationships were also seen between HRV, and perceived wellness (foster’s index). HRV correlated with training load (sRPE) and psychophysiological status.

Though sRPE wasn’t used in this next study, KeTien (2012) monitored HRV, blood-urine nitrogen (BUN) and profile of mood states (POMS) in 24 national level rugby players over an 8 week conditioning program. The program progressed from more aerobic based work to more anaerobic/interval based work. Spectral measures of HRV correlated with both POMS and BUN at each time point throughout the training period.

During the 2006 World Cup, Parrado and colleagues (2010) set out to determine if perceived tiredness could predict cardiac autonomic response to overload in elite field hockey players (n=8).  A strong correlation was found between per­ceived tiredness scores and HRV. Higher levels of perceived tiredness (acquired from questionnaire) were related to lower values of parasympathetic tone (RMSSD), pNN50 and higher LF/HF ratio. In order to discern changes in HRV brought on by fatigue from changes in HRV caused by pre-competitive anxiety, the researchers had the athletes complete anxiety questionnaires.

“Results show that cognitive anxiety and self-confidence sub­scales of the CSAI–2 were not related to perceived tiredness nor to heart rate variability. In the absence of a relation between cognitive anxiety and heart rate variability, it can be assumed that the relationship established between heart rate variability indexes and perceived tiredness scores are attributable to the fatigue state.”

Accounting for pre-game anxiety is very important as previous research has shown this to affect HRV (Edmonds et al. 2012, Mateo et al. 2012, Murray et al. 2008), thus making it difficult to distinguish fatigue from acute anxiety on the morning of a competition.

Edmonds et al. (2012) found that HRV (HF) correlated with sRPE in youth rugby players (n=9) during a one week microcycle of practices and a game. However, game day HRV values were lower which was attributed to the aforementioned pre-game anxiety since training loads were reduced before the competition.

Smith and Hopkins (2011) monitored performance, HRV, sRPE and subjective fatigue in elite rowers (n=10) throughout an intense 4 week training period. Interestingly, the most improved athlete and the only overtrained athlete both had statistically similar levels of perceived fatigue and changes in LF/HF ratio. However, after looking closely at the data, RMSSD showed a noticeable decline in the OT athlete compared to the most improved who had a moderate increase in RMSSD. The determining factor however in this case was performance changes.

Thiel at al. (2012) found that in 3 elite male tennis players, HRV, serum urea and psycho-physical state (assessed by EBF-52 questionnaire) each responded to overload training. As training load increased, HRV (RMSSD) decreased, perceived fatigue increased and serum urea increased. However, performance increased (V02 max, Single Leg CMJ, DJ index) and therefore performance metrics should always be considered when trying to discern functional overreaching (FOR) from non-functional overreaching (NFOR). HRV changes act as an early warning sign while performance decrements may represent the initial transition from FOR to NFOR.

Cipryan et al (2007) found that HRV correlated to performance in hockey players (age 17, n=4) but did not correlate to self-reported health status. Therefore, coaches should use caution when using perceived stress to predict ANS status and thus an objective measure (like HRV) is still recommended.

In elite female wrestlers, perceived stress (in the form of; excessive competition schedule, social, education, occupational, economical, travel, nutritional, etc) contributed to NFOR when HRV parameters were significantly increased (Tian et al. 2012). There was no mention of perceived stress/recovery in the NFOR group with significant decreases in HRV parameters. Regardless, subjective measures of stress including non-training related events require consideration when planning training. Monitoring the global stress of an athlete is more meaningful then simply training load.

Plews et al. (2012) monitored HRV and perceived measures of recovery (sleep, soreness, etc.) in two elite triathletes over a 77 day period leading up to competition. One athlete was considered NFOR. Perceived levels of recovery were not associated with HRV. However, the NFOR athlete admitted that she felt deterred from  reporting  low scores as anything below a certain score would be automatically sent to the coach. Therefore, when relying on perceptual measures from athletes, coaches must be prudent in ensuring honest reports. HRV was a better indicator of fatigue in this study.

The last study I’d like to mention only appears to be available in German at the moment. I translated the paper with google, however it was very rough to say the least. Therefore I will simply quote the pertinent information from the abstract:

“6 endurance athletes measured morning heart rate, heart rate variability (HRV) and mood state during a normal training period, a 17 day ultrarace (Deutschlandlauf) and following a recovery period. 4 out of 6 runners could not finish the race due to injury or exhaustion. 3 of them showed diagnostically relevant criteria of overreaching. All runners who quit the race showed increased morning heart rate, decreased HRV and a decreased mood state during competition. The studied parameters showed individually different adaptations but there were early changes that preceded the abortion of the run that gave diagnostically relevant information.” (Bossmann 2012)

Thoughts

Though there appears to be a strong tendency for HRV to reflect perceived training load and subjective fatigue, an objective measure of ANS status should still be considered. Subjective measures from athletes are only meaningful if honestly reported.

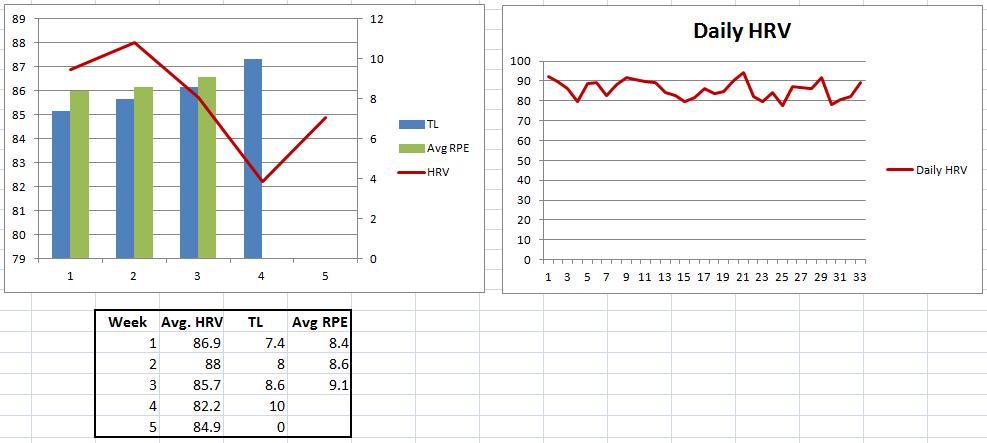
I’ve personally seen a strong correlation between morning HRV score and session rating of perceived exertion (sRPE) of the previous day’s workout. However, I’ve learned that this relationship isn’t perfect. I’ve experienced situations where;

–          Perceived exertion may be high but HRV response may be minimal if the workout is familiar (exercise selection, order, intensity, etc.).

–          In direct contrast to the above, perceived exertion may be moderate but HRV response may be significant if the workout is unfamiliar.

–          Non-training related factors affect HRV. Sleep, aerobic fitness, mental stress, nutrition, etc. can all impact ANS activity, possibly obscuring the relationship between training load and HRV.

–          Stress from travel, illness, occupation, etc. may have a larger impact on ANS than is perceived and reported.

–          More on other factors effecting HRV here.

In conclusion, obtaining both objective and subjective measures of fatigue along with performance indicators will provide a more accurate indication of training status. Monitoring of these variables regularly should enable the coach to better manipulate training loads to ensure progression and avoid unintentional overreaching.

References

Bossman, T. (2012) Effects of ultra-long-distance running on selected physiological and psychological parameters as a possible marker of overloading. Swiss Journal of Sports Medicine, 60(1): 21-5. Full Text

Cipryan, L., Stejskal, P., Bartakova, O., Botek, M., Cipryanova, H., Jakubec, A., Petr, M., & Řehova, I. (2007)  Autonomic nervous system observation through the use of spectral analysis of heart rate variability in ice hockey players.  Acta Universitatis Palackianae Olomucensis. Gymnica, 37(4): 17-21. Free Full-Text

Edmonds, RC., Sinclair, WH., and Leicht, AS. (2012) The effect of weekly training and a game on heart rate variability in elite youth Rugby League players. Proceedings of the 5th Exercise & Sports Science Australia Conference and 7th Sports Dietitians Australia Update. Research to Practice  Abstract

Ke-Tien, Y.(2012) Effects of Cardiovascular Endurance Training Periodization on Aerobic performance and Stress Modulation in Rugby Athletes. Life Science Journal, 9(2): 1218-25. Full-Text

Mateo, M. et al. (2012) Heart rate variability and pre-competitive anxiety in BMX discipline. European Journal of Applied Physiology, 112(1): 113-23.

Murray, N. P. et al. (2008) Heart rate variability as an indicator of pre-competitive arousal. International Journal of Sport Psychology, 39: 346-355.

Plews, DJ., Laursen, PB., Kilding & Buchheit, M. (2012) Heart rate variability in elite triathletes, is variation in variability the key to effective training? A case comparison. European Journal of Applied Physiology, 112(11): 3729-41.

Parrado, E.  et al. (2010)Perceived tiredness and HRV in relation to overload during a field hockey world cup. Perceptual and Motor Skills, 110(3): 699-713 Abstract

Sartor, F. et al. (2013) Heart rate variability reflects training load and psychophysiological status in young elite gymnasts. Journal of Strength & Conditioning Research, Published ahead of print.

Smith, T.B., & Hopkins, WG. (2011) Heart rate variability and psychological stress in an elite female rower who developed over-training syndrome. New Zealand Journal of Sports Medicine, 38(1): 18-20.

Thiel, C. et al. (2012) Functional overreaching in preparation training of elite tennis professionals. Journal of Human Kinetics, DOI: 10.2478/v10078-011-0025-x

Tian, Y., He, ZH., Zhao, JX., Tao, DL., Xu, KY., Earnest, CP. & McNaughton, LR. (2012) Heart rate variability threshold values for early-warning non-functional overreaching in elite women wrestlers. Journal of Strength & Conditioning Research, Published ahead of print


Recent HRV trend analysis and a new collaboration

As I try and further my understanding of the seeming incomprehensible autonomic nervous system I try to simplify the role HRV may play in monitoring athletes. There is one main issue I’m having; I don’t yet fully grasp the ANS (does anyone?) and therefore I still have a ton of unanswered questions.

I’ve noticed that there are some extremely intelligent people who are strong advocates of HRV usage as a monitoring tool. I’ve also noticed there are equally as intelligent people who are very skeptical and even doubtful of its efficacy and applicability. I’m doing my best to understand both sides of this argument. The best I can do to contribute to this discussion (at the moment) is draw attention to research and offer personal experience.

It’s been a while since I’ve posted and discussed some of my HRV trends so today I will do this as well as share some observations a colleague of mine has made at McMaster University.

Below is a screen shot of my HRV trend from the last 30 days:

  • Horziontal Blue Line = HRV Baseline
  • Vertical Purple Bars = sRPE (absence of these indicate no training)
  • White Lines = Day to day HRV scores

Training structure has been as follows:

  • Monday – Squat
  • Tuesday – Active Recovery
  • Wednesday – Bench Press
  • Thursday – Active Recovery
  • Friday – Deadlift
  • Saturday – Off
  • Sunday – Off

Strength workouts range from an RPE rating of 7-9 while the low intensity “recovery” days range between 3-5.

dec 2012 trend

Observations:

  • Much of what I’ve seen is consistent with what I documented in this post so I won’t discuss these in too much depth again.
  • Normally my HRV will be at or above baseline after a weekend (no training). In the first weekend you see my HRV dropped quite a bit Monday morning. I assume this is because I was away that weekend and I spent much of Sunday in the car and then was frantically trying to get caught up on things once I got home before Monday.
  • I trained at an sRPE of 8 on Monday and as expected another drop and a red indication for Tuesday. Active recovery typically will bump HRV back up the next day however Tuesday night I unknowingly went to sleep with my friends cat hiding under my bed. Around 2am I got a startling wake up as the animal tried to snuggle with my face. It took me nearly 2 hours to fall back asleep after. HRV that morning is another red and I feel like crap. I take a deload day on Bench  (sRPE 7), sleep well and HRV comes back up the next morning.
  • Things remain consistent during the week shown in the middle of the trend. Moderate dips in HRV in response to sRPE 8’s with returns to baseline after low intensity days. HRV is high after a restful weekend.
  • The following week I start doing a little more work in my workouts (more heavy sets) and therefore a higher sRPE rating (of 9). Along with higher amounts of soreness and perceived fatigue I saw larger dips in HRV the following day. On Friday (deadlift day) I keep things conservative due to previous lower back injuries and perform an sRPE of 8 and see less of a drop in HRV the next day. I’m happy to report that the back has been feeling good and I have started deadlifting again recently. I stopped deadlifting  for a while as I was experiencing pain during the lift (no surprise it was an underactive multifidus) Video below of a recent deadlift.
  • HRV is high after a restful weekend. sRPE of 9 on Monday (squat) of the last week shown on the image and I again see a larger dip in HRV (today). Will do some low intensity stuff later on after work.

Collaborating with Steve Lidstone at McMaster University

Since moving back to Canada I’ve been working on getting an HRV project going with Steve Lidstone, the head strength coach at McMaster University (a huge rival of mine in my football days). After some e-mail discussions I sent Steve an ithlete to try out. After a few weeks Steve sent me this update;

“I’ve been monitoring my HRV for 3 weeks now every morning.

I started off with HRV at 88 with a HR of 60bpm.

In times of poor sleep (we have 2 kids ages 2 & 4) or high stress my HRV has plummeted to 55 and resting HR of 79.

It is also interesting to me as I am in my 5th week of post concussion symptoms. When my HRV is low my symptoms are escalated.”

At this point we’re looking at getting two of his teams started with ithlete (about 8 players in total). Should make for some good data to discuss.

HRV Measurement Position Article

Recently an article of mine regarding standing vs. supine HRV measurement was posted here. The article includes;

  • A brief discussion of autonomic control of heart rate during supine rest and in response to orthostasis (standing)
  • A summary of some research pertaining to standing HRV measurements
  • A presentation of data I collected over a 2 week period where I measure and analyze both my standing and supine HRV scores in response to training load.

Check it out here.

HRV Guided Training, Periodization and Training Variables

Here are some things to consider when planning your daily workouts guided by HRV;

  1. What load of work can my body handle today?

    I primarily use HRV to determine this, however lately I’ve been doing some morning tap tests as well to see what I find (Tap Test App for iPod).

    I like to break adaptive capacity rating up into 4 categories

    1. High – Increase loads
    2. Baseline – Proceed with planned load (moderate to high)
    3. Below Baseline – Reduce load
    4. Low – Rest or Active Recovery

      *In this context load refers to a combination of volume and intensity of training

    iThlete provides color indications for each of these days to simplify interpretation;

    1. Green = High
    2. White = Baseline
    3. Amber = Below Baseline
    4. Red = Low

      Here is a “Baseline” HRV Score measured this morning

  2. What is the goal of the current training phase?

    Accumulation of volume? Intensity? Weight gain? Weight loss?

Your training plan will obviously reflect your training goal however I’ve learned that it’s wise to make necessary adjustments to load in response to the present day’s adaptation potential. The following are a list of variables that I like to manipulate on a daily basis according to HRV score within the context of the training phase/goal.

  1. Volume (number of sets and reps performed with the main lift and assistance work)
  2. Intensity (the amount of weight on the bar)
  3. Rating of Perceived Exertion (how close to failure I get with my sets)

Here is an example of how I manipulate these variables based on training phase and HRV score.

Example: Volume Phase in a Block Training system:

I consider total reps in the 15+ rep range (usually no more than 25 total reps) to be high volume. This can be 3×5, 5×3, 4×4, 5×4, 6×4, 7×3, etc.

  • If HRV is high: I will typically take the higher end of the volume scale using higher sets and lower reps. RPE falls between 9-10 (10 only on last set).
  • If HRV is baseline: I will work in the middle set/rep range of the volume scale. RPE stays around 9.
  • If HRV is below baseline: I’ll stick with the lower end of the volume scale (no more than 15 total reps) with RPE staying around 8.
  • If HRV is low: Active Recovery work, no lifting.

With this set up I can still accumulate volume as long as HRV isn’t low. If I take care of my sleep, eating and overall stress levels, low day’s usually only occur the day following a training session. This is why I lift every other day and perform active recovery on “off” days. The idea is to increase the volume when HRV is high with higher intensities (<3 reps, higher RPE). When HRV isn’t quite where we would like it, we still accumulate volume, but with less intensity and a lower RPE.

Another method I’ve used for manipulating loads on a daily basis is to use more of an undulating periodization approach as opposed to a block approach. With this approach volume, intensity and RPE are constantly changing from workout to workout.

Example Undulating Periodization Approach;

  • If HRV is high: Both volume and intensity will be higher (ex: 6×2 with RPE 9-10)
  • If HRV is baseline: Reduce volume OR intensity (ex: 3×3 with RPE 9 or 3×8 RPE 8)
  • If HRV is below baseline: Intensity AND volume is reduced (ex: 2×4 RPE 8)
  • If HRV is low: Deload workout/active recovery

With this system we increase total load when the body is prepared to handle it better and back it off when necessary. Higher HRV days will involve lower rep ranges to allow for a higher %of 1RM whereas lower HRV days will have higher reps to reduce % of 1RM.

Keep in mind these set ups were for the purposes of increasing strength. Through constant experimentation and evaluation I’m improving on my approach to training. These set-ups aren’t perfect but they worked well. I’m presently using the block approach illustrated in my first example in my current training.

In a few weeks I’ll hopefully get a good post up on how the tap test fits into my program design. I’m looking to see how it correlates to strength, HRV, RPE, etc.