Monitoring Training in a High School Football Player

Though I’m currently a solid 17 hour drive away from home, I still correspond with several athletes I formerly worked with prior to my relocation. I’ve got a few athletes sending me their ithlete data every week. I finally had time to sit down and analyze some of it and so today I’ll present and discuss the past four weeks worth of data from a high school football player.

Basic Descriptors

This athlete is currently a high school sophomore and will be the starting Quarterback for his high school Varsity Football Team. In addition to high school football, this athlete is also competing in track and field (Javelin, Shot Put and Triple Jump) and summer football.

Monitoring Variables

HRV: The athlete measures HRV with ithlete in a standing position  every morning after waking and bladder emptying.

Subjective Sleep Score: Following his HRV measurement, sleep was rated (1-5 scale) and comments were entered regarding the previous days events on the ithlete app.

sRPE: I also asked the athlete to provide a rating of perceived exertion score after each training session, practice or competition (1-10 scale) and input this into the ithlete training load feature. This is not multiplied by session duration.

Reaction Test: Lastly, the athlete performed a simple reaction test with this application after ithlete to assess psycho-motor speed.

My rationale for the selected variables is quite simple:

  1. These tools/metrics are simple, inexpensive and non-invasive
  2. The total time required to complete these is between 3-5 minutes each day. Keeping them easy and quick helps with compliance which as you’ll see, was a non-issue for this athlete.
  3. I wanted both objective and subjective markers
  4. The Reaction test often gets talked about but rarely do I see any data. After having some personal success with it I decided to test it out with him.

4 Weeks of Data and Analysis

The following data is from the last 4 weeks where the athletes Track&Field  and Football schedules overlapped, resulting in a significant increase in physical stress. I have no influence on his current training, schedule, etc. and therefore this analysis is entirely retrospective. Furthermore, I always recommend that training and life style remain unchanged when people start using ithlete. After a few months of training we then analyze the data and determine what course of action to take from there. By making training/life style manipulations right from the start it will be hard to determine how effective they may be. With that said, the data is presented below, broken down into each constituent week.

*Note: Click images to enlarge. Reaction test results fall under “Tap” in the tables starting in week 2.

Week 1

Week 1

Week 1:

  •  No Reaction Test data this week, commences in week 2.
  • Training appears to be well tolerated all week with a spike in HRV after a rest day followed by a track meet on Saturday 4/28. The track meet appears to be more stressful than is perceived by the athlete based on the 9 point drop.
  • Training load weekly sum is 31
  • HRV weekly mean is 92.4
Week 2

Week 2

Week 2:

  • He appears to be insufficiently recovered from the track meet and persists with intense training. HRV remains below 90 all week while the previous week stayed above 90.
  • With some fatigue accumulated he has a track meet on Friday followed by a Football game on Saturday. The trend this week indicates high fatigue compared to the previous week.
  • Training load weekly sum increases by 16%.
  • HRV weekly  mean drops by 8 points; Sleep total drops slightly, First Reaction weekly mean is 262.1
Week 3

Week 3

Week 3:

  • Poor sleep and high soreness is reported early this week after the very stressful previous week. On 5/7 he stays home from school with cold/flu symptoms.
  • He recovers quickly and the rest of the week looks pretty good as his HRV trends back  up over 90.
  • Football game on Saturday causes a decent drop in HRV. Sunday is a rest day.
  • HRV weekly mean improves to 86.6; Training load decreased; Reaction speed decreased (faster).
Week 4

Week 4

Week 4:

  • HRV peaks at 96 after a much needed day off on Sunday
  • 2 Track meets this week with a new personal best throw; perceived training load decreases slightly and HRV started trending up approaching 90.
  • HRV weekly mean increases slightly, Sleep quality increases, Reaction Time is similar to previous week (slight increase).
4 Week Trend

4 Week Trend

Further Analysis 

In the screen shot below, I’ve included a table and chart of the weekly mean of HRV and Reaction Time, as well as the weekly sums of Training Load and Sleep score. In the table to the right I’ve calculated some correlations.

Mean Values, Correlations

Mean Values, Correlations

Brief Thoughts

This data set supports the theory of monitoring not just the daily, but also the weekly trend changes in HRV. However, keeping tabs on the day to day changes, particularly after intense workouts or competition, can allow for more appropriate training load manipulations to try and influence the weekly changes. This is particularly important during a competitive season where overreaching is not desired. Clearly in this case, the athlete experienced some overreaching after the abrupt increase in physical stress evidenced by his illness, disturbed sleep etc. However, the overreaching was short-term and the consequences short-lived as he quickly recovers. When HRV peaks in week 4 we also see an increase in performance (Track PR). Of course the overreaching easily could have been avoided had he not been trying to train for and compete in two different sports at the same time. However, this is the reality of many high school athletes who try and juggle multiple sports in the same season.

Similar to my experience discussed here, his Reaction test essentially mirrored HRV when the weekly means were calculated. Perceived training load clearly had the biggest effect on these two variables. Unfortunately we didn’t incorporate the Reaction Test until week 2 so keep that in mind when looking at the correlation values as week 1 was not included with Reaction Time.

In this case, I do not believe that the RPE of the competitions provided a good reflection of actual competition stress. In many cases when he had a competition, HRV would decline quite a bit yet the RPE would be moderate. Competing adds another element of stress unaccounted for in these situations which should be considered by coaches.

I believe that this athletes short term overreaching and subsequent illness and sleep disturbances could easily have been avoided. Reacting to the decrease in HRV, increase in Reaction time, increased soreness, poor sleep ,etc. by allowing for more recovery time likely would’ve averted this. However, how this would effect his performance in the following weeks when HRV peaks and he see’s an increase in performance is unknown. After several days of a decreasing trend in HRV, rest should be strongly considered, particularly during competition periods.

The comments section of ithlete was valuable in communicating to me brief details about what in particular may be causing stress. This is an undervalued and underrated feature in my opinion.

HRV and Reaction test weekly mean and perceived training load weekly sum each appear to be sensitive markers of the physical stress load experienced by this athlete. Adjusting training loads appropriately in response to these variables may have prevented the unintentional overreaching and illness experienced by this athlete. From this set of data we can conclude that HRV, Reaction test and perceived exertion ratings were effective markers of training status with this athlete.

HRV Case Study of a Powerlifter with Cerebral Palsy Preparing for Competition

Shortly after my relocation to Alabama, I was given the opportunity  to oversee the competition preparation of a young powerlifter who had been training here at the AUM Human Performance Lab under the care of Dr. Mike Esco and his staff. He was about 5 weeks out from competition at the time of my arrival. Below is a detailed account of the training program with HRV data, training load and sleep score.

The athlete is a 22 year old male with Cerebral Palsy and can therefore only compete in the Bench Press. He competes in the 123lb weight class (actual weight is 121). His best competition lift was 200lbs recorded this past February at his first competition.

After observing a couple of workouts, I could see that Zarius was missing out on some poundage due to technical flaws. The focus of the program was therefore to improve his bench press technique and get him more accustomed to the competition commands. We trained 3x/week and used a full body, undulating approach that enabled us to Bench Press each session to further develop technique.

The original program is below and was followed with only minor adjustments here and there. The chosen sets/reps and percentages were inspired by those outlined Tri-Phasic Training. This allowed for the completion of only quality reps; avoiding failure and saving the grinding for competition. You’ll notice the corresponding rep ranges for each percentage are well below typical capabilities. (i.e. 85%x2 rather than 85%x5-6). Assistance work progressed in weight or reps each week based on performance.

Z_program

Beginning on day one of week one, the athlete recorded HRV each morning with ithlete on his iPod Touch in a seated position. Sleep was rated on a scale of 1-5 on the app. Training load was manually entered based on training intensity to make interpretation easier from the trend in relation to his HRV. Perceived values are not included.

Below is all of the raw data as it appears when exported from the app into Excel followed by a recreation of his 4 week trend. I’ve highlighted high and low HRV days in the respective colors used by ithlete. You’ll note that measurements are missing on two occasions; 4/18 and 5/12.

Z_raw_data

Z_trend

Below are images of his weekly averages of HRV and training load. Training load in this context is simply intended to represent a progressive increase in intensity followed by a deload and then competition.

Z_avg_table

Z_avg_trend

There’s a clear progressive increase in his HRV trend right up until the start of week 3. Week 3 was the highest intensity training week with a slight reduction in volume. It appears that intensity rather than volume created more fatigue. His HRV peaks during the deload week. The deload week included 2 workouts. On Monday we worked up to his opener of 240lb for a single and on Wednesday we worked up to 70% for a few singles with emphasis on the competition commands and pausing.

You can see that the morning of the competition (5/11) there is a small drop in HRV. I attribute this to pre-competition anxiety based on feedback of mood, perception, etc. He appears to have slept well leading up to the meet. HRV remains suppressed until the 3rd day after the competition where it starts to trend back up, however still remains below average. This clearly shows the additional psychological/emotional stress that competing places on the body.

Results

1st Attempt – 240 Good
2nd Attempt – 250 Good
3rd Attempt – 255 Miss at lockout (very debatable)

He added 50lbs to his competition best since February. His next meet will be in October where he’ll be looking to shorten the gap he has to close to fulfill his dreams of qualifying for the Paralympics.

943236_10100344933474230_863845112_n

Individual HRV Responses In Professional Soccer Players During A Competitive Season

In a team setting environment, athletes are often exposed to similar training loads during practices, training and competition. Monitoring of only the external training load provides coaches with an incomplete picture of how individual athletes may be responding and adapting to the training schedule. Two athletes can in fact respond entirely differently to the same program. A recently published case study by Bara-Filho et al. (2013) demonstrates how HRV, when measured periodically throughout training, can help distinguish these individual differences in professional soccer players exposed to the same training schedule. The following is a brief summary and review of this case study.

Materials and Methods

Subject 1 was a 26 year old Mid-Fielder with 7 years of professional playing experience. Subject 2 was a 19 year old Right Back with only 1 year of professional playing experience.

Over a 3 week period during a competitive season, both subjects participated in training that consisted of small-sided games, simulated matches, strength training, sprint training, and low-intensity aerobic recovery work. Training took place 1-2 times per day, 5 day’s/week culminating in a competition on the 6th day and rest on the 7th. Both subjects were starters in the 3 matches that occurred over the observation period.

HRV was measured on 5 occasions throughout the 3 week period on each Saturday and Monday morning (excluding the last Monday). This allowed for HRV indices to be evaluated both after the weekly training load was accumulated (Saturday) and after recovery (Monday). This is precisely the protocol that I discussed in a recent post entitled Making HRV More Practical for Athletes: Measurement Frequency.

HRV data was collected in the morning with a Polar RS800 watch while the athletes rested in a supine position.

Results

Total weekly TRIMP values were similar in both athletes. After the first measurement (M1) Subject 1 showed an increasing trend in several HRV values (RMSSD, HF, SDNN, SD1) indicating good adaptation to training and quality recovery from competition. Subject 2 showed a progressively decreasing trend in these same HRV values indicating an accumulation of fatigue and insufficient recovery.

Discussion

The authors suggest that subject 2, who saw a decreasing trend in his HRV values, may have been experiencing stressors unrelated to sport that may have contributed to his insufficient recovery. Though subjective measure (questionnaires) were not included, the physical training coach reported that athlete 2 would inform him that he was experiencing disturbed sleep, fatigue during training, and poor recovery.

A lower level of playing experience in subject 2 was reported as another possible explanation for his descending HRV trend. The psychological stressors and anxiety experienced by this younger athlete may have also contributed.

The authors briefly discuss the limitations of a supine measurement only when using HRV to monitor training load in athletes. Essentially, individuals with low resting heart rates appear to be subject to “parasympathetic saturation” in the supine position, possibly skewing the data. Therefore, including measurement performed in the standing position may serve as a resolution to this issue. I discussed this topic in a previous post entitled Supine vs. Standing HRV Measurement.

Finally, the authors conclude that HRV values were useful in monitoring the effects of a competitive training schedule in athletes as these values appear to be sensitive to individual characteristics as well as stress and recovery. A stable or increasing HRV trend appears to be favorable as it indicates quality recovery and adaptation to training. In contrast, a decreasing trend in HRV indicates higher stress and impaired recovery which may necessitate recovery interventions and reductions in training load.

Reference

Bara-Filho, M.G., et al. (2013) Heart rate variability and soccer training: a case study. Motriz: rev. educ. fis. 19(1): 171-77. Free Full-Text

Reaction Test for Athlete Monitoring: Research and Considerations

Distinguishing functional over-reaching (FOR) from non-function over-reaching (NFOR)can be difficult to do during overload periods; particularly when laboratory measures are inaccessible to the coach or athlete. A common criteria used to determine FOR from NFOR is to assess performance before and after overload training. The fatigue accumulated from the increased training loads will result in expected performance decrements. After an unloading period of 1-2 weeks, performance should return to or exceed pre-overload performance values. An athlete can be considered NFOR if performance remains suppressed after this 2 week period.

Coaches can be proactive in their efforts to avoid NFOR with their athletes by maintaining various monitoring strategies. Keeping tabs on certain variables throughout overload periods allows the coach to detect early warning signs that may indicate excessive fatigue in an athlete(s). Such a metric often discussed is the reaction test. Today I will review some of the available research that investigates the efficacy of the reaction test as a method of potentially determining or indicating NFOR in athletes.

Why The Reaction Test?

The theory behind why the reaction test may serve as a good indicator of overreaching and/or the overtraining syndrome has been postulated by Nederhof et al (2006). Essentially, the overtraining syndrome has several signs and symptoms also seen in chronic fatigue syndrome and major depression. Both chronic fatigue and major depression are associated with slower psychomotor ability. Thus, it is hypothesized that psychomotor speed may be slower in athletes with OTS.

Reaction Test and Overreaching

Nederhof and colleagues (2007) put their theory to the test and evaluated performance, perceived fatigue/mood (RESTQ-sport and POMS) and psychomotor speed (reaction tests) in trained cyclists (n=14) and a control group (n=14). Training load was monitored via sRPE (RPE x session length). Testing was performed at baseline, following a 2 week overload period and once more following a 2 week taper. Of the 14 cyclists, 5 were considered FOR (they fulfilled at least 2 out of the three objective criteria in combination with at least 1 subjective criterion during the second but not during the third exercise test) and 7 were considered well trained (WT) while the remaining 2 were excluded.

Two reaction tests were used. The first described test was the “Finger Pre-Cuing Task” that required the individual to react to a prompt by pressing the correct keys on a computer. The other test was the “Determination Test” that required either manual of pedal reaction in response to visual or auditory stimuli also on a computer. Full descriptions of these tests can be read in the full text here.

The control group and the WT group improved their reaction time at each test. The FOR group however showed increased (slower) reaction time after the overload period but improved reaction time beyond baseline values after the taper. Regarding statistical significance the authors stated; “After high load training the FO group was 20% slower than the control group and 8% slower than theWT group. For comparison, patients with major depression are 20 to 26% slower than healthy controls [21,32] and patients with chronic fatigue syndrome are 15% slower than healthy controls [21]. Thus, although not statistically significant, differences in the present study are meaningful“.

Rietjans et al (2005) aimed to determine if a combination of test parameters could help detect overreaching in 7 well trained male cyclists. Over a 2 week period, training load was doubled while intensity was increased by 15%. Values for the following tests/assessments were collected pre and post training period: Maximal incremental cycle ergometer test with continuous ventilatory measurements and blood lactate values, time trial, basal blood parameter tests, hormones (GH, IGF-1, ACTH, neuro-endocrine stress test, shortened POMS, RPE and a cognitive reaction time test.

The results: “A novel finding was that reaction times increased significantly, indicating that overreaching might adversely affect speed of information processing by the brain, especially for the most difficult conditions. After the intensified training period, neither changes in exercise-induced plasma hormone values, nor SITT values were observed. During the CAPT only cortisol showed a significant decrease after the intensified training period. Hemoglobin showed a significant decrease after the intensified training period whereas hematocrit, red blood cell count (RBC) and MCV tended to decrease. The intensified training had no effect on physical performance (Wmax or time trial), maximal blood lactate, maximal heart rate and white blood cell profile. The most sensitive parameters for detecting overreaching are reaction time performance (indicative for cognitive brain functioning), RPE and to a lesser extend the shortened POMS. This strongly suggests that central fatigue precedes peripheral fatigue. All other systems, including the neuro-endocrine, are more robust and react most likely at a later stage in exhaustive training periods.”

Reaction Test and Perceived Performance 

Nederhof and colleagues (2008) set out to determine if reaction tests are related to perceived performance in rowers. On 5 occasions over the course of a season, reaction tests were performed along with perceived performance measures (“Reduced Sense of Accomplishment” scale from the Athlete Burnout Questionaire) in varsity rowers. The same two reaction tests (Finger Pre-Cueing and the Determination Test) described above were used. The results showed that a significant relationship between the Determination Test and perceived performance. The authors stated; “…rowers who scored higher on the ‘‘Reduced Sense of Accomplishment’’ scale of the Athlete Burnout Questionnaire had longer reaction times on the determination test. For every point the rowers scored higher, their reaction times were 18 ms longer on the action mode and 12 ms on the reaction mode of the determination test. This effect was not found for the finger pre-cueing task.”

Though their hypothesis was supported, the authors affirm that several practical issues require resolution.

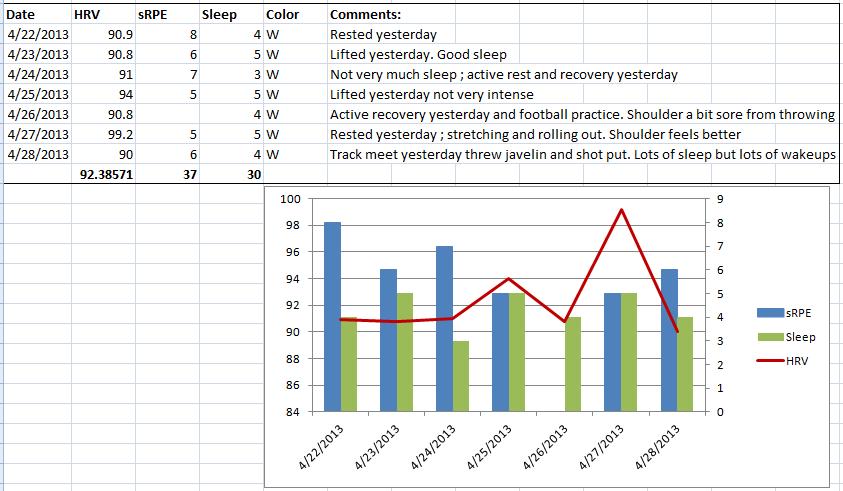
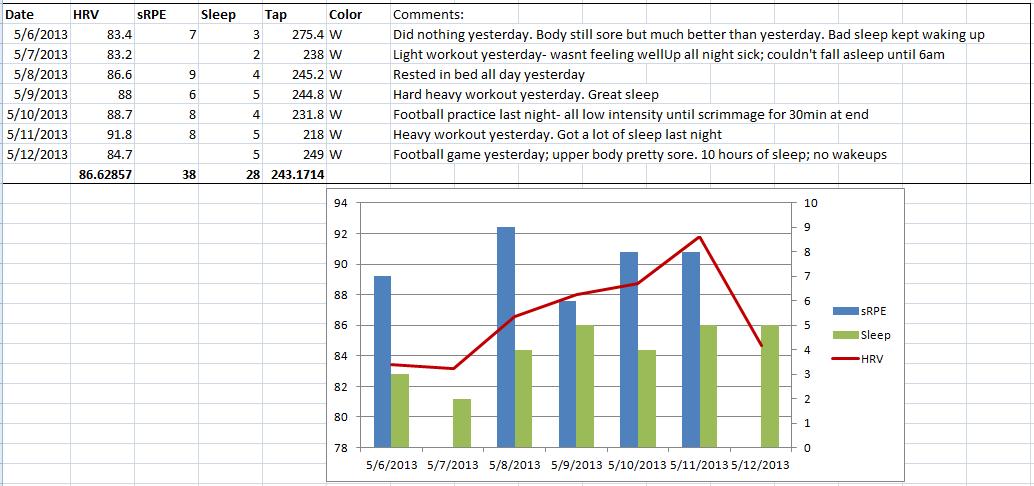
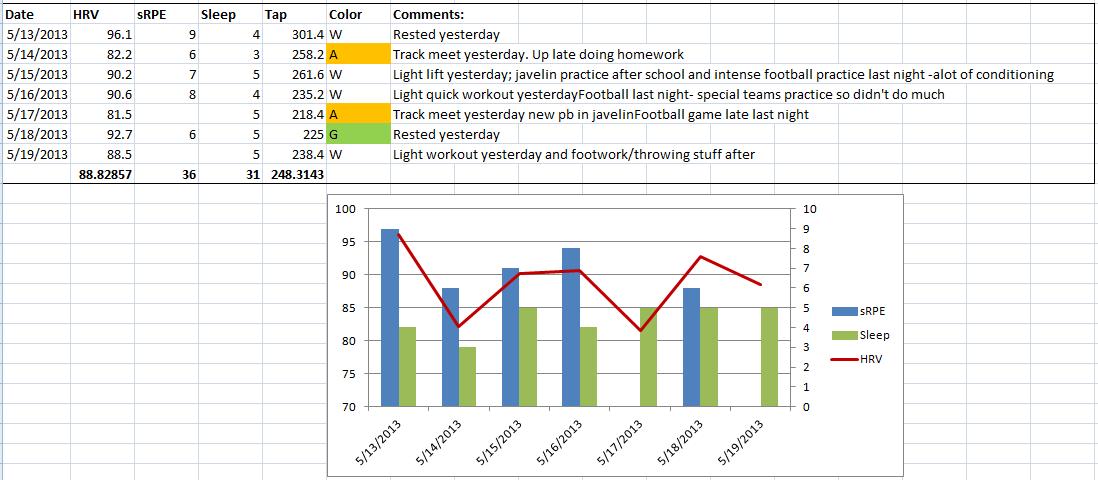
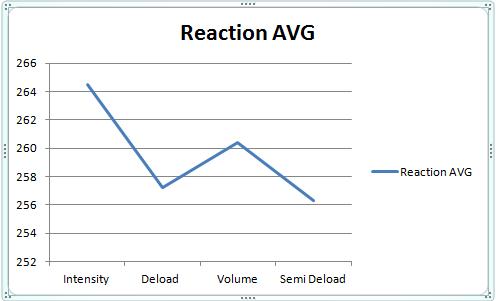
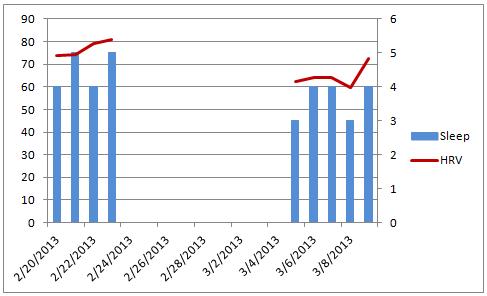
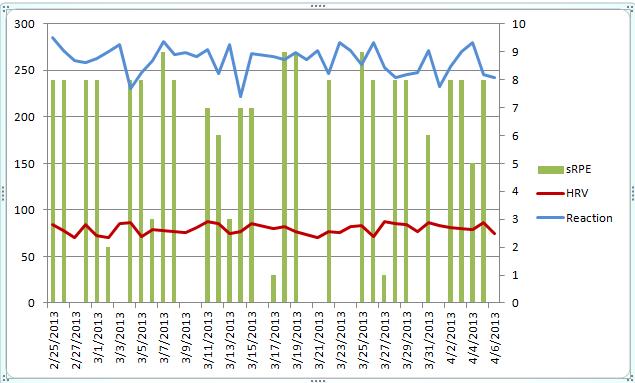
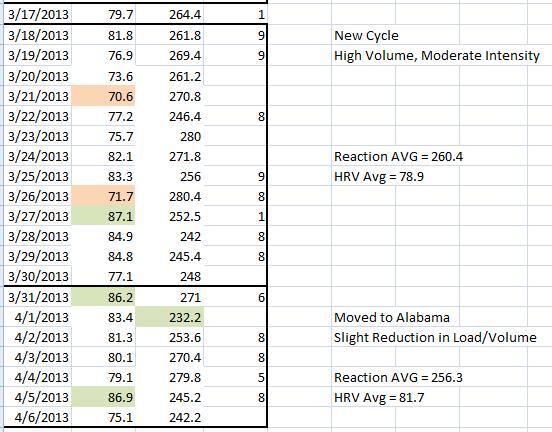
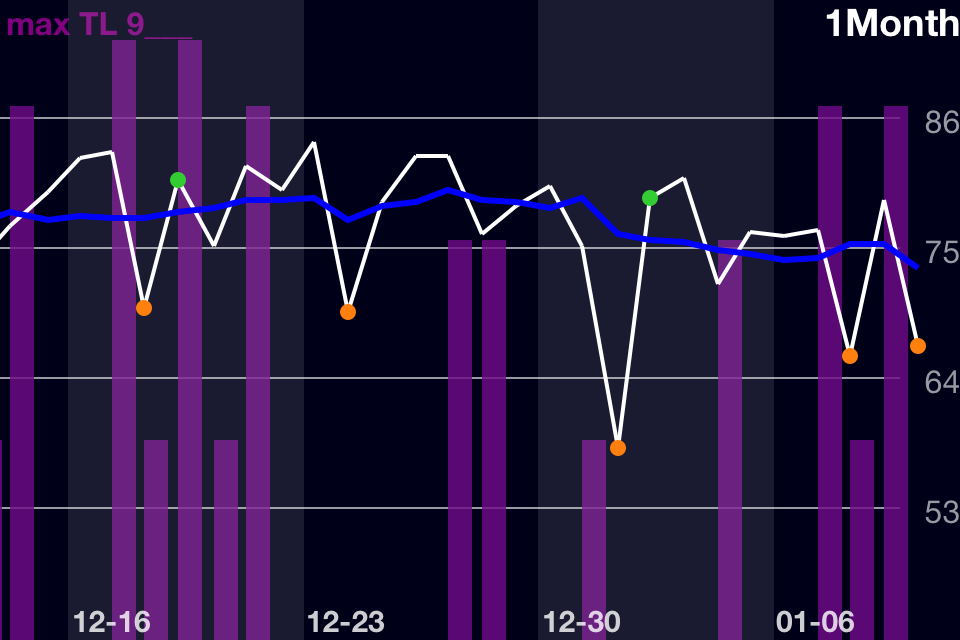
My Reaction Test Data Compared to HRV over 4 Different Training Periods

For a much more elaborate discussion on this experiment you can see the original post here. Essentially what I found was that Reaction test average and HRV average mirrored each other at each training period. HRV decreased and Reaction time increased (slower) during High Intensity and again during High Volume training reflecting fatigue. During reduced training loads HRV increased and Reaction time decreased (faster).

Reaction average trend

HRV Avg Trend Reaction Blog

Considerations and Limitations

The reaction test appears to be a test worthy of consideration for coaches looking to incorporate monitoring variables into their training regime. The following is a list of factors to keep in mind regarding this test:

• Caffeine has a well-established effect on reaction time and should therefore be controlled for when implementing reaction testing

• Psychological factors can impact the effectiveness and reliability of the test. Though this is an objective test, the effort put forth by the athlete may not be consistent. Since this test is sensitive to small changes in reaction time, this can obscure data and thus interpretation.

• As with HRV, it is probably best to experiment with a reaction test with a small sample of athletes to determine its usefulness before trying to implement with an entire team.

• Just like any other monitoring variable, reaction time should be considered with other factors when attempting to draw meaningful interpretations from the results.

Reaction time test results appear to respond early to fatigue during overload training. Reaction times (test dependent) may correlate with perceived performance. The simplicity, practicality, affordability and non-invasiveness of a reaction test make it appealing to coaches as a field test.

References

Nederhof, E., et al. (2006) Psychomotor speed: possibly a new marker for overtraining syndrome. Sports Medicine, 36(10): 817-28.

Nederhof, E., Lemmink, K., Zwerver., J. & Mulder, T. (2007) The effect of high load training on psychomotor speed. International Journal of Sports Medicine, 28: 595-601.

Nederhof, E., Visscher, C. & Lemmink, K. (2008) Psychomotor speed is related to perceived performance in rowers. European Journal of Sport Science, 8(5): 259-265

Rietjans, GJ., et al. (2005) Physiological, biochemical and psychological markers of strenuous training induced fatigue. International Journal of Sports Medicine, 26(1): 16-26.

Spring Break Impact on HRV and Performance: Comparing Data From 2 Athletes

Generally, one of two things can happen when an athlete heads off for spring break or vacation:

Scenario 1: He or she parties all week with friends; drinking alcohol excessively each day, eating terribly and sleeping poorly. These athletes return in rough shape, exhausted and dehydrated.

Scenario 2: He or she vacations with family, thus eating and sleeping reasonably well and likely not binge drinking daily. This athlete returns refreshed and recovered.

This can be problematic when working in a team environment as some athletes will be ready (both physically and mentally) to continue with the training program while the others certainly will not be. Oftentimes, a coach or trainer will schedule these vacation breaks as planned unloading periods, marking the transition from one phase to another.

Below is some HRV data from a hockey player I was working with prior to my relocation to Alabama. Preceding his departure for Cuba, his HRV was averaging mid to high 70’s with the odd 80. He then departs for Cuba with some friends for a week or so to enjoy some time off. Upon returning from vacation it becomes quite clear as to what went down (pun intended) during the trip. He did not maintain daily measurements while being away but when he resumes his measurements after returning we can see the consequences of his behavior.

 HRV Data Before and After Vacation in a Hockey Player AEvacadata

AEvacatrend

It is quite clear that his ability to resume his daily routine is compromised. For his first week back from vacation, I reduced the volume and intensity of his workouts and changed his conditioning work from highly anaerobic/interval based to much more moderate and aerobic based.  Even though training loads were reduced, the workouts were still a bit of a struggle to get through for him. We can also see that his perceived sleep quality is also down.

The above data set appears to be in direct contrast with that of a football player who vacationed with family (he is much younger than the hockey player). Unfortunately, this athlete has no data prior to vacation as he didn’t have the ithlete hardware yet. His daily measurements commenced on his first morning back from vacation. Based on his average’s following the vacation it would be safe to assume that his trip was hardly stressful. He was able to resume training without the need for any adjustments in intensity or volume. He essentially picked up right where he left off.

HRV Trend Upon Return From Spring Break in a Football PlayerVLtrendpostvaca

Final Thoughts

HRV appears to reflect the nature of the vacation in these two athletes. One athlete spent his vacation partying, drinking and eating and sleeping poorly. His HRV trend is significantly affected as a result. Performance, work capacity and perceived sleep quality are negatively affected upon his return and resumption of daily routine. A significant reduction in training load was required. The athlete who vacationed with his family and maintained a reasonable eating and sleeping schedule while avoiding excessive daily alcohol consumption saw apparently no effect in his HRV trend. Training and daily routine resumed without effect.

HRV and Reaction Test Data and some updates on our HRV research

I posted some data a couple of months ago comparing my HRV to my tap test results to see if there was any correlation between the two. You can see that post here if you missed it. It was around that time that I also started using a Reaction Test app. Today I’ll be posting and reviewing my Reaction Test data with my HRV data to see what it might reveal. At the end of the post I’ll provide some brief updates on what’s been happening since I started working in the Human Performance Lab here at Auburn (Montgomery).

HRV: I continue to use ithlete as my main HRV metric. Daily measurements are performed each morning after waking and bladder emptying. All measurements are performed in the standing position with paced breathing. The HRV value provided by ithlete is Ln RMSSD x 20; a time domain measure of parasympathetic tone.

Reaction Test: The reaction test is performed after my HRV test and my Tap test (I’m still doing these but will not include them today). All reaction tests were performed using right index finger. The app functions as follows;

  1. initiate app
  2. Tap target area to start the test
  3. React to stimuli (color change) as fast as possible by tapping the screen
  4. Repeat for a total of 5 reactions (variable time intervals between)

Image

I used excel to calculate daily average with the reaction test data (plotted on the charts below).

Keep in mind that for a correlation between high HRV and good Reaction Test, we want to see an inverse relationship in the trends. We’re looking for a fast Reaction time (trending down) with a higher HRV score (trending up).

Chart 1 – HRV, Reaction Test Average and Session RPE (secondary axis)  

Image

For more clarity I’ve also included excel screen shots of the raw data. I’ve sectioned off 4 different areas and noted the goal/purpose of that particular time of training. It works out so that there is a High Intensity section, a Deload section, a High Volume Section, and a Semi-Deload section. The “Semi-Deload” period occurs over the past week that I’ve moved to Alabama. I figured it would be wise to scale intensity and volume back very slightly while I settle in to a new place and new work environment. To give an example, I essentially removed a main working set and stuck with familiar weights. Assistance work was relatively unchanged.

ImageImage

* I must have forgotten to perform a reaction test or forgot to save it on 03/16 which was a Saturday and therefore it is not included.

I’ve highlighted any score that was +/- 10% from the total average. So for exampme; if HRV was 10% higher than the average of all HRV scores, I would shade that day green. Likewise for Reaction Test. Red shading denotes 10% or greater reduction.

After examining the acute relationship between Reaction Test and HRV I decided to examine the averages for each training block. I’ve shifted my focus lately a little bit more on weekly trend changes vs. daily trend changes. As you can see in the charts below, there is a very strong relationship between HRV AVG and Reaction Test AVG during each training section.

ImageImage

–          Intensity Section – This section was the last 2 weeks of my 9 week training cycle that I performed after the Christmas break (discussed here). Volume was low but intensity was Maximal. HRV is at it’s lowest average while Reaction Test is at its highest (slowest reaction time) average.

–          Deload – During the deload week HRV average rebounds to peak levels while reaction time improves to near peak levels.

–          High Volume – This marks the start of a new training cycle. HRV drops quite a bit and Reaction Time average increases (slower reaction).

–          Semi-Deload – HRV returns to near peak values while Reaction Test peaks (quickest reaction time average).

From this data set, intensity appeared to have the biggest effect on Reaction Test average and HRV average. High volume work with moderate intensity also had a significant impact on these averages. It should be kept in mind that the Intensity period followed several weeks of training and therefore some fatigue had already been accumulated. I didn’t start using the reaction test until late February.  HRV and Reaction averages improve over periods of reduced training load.

Given that I was able to hit some PR’s in the gym during the Intensity section (under high fatigue), I’m inclined to say at this point, based on this data set, that these tests are not necessarily indicators of performance potential (strength), but rather markers of fatigue. In the future I would like to see how these tests match up with “finer” motor skills in other athletes.

Quick Updates

I made it safely to Montgomery, AL after a nice visit with some family at my folks place in Cincinnati over Easter. Total travel time was about 17.5 hours. We wasted no time in getting to work in the lab. We’ve got 3 projects going on right now (the first two being more health related  as opposed to sports/performance).

  1. I’m helping Dr. Esco complete a study comparing post-exercise HRV recovery after two different modes of exercise (cycling vs. treadmill at same intensity/duration).
  2. We are starting a new study comparing post-exercise HRV in middle aged men after 3 modes or resistance training; Eccentric only; Concentric Only; Traditional Resistance Training
  3. We have put the wheels in motion for a cross-validation study comparing ithlete to EKG. We did some pilot work with about 6 subjects so far and have IRB Forms and Consent Forms about ready for submission. We’ll measure ithlete and EKG simultaneously in about 20 males and 20 females then run the data. This is a very important study to me. In order to improve what we know about HRV and performance, we need more data. Using EKG’s in the field is not practical. What we need to start seeing is data from athletes that are performing measurements at home when they wake up. The device needs to be extremely easy to use and the data needs to be immediately available to the coach. At this time, smart phone app’s are the best way to do this. There are plenty of limitations with this but at the end of the day, if we’re going to apply this stuff in a team setting we need easy to use, affordable tools.
  4. This last project doesn’t exist yet. But I’m hoping to collect data on either the men’s tennis team or the women’s soccer team. I’ll provide more info on this if and when it starts to take shape.

Let me be clear right from the start in saying that Dr. Esco is running the show here. I’ve learned a ton from him already about the research process and anything that I accomplish over the next little while will be because of him.

Lastly, I attended my first Roller Derby which was quite the experience.

Effects of Alcohol Consumption on HRV and Sleep

Excessive alcohol consumption is not uncommon among high school, collegiate and professional athletes. This typically occurs after competitions during the season and likely with greater frequency throughout the offseason. Today I’d like to share what I’ve learned after reading through the available research pertaining to alcohol and HRV in healthy individuals. In addition I will post up some ithlete data I’ve collected showing the effects that excessive drinking has on HRV.

Bau and colleagues (2011) investigated the effects of 60g of ethanol ingestion on HRV in young men. HRV was measured before and during the following 17 hours after ingestion. Compared to the control group, the ethanol group saw a decrease in all time domain indices of HRV that persisted for 10 hours.

Koskinen et al (1994) tested the effects of ethanol consumption (1g/kg) on HRV in healthy young males (n=12). HRV was measured prior to ethanol ingestion and once each hour for 3 hours after ingestion. A significant decrease in RMSSD and HF was observed compared to control.

In healthy volunteers Weise et al. (1986) observed an immediate reduction in HRV after alcohol consumption (0.7 g/kg) with no change in HR or blood pressure.

Spaak et al. (2009) investigated the dose-related effects that red wine, ethanol and water have on HRV in a mixed group of healthy folks (n=12). Essentially, one drink of either red wine or ethanol had no effect. However, after the second drink HR increased and HRV decreased (Total HRV by 28-33%, HF by 32-45%, LF increased 28-34%).

The last study I’ll discuss is perhaps the most relevant. Sagawa et al. (2011) monitored HRV and sleep quality (polysomnography) after alcohol consumption in university aged healthy males (n=10). There was a control group, a low dose (LD) group (0.5g/kg) and a high dose (HD) group (1g/kg). As you can imagine, there was a dose related effect of alcohol on HRV and sleep. The HD group saw the lowest HRV value, highest RHR and poorest sleep quality. The LD group also saw reduced HRV, increased RHR and reduced sleep quality compared to control.

Below is a screen shot of mine from over the Christmas holidays. There is a marked drop in HRV on New Year’s day following a late night of NYE celebration that included several drinks.

RPE Trend Jan 10

The data set below is a re-creation in excel from an athlete/colleague who doesn’t know how to take a screen shot with his phone (c’mon man!). The three lowest dips on the trend all occur in March after nights out drinking on the 10th, 16th and 23rd. The dip from the 12th is reported to be caused by other stressors.

JH_Alcohol_trend

Wrap Up

For those who didn’t already know, alcohol has a negative effect on HRV and sleep quality in healthy individuals. Clearly this can impact recovery and performance  and therefore should be avoided, or limited to time periods away from competition and/or rigorous training schedules.

References

Bau. P.F.D. et al. (2011) Acute ingestion of alcohol and cardiac autonomic modulation in healthy volunteers. Alcohol, 45: 123-9.

Koskinen, P. et al. (1994) Acute alcohol intake decreases short-term heart rate variability in healthy subjects. Clinical Science, 87(2): 225-30.

Sagawa,Y. et al. (2011) Alcohol has a dose-related effect on parasympathetic nerve activity during sleep. Alcoholism: Clinical & Experimental Research, 35(11): 2093-99

Spaak, J. et al. (2009) Dose-related effects of red wine and alcohol on heart rate variability. American Journal of Physiology, Heart & Circulatory Physiology, 298(6): H2226-31.

Weise, F. et al. (1986) acute alcohol ingestion reduces heart rate variability. Drug & Alcohol Dependence, 17(1): 89-91.

Why Assess the ANS?

I just finished watching a presentation by Andy O’Brien entitled “Modern Concepts in Program Design – A Systematic Approach to Individualization”. Andy O’Brien works with elite athletes including NHL star Syndey Crosby. His presentation is 28 minutes long and is truly worth watching if you work with athletes. After listening to his talk, you’ll understand why he works with such high level athletes. I’d also like to add that this is yet another great free resource put out by John Berardi and his team at PN. I have no problem endorsing a company that continually puts out top notch information for free. The thoughts in this post are inspired from the ideas and concepts discussed by Andy O’Brien.

In his presentation, Coach O’Brien essentially views program design as problem solving. Naturally, the first step in designing a program is assessing the athlete. An assessment allows us to form a needs analysis and determine limiting factors that impede progression.

An example was provided of a weight loss client who wanted to lose X amount of fat in time for a wedding. After the trainer decided that diet was not the limiting factor, emphasis was placed on increasing calorie expenditure. What would appear to be a very effective program for improving body composition was prescribed (resistance training, aerobic and anaerobic conditioning, plus a thermogenic supplement). The results however were quite surprising. The client in fact gained fat after several weeks. The reason? Incorrect identification of the limiting factor.

It turns out that the client had a significant ANS imbalance of sympathetic predominance. Even before the exercise program, the nature of her work and lifestyle was highly stressful. Adding intense exercise 5 days/week only further increased this imbalance resulting in unfavorable hormonal responses and poor adaptation to the program.

O’Brien mentions a related study by Messina et al. (2012) entitled “Enhanced parasympathetic activity of sportive women is paradoxically associated to enhanced resting energy expenditure”. Unfortunately I do not have access to this text at the moment but here is an excerpt from the abstract; “These findings demonstrate that resting energy expenditure is higher in the athletes than in sedentary women, despite the augmented parasympathetic activity that is usually related to lower energy expenditure.”

This is one example of why it is important to assess the ANS. I think there are many folks who reject HRV as a useful metric in monitoring athletes or individuals. Perhaps this is because there is a misunderstanding of what the data is telling us or perhaps because interpretation of the data is difficult. Maybe it’s a compliance issue. Regardless, in my opinion, an objective measure of ANS status requires at the very least, periodic assessment for several reasons.

We measure strength, power, body comp, etc. yet ignore one major component of the body that largely acts as a moderator in training response and adaptation. HRV is likely the cheapest and most efficient non-invasive tool we can use to acquire ANS information.

To be clear, I’m not saying that HRV is first in the hierarchy of assessment (if one exists). I’m merely saying that the ANS plays a huge role in our health and performance and requires monitoring and assessing just as much as performance and body composition. How can we rule it out as a limiting factor if we don’t consider it at all?

HRV and Deload Periods

Before I review my own data from my overload and deload period, I first wanted to discuss some of the available research that I have pertaining to HRV response to overload training and following recovery.

Some Research Pertaining to HRV and Taper/Deload Periods

Pichot et al. (2000) monitored HRV in middle distance runners over 3 weeks of intensive training followed by a 1 week recovery week consisting primarily of moderate aerobic work. RMSSD decreased progressively over weeks 1-3 and rebounded to peak values during the recovery week.

Pichot et al. (2002) found that RMSSD increased after an aerobic training period in sedentary subjects. After transitioning to a 4 week overload period, RMSSD decreased significantly followed by an abrupt rebound reaching peak values during a 2 week recovery period.

In a study by Baumert et al. (2006), baseline HRV values were established prior to training camp in track and field athletes. After week 1 of a 2 week training camp, RMSSD declined significantly. At 3-4 day’s post-training camp, RMSSD started to return toward pre-camp basal values.

In elite rowers, Iellamo et al (2004) reported that HRV indices decreased as training load increased from 50% to 100%. However, during a taper for the World Championships, HRV values returned to baseline. “Reduction in training load during the World Championship resulted in a return of autonomic indices to the level observed at 50% training load”

Though not a comparison for pre and post HRV values following overload, Buchheit et al. (2004) showed that moderate training loads are better than no training or intensive training for the purposes of increasing vagal-related HRV indexes. Their data revealed that moderately trained individuals had higher basal HRV values compared to sedentary and highly trained individuals.

Reviewing my data

In older posts I discussed my experimentation with not taking planned deload weeks but rather reducing training loads on days when HRV was low. This method of managing training loads worked very well during times of consistent, albeit, relatively unchanging training. However, due to work/travel schedules and other set-backs I really didn’t plan any overload training. I was mostly doing my best at not losing strength. A feat much easier to accomplish than gaining strength. At the present time, I believe that one can get away without doing week long deloads at fixed intervals (every 4th week or so) if training is managed on a daily basis. However, by design, this set-up really doesn’t allow for overreaching as you would back off as soon as your trend declined for too long. 

It was my goal in my latest training cycle to not focus on daily HRV changes but instead evaluate weekly changes. My training, though still manipulated slightly on a day to day basis (particularly in week 4 of the cycle) was much more pre-planned than I had been doing previously. My training set-up was designed so that HRV would return to above baseline after each weekend.. which it did. The purpose of this was to be fresh for the beginning of each week and to avoid premature overreaching. A deload was planned following the last week of the cycle. 

Below is a screen shot of my HRV trend that includes interesting trend changes in response to different events/training. See my previous post here for a more extensive review of my 9 week training cycle. This post will focus primarily on the last 3 weeks of the trend (weeks 8, 9 and 10 of the cycle)

deloadtrendmarch2013

During week 6 and 7 of my trend HRV baseline reached peak values since the holidays. However, during weeks 8-9 HRV steadily decreases. In fact, in week 9, HRV remains below baseline until the weekend. Typically my HRV will come back up after a recovery day on Wednesdays. The difference between weeks 6-7, 8-9, and 10 are volume and intensity related.

During weeks 6-7 my training volume reduced and my intensity increased only slightly. In week 6, it is reasonable to say that I reduced more stress than I added based on volume and intensity change and sRPE. In week 7 however, there are 2 sRPEs of 9 which marks the initial decent in the trend. During weeks 8-9, volume reduced only slightly but intensity increased to near maximal in week 8 and as close to maximal as I could get in week 9. In that 14 day period I performed 8 workouts of near maximal or at maximal intensity on my main barbell lifts.

It was also during these last two weeks of the training cycle that I experienced nagging pains, high levels of soreness etc.

Though weeks 8 and 9 are the most taxing, my sRPE doesn’t change all that much (primarily 8’s with a rare 9). This does not do a good job of reflecting the change in volume/intensity. Perhaps I need to re-evaluate my current method of rating workouts and tracking training load.

Week 10 is a deload week and HRV returns to peak levels. Soft tissue problems progressively resolve and I’m anxious to start a new cycle.

Wrap Up

HRV will likely decline during intensive training and return to baseline following a recovery period of reduced training loads. Perhaps focusing more on weekly changes in HRV as opposed to daily acute changes is more meaningful during overload periods; permitting a more controllable approach to overreaching.

References

Baumert, M. et al. (2006) Changes in heart rate variability of athletes during a training camp. Biomed Tech, 51(4): 201-4.

Buchheit, M., et al. (2004) Effects of increased training load on vagal-related indexes of heart rate variability: a novel sleep approach. American Journal of Physiology – Heart & Circulatory Physiology, doi:10.1152/ajpheart.00490.2004.

Iellamo, F., Pigozzi, F., Spataro, A., Lucini, D., & Pagani, M. (2004) T-wave and heart rate variability changes to assess training in world class athletes. Medicine & Science in Sports and Exercise, 36(8): 1342-1346.

Pichot, V., Busso, T., Roche, F., Gartet, M., Costes, F., Duverney, D., Lacour, J., & Barthelemy, J. (2002) Autonomic adaptations to intensive overload training periods: a laboratory study. Medicine & Science in Sports & Exercise, 34(10), 1660-1666.

Pichot, V., et al. (2000) Relation between heart rate variability and training load in middle-distance runners. Medicine & Science in Sport & Exercise, 32(10): 1729-36.

Reviewing HRV data after a 9 week training cycle

It’s been a quite a while since I can honestly say that I completed a successful training cycle with little interruption. After Christmas break I had a 9 week cycle tentatively planned out. As you’ll see, the plan changes due to unforeseen events, but training manipulations were made and the cycle was successful; resulting in some gym PR’s  which haven’t been made in a long time!

Set up was as follows;

Monday – Squat

Tuesday – Bench

Wednesday – Active Recovery (20-30 mins of light aerobic work, mobility, stretching, etc.)

Thursday – Deadlift

Friday – Incline Bench

Saturday – Off or Active Recovery

Sunday – Off

Weeks 1-4 were of moderate intensity (75-85%) and higher volume. An example of a typical workout from this phase would be 5×5, 6×4, etc. However on deadlift day’s I’d rarely perform sets with more than 3 reps. Weights were selected based on RPE and guided by previous session’s working sets. If you look at my trend closely however, you’ll see that week 4 was a lousy week and my workouts were adjusted accordingly (more below).

Weeks 5-7 were of higher intensity (85-90%) and moderate volume such as 3×4, 4×3, etc.

Week 8 consisted of 1-2 sets of 2 reps with a weight that was near but not quite maximal

Week 9 was test week where I worked up to as close to a 1RM as I could get safely (I train alone).

Essentially I was blocking my training up into an “accumulation” period, a “transmutation” period and a “realization” period. I use those terms loosely however.

Below is a screen shot of my HRV/sRPE trend from the last 3 months. The training cycle began on Jan. 7. This is following a period of detraining over the holidays that you can clearly see early in the trend.

JantoMarchtrend2013

Week 1 – Post-Christmas holidays and I’m detrained. I began lifting 3 day’s/week to let my body get back into the swing of training with plans of moving to 4/days week in week 3. Though the workouts aren’t very intense, I experience large drops in HRV in response to workouts. My body is clearly adapting to the re-initiation of training.

Week 2 – My body appears to have adapted well as I experience very few low HRV days. HRV peaks on the weekend after some rest.

Week 3 –Switch to 4/day week lifting schedule. I was surprised that I didn’t see some lower drops this week. HRV peaks again on the weekend after rest.

Week 4 – I miss a workout due to snow day. My HRV is low practically all week and the weights were feeling heavy. I decided not to push it and essentially deloaded with sRPE’s of 7. Below is a screen shot of my data as it appears when I export it to excel from ithlete from weeks 2-4.

*Regarding the comments section, I document some random stuff sometimes. This is simply because I plan to review that data at a later date to see if I notice any trends. For example I note when I have ZMA before bed to see how it effects sleep score and next morning HRV. I’ll try and make note of any changes in nutrition, etc. Since I keep a training log I only document brief details about workouts on ithlete. Keep in mind that the comments , Sleep score and sRPE are all referring to the PREVIOUS day/night. So for example, when you see an sRPE of 8, it was from the workout on the day before. Lastly, I work days/evenings working with athletes so I typically stay up a bit late and therefore wake up later in the morning.

CommentJan2013

Weeks 5-7 run smooth. Training goes well and HRV responds well as my trend actually increases a bit. HRV reaches its lowest point on a Saturday morning at the end of week 7. This was after a long day of work, a workout and a football skills practice I helped coach. This practice beat the hell out of me as I was shouting the whole time so that my kids could hear me over all of the other groups. I was exhausted at the end of the day so I expected a low score the next day.

Weeks 8-9 both go well. HRV drops much lower than I had expected in response to the higher intensities. In the past, heavy workouts with low volume typically don’t create such marked drops. In week 9, my final week with 1RM attempts, HRV doesn’t even come above baseline. I’m also feeling beat up at this point with a sore left pec, tight lateral hamstring on my right side and overall wear and tear. HRV peaks again every weekend after rest.

Week 10 is a deload week and you can see at the very end of the trend that HRV starts to climb back up.

Marchcomments

In my comments above from ithlete you can see when and where certain body parts start nagging, etc. It’s worth mentioning again (as I’ve mentioned this in previous posts), any time I spend time with my family (particularly my nieces and nephews) that I don’t see too often, my HRV is always high the next day.

The results of the training cycle – (all raw, vid’s of some of these in last post and on youtube page)

Squat – 540

–          11lbs shy of my Competition PR of 551 from back in 2010. I’m pretty confident I could’ve hit this if I had a spotter. I made this lift in a relatively relaxed state. Not a true 1RM.

Narrow Grip Floor Press with Pause – 385

–          Due to left pec soreness I decided to test with a narrow grip floor press instead of bench press. This was probably a stupid idea. I’m glad I didn’t hurt it even more. This was a floor press PR. Pec’s already feeling better now.

Deadlift – 565

–          This went up pretty easy. I opted to not go heavier because I’ve had back issues in the past as I’ve discussed several times in previous posts. I did not want to push it just in case. Again, not a true PR (which is 600), but it’s been a while since I’ve deadlifted this heavy due to injury.

Incline Bench – 350

–          I was pretty happy with this since I don’t always include this lift in my training.

My bodyweight throughout this cycle was around 235lb.

I’m moving to Alabama real soon to get started on some HRV research at Auburn. I expect that this will affect my training. I’m hopeful however that the move will be a smooth transition and that I can continue on without too much issue. Unlikely though.