Effect of Competitive Status and Experience on Heart Rate Variability Profiles in Collegiate Sprint-Swimmers

Here’s a new paper from my time at Bama. A practical summary follows the link and abstract below.

Link to free full text:
Context:

When first getting started with tracking HRV in athletes, the inter-individual variation in trend characteristics can be confusing. Some athletes will display very high values and others will show lower values. Likewise, some will show quite stable values while others display substantial day-to-day variation. Naturally, the following question arises: why do some athletes have higher and more stable values than others?

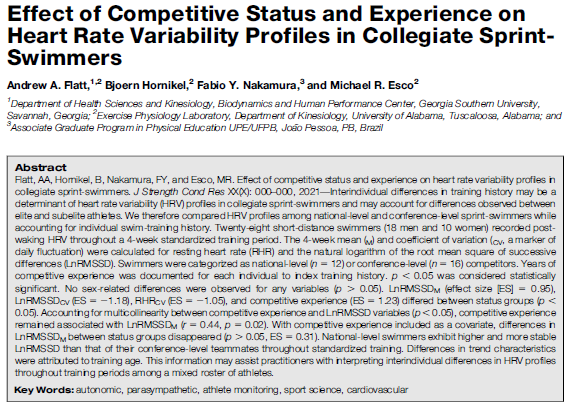
Collegiate swim rosters typically include a mixed roster of athletes (males and females with a broad range of experience and skill). In this investigation we compared HRV trend characteristics between the national-level (including 6 Olympians) and conference-level sprint-swimmers throughout 4 weeks of standardized preparatory training. We also obtained details of individual training history.

The main findings were that national-level swimmers had higher and more stable HRV (higher mean LnRMSSD, lower LnRMSSD coefficient of variation) than their conference-level teammates. Differences in trend characteristics were attributable to a greater history of training and competing among the national-level swimmers (i.e., greater training age).
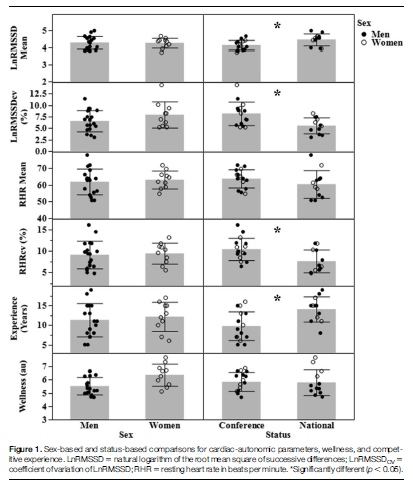
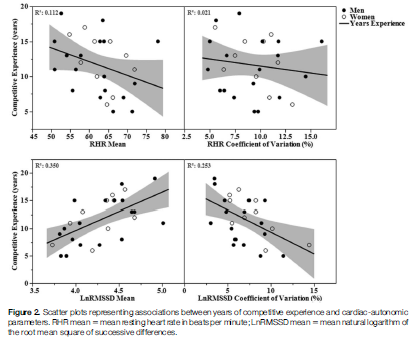
Whether these findings can be explained by greater aerobic fitness (we don’t think so), greater familiarity with training (possibly), or chronic physiological adaptations (possibly) among the higher-level swimmers is unclear.

The findings may be of some practical use for coaches when interpreted with previous work (see links below). For example, preliminary expectations with HRV monitoring should be that higher-level swimmers will display higher and more stable values throughout training and vice-versa for lower-level athletes. This may be interpreted to mean that the higher-level athletes could tolerate greater loads or that the lower-level athletes may need reduced loads. However, it is unclear if these training modifications would offer any performance/adaptation advantage. In addition, a higher-level athlete showing lower and less-stable values may be cause for concern (fatigue, stress, detraining, etc. depending on context). Whereas a lower-level athlete displaying higher and more stable values is likely adapting well to the training.

We’ve previously assessed how overload and tapering impact HRV in sprint-swimmers here.

We’ve previously assessed associations between subjective indicators of recovery and daily HRV in sprint-swimmers here.

Ultrashort Versus Criterion Heart Rate Variability Among International-Level Girls’ Field Hockey Players

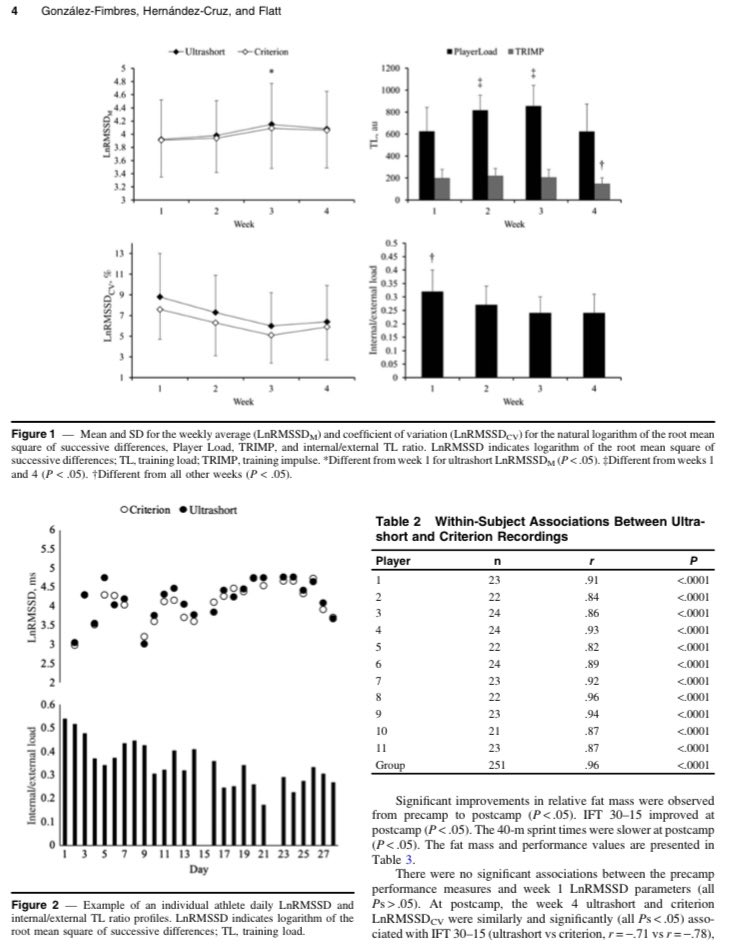
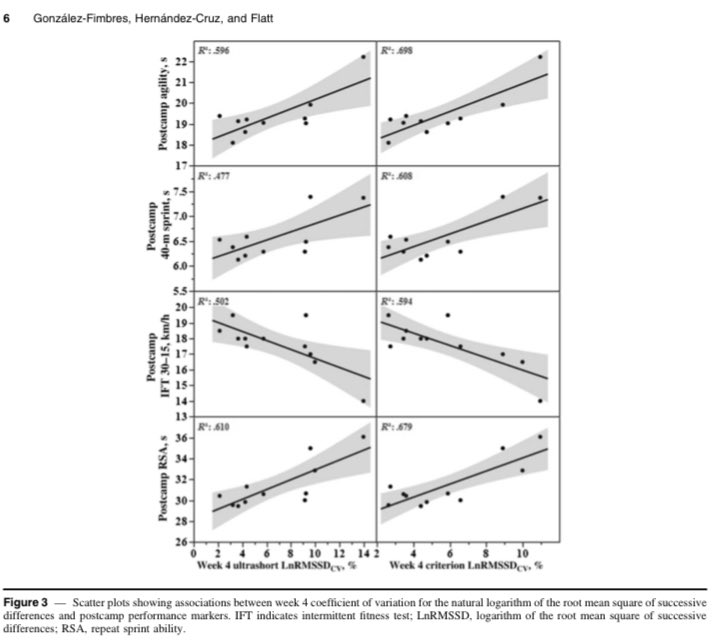
Here’s our latest study comparing 1 min vs 5 min HRV throughout a 4-week camp in international-level girls field hockey players. Values were highly correlated, showed similar responses to load, & similar associations with fitness. Practically same insight, 80% less time. Thanks to Drs. Gonzalez-Fimbres and Hernandez-Cruz for the collaboration.

Link to full free text below:

Image
Image

Heart Rate Variability in College Football Players throughout Preseason Camp in the Heat

Here’s a quick look at our latest study examining cardiac-autonomic responses to preseason camp in the heat among college football players. The free full text can be accessed here: Heart rate variability in college football players throughout preseason camp in the heat IJSM

Intensive training periods tend to increase RHR and decrease HRV, reflecting stress and fatigue. However, adaptations to heat exposure (e.g., plasma volume expansion) tend to have the opposite effects. So we wanted to see what happens when players were exposed to both intense training and intense heat stress during preseason camp.

Despite increases in perceived fatigue throughout the 2-week period, RHR and HRV reflected responses consistent with heat acclimation.

HRV initially decreased in linemen, then peaked after a day of rest. Non-linemen faired a little better with smaller decrements in perceived fatigue and more frequent day-to-day improvements in RHR and HRV.

These results indicate that heart rate parameters and perceived fatigue are independent markers of training status, and that desirable cardiovascular adaptations can occur in the presence of soreness and fatigue.

This is especially important for tech companies who try to infer recovery status from HRV alone. As HRV improved throughout camp, an app’s algorithm would report to coaches that players are well-recovered. Given that no player feels well-recovered during preseason camp in the heat, the technology suddenly loses credibility for being wrong and will likely be dismissed.

This is unfortunate because the heart rate parameters are likely reflecting important adaptations that may indicate better tolerance to training in the heat, a reduced exercising heart rate, and improved fitness. Thus, I encourage users to ignore “recovery” scores and interpret the data in appropriate context.

ABSTRACT 

We aimed to characterize cardiac-autonomic responses to a 13-day preseason camp in the heat among an American college football team. Players were categorized as linemen (n=10) and non-linemen (n=18). RHR, natural logarithm of the root-mean square of successive differences multiplied by twenty (LnRMSSD), and subjective wellbeing (LnWellness) were acquired daily. Effect sizes±90% confidence interval showed that for linemen, LnRMSSD decreased (moderate) on day 2 (71.2±10.4) and increased (moderate) on day 12 (87.1±11.2) relative to day 1 (77.9±11.2) while RHR decreased (small–moderate) on days 6, 7, and 12 (67.7±9.3–70.4±5.5 b∙min-1) relative to day 1 (77.1±10.1 b∙min-1). For non-linemen, LnRMSSD increased (small–large) on days 3–5, 7, 12, and 13 (83.4±6.8–87.6±8.5) relative to day 1 (80.0±6.5) while RHR decreased (small–large) on days 3–9, 12, and 13 (62.1±5.2–67.9±8.1 b∙min-1) relative to day 1 (70.8±6.2 b∙min-1). Decrements in LnWellness were observed on days 4–10 and 13 for linemen (moderate) and on days 6–9, 12, and 13 for non-linemen (small–moderate). Despite reductions in LnWellness, cardiac-autonomic parameters demonstrated responses consistent with heat-acclimation, which possibly attenuated fatigue-related decrements.

Revisiting 60-s HRV recordings vs. Criterion in athletes

I’ve recently had the pleasure of peer-reviewing a few very well-written and carried out studies investigating duration requirements for stabilization preceding HRV recordings by different research groups. I look forward to seeing the published versions as the quality of the papers was very high.

In reviewing these papers it prompted me to reconsider what we all have been using as the criterion period. My colleagues and I have published 5 papers using a 5-min R-R sample preceded by a 5-min ‘stabilization’ period (10 min total duration) as the criterion (as has other groups), which is in line with traditional procedures. But I think we failed to address an important limitation of these procedures…

The issue is that the ‘traditional procedures’ were not devised for the purposes of establishing LnRMSSD specifically (rather, they needed to accommodate spectral analysis), nor were they devised for reflecting fatigue and adaptation to training programs. Therefore, for these specific purposes, it can be argued that the traditional procedures may not be as relevant, or at the very least, calls into question whether the 5-10 min period following the 0-5 min stabilization is in fact a criterion within this context.

Some things to consider:

  • 10 min is a long time to lay or sit still, especially for athletes who struggle to go 30-sec without checking their iPhone (I don’t think anyone disputes this). Are they more relaxed and stable in this situation or are they growing impatient and restless?
  • Are ANS responses and adaptation to training best measured in a completely relaxed state, or perhaps in response to a mild stimulus such as orthostasis (sitting or standing) (previous thoughts on this here)?
  • Should we be as skeptical with the ‘criterion’ recordings as much as as we are with 60-s recordings? How do we know if one is better than the other in the context of monitoring athletes? There’s now numerous studies by different groups showing the usefulness of 60-s measures for reflecting training responses, associating with fitness, etc.
  • Perhaps the question shouldn’t be regarding the optimal duration of the recording but rather, what is the shortest, most convenient procedure possible that still provides meaningful training status information? I don’t think an athlete or coach cares if their 60 sec HRV isn’t the same as the criterion if it’s still providing useful information.
  • I’m doubtful we would have completed any longitudinal training studies where HRV recordings were >60 sec on a near-daily basis. In my experience, >60 sec measures are not feasible with teams. Therefore, it’s ~60 s or we don’t bother.
  • Should future research instead try to determine what are the best ways to perform a ~60 sec HRV measure to limit noise from confounding factors? How can we improve the validity and reliability of 60-sec measures? How long from food/fluid ingestion should we wait? Can we obtain this with PPG rather than HR straps? What is the best position to measure in? etc.

To be clear, I still think that research evaluating stabilization requirements and comparing to the ‘criterion’ is absolutely meaningful and an important starting point. This was not intended to be critical, but rather to open discussion on future research directions.


HRV and Wellness responses to overload and taper in sprint-swimmers

Here’s a brief overview of our latest study capturing daily HRV and wellness ratings throughout overload and tapering in collegiate sprint swimmers preceding a championships competition.

The majority of research in the area has primarily focused on endurance athletes. It’s been a goal of mine for a while now to examine HRV responses in athletes participating in anaerobic events such as short-distance swimming.

The athletes completed wellness questionnaires and recorded HRV daily via smartphone and validated pulse-wave finger sensor (seated position) after waking. The observation period lasted 6-weeks which included 1 week of baseline, 2 weeks of overload and a progressive 3-week taper. The overload was characterized by a substantial increase in training intensity while overall volume varied by up to only 20%. Of the group, 2 athletes went on to compete in the 2016 Olympic summer games.

Full text link:

HRV and psychometric responses to overload and taper in collegiate sprint-swimmers 

OBJECTIVES:

The purpose of this study was to evaluate cardiac-parasympathetic and psychometric responses to competition preparation in collegiate sprint-swimmers. Additionally, we aimed to determine the relationship between average vagal activity and its daily fluctuation during each training phase.

DESIGN:

Observational.

METHODS:

Ten Division-1 collegiate sprint-swimmers performed heart rate variability recordings (i.e., log transformed root mean square of successive RR intervals, lnRMSSD) and completed a brief wellness questionnaire with a smartphone application daily after waking. Mean values for psychometrics and lnRMSSD (lnRMSSDmean) as well as the coefficient of variation (lnRMSSDcv) were calculated from 1 week of baseline (BL) followed by 2 weeks of overload (OL) and 2 weeks of tapering (TP) leading up to a championship competition.

RESULTS:

Competition preparation resulted in improved race times (p<0.01). Moderate decreases in lnRMSSDmean, and Large to Very Large increases in lnRMSSDcv, perceived fatigue and soreness were observed during the OL and returned to BL levels or peaked during TP (p<0.05). Inverse correlations between lnRMSSDmean and lnRMSSDcv were Very Large at BL and OL (p<0.05) but only Moderate at TP (p>0.05).

CONCLUSIONS:

OL training is associated with a reduction and greater daily fluctuation in vagal activity compared with BL, concurrent with decrements in perceived fatigue and muscle soreness. These effects are reversed during TP where these values returned to baseline or peaked leading into successful competition. The strong inverse relationship between average vagal activity and its daily fluctuation weakened during TP.

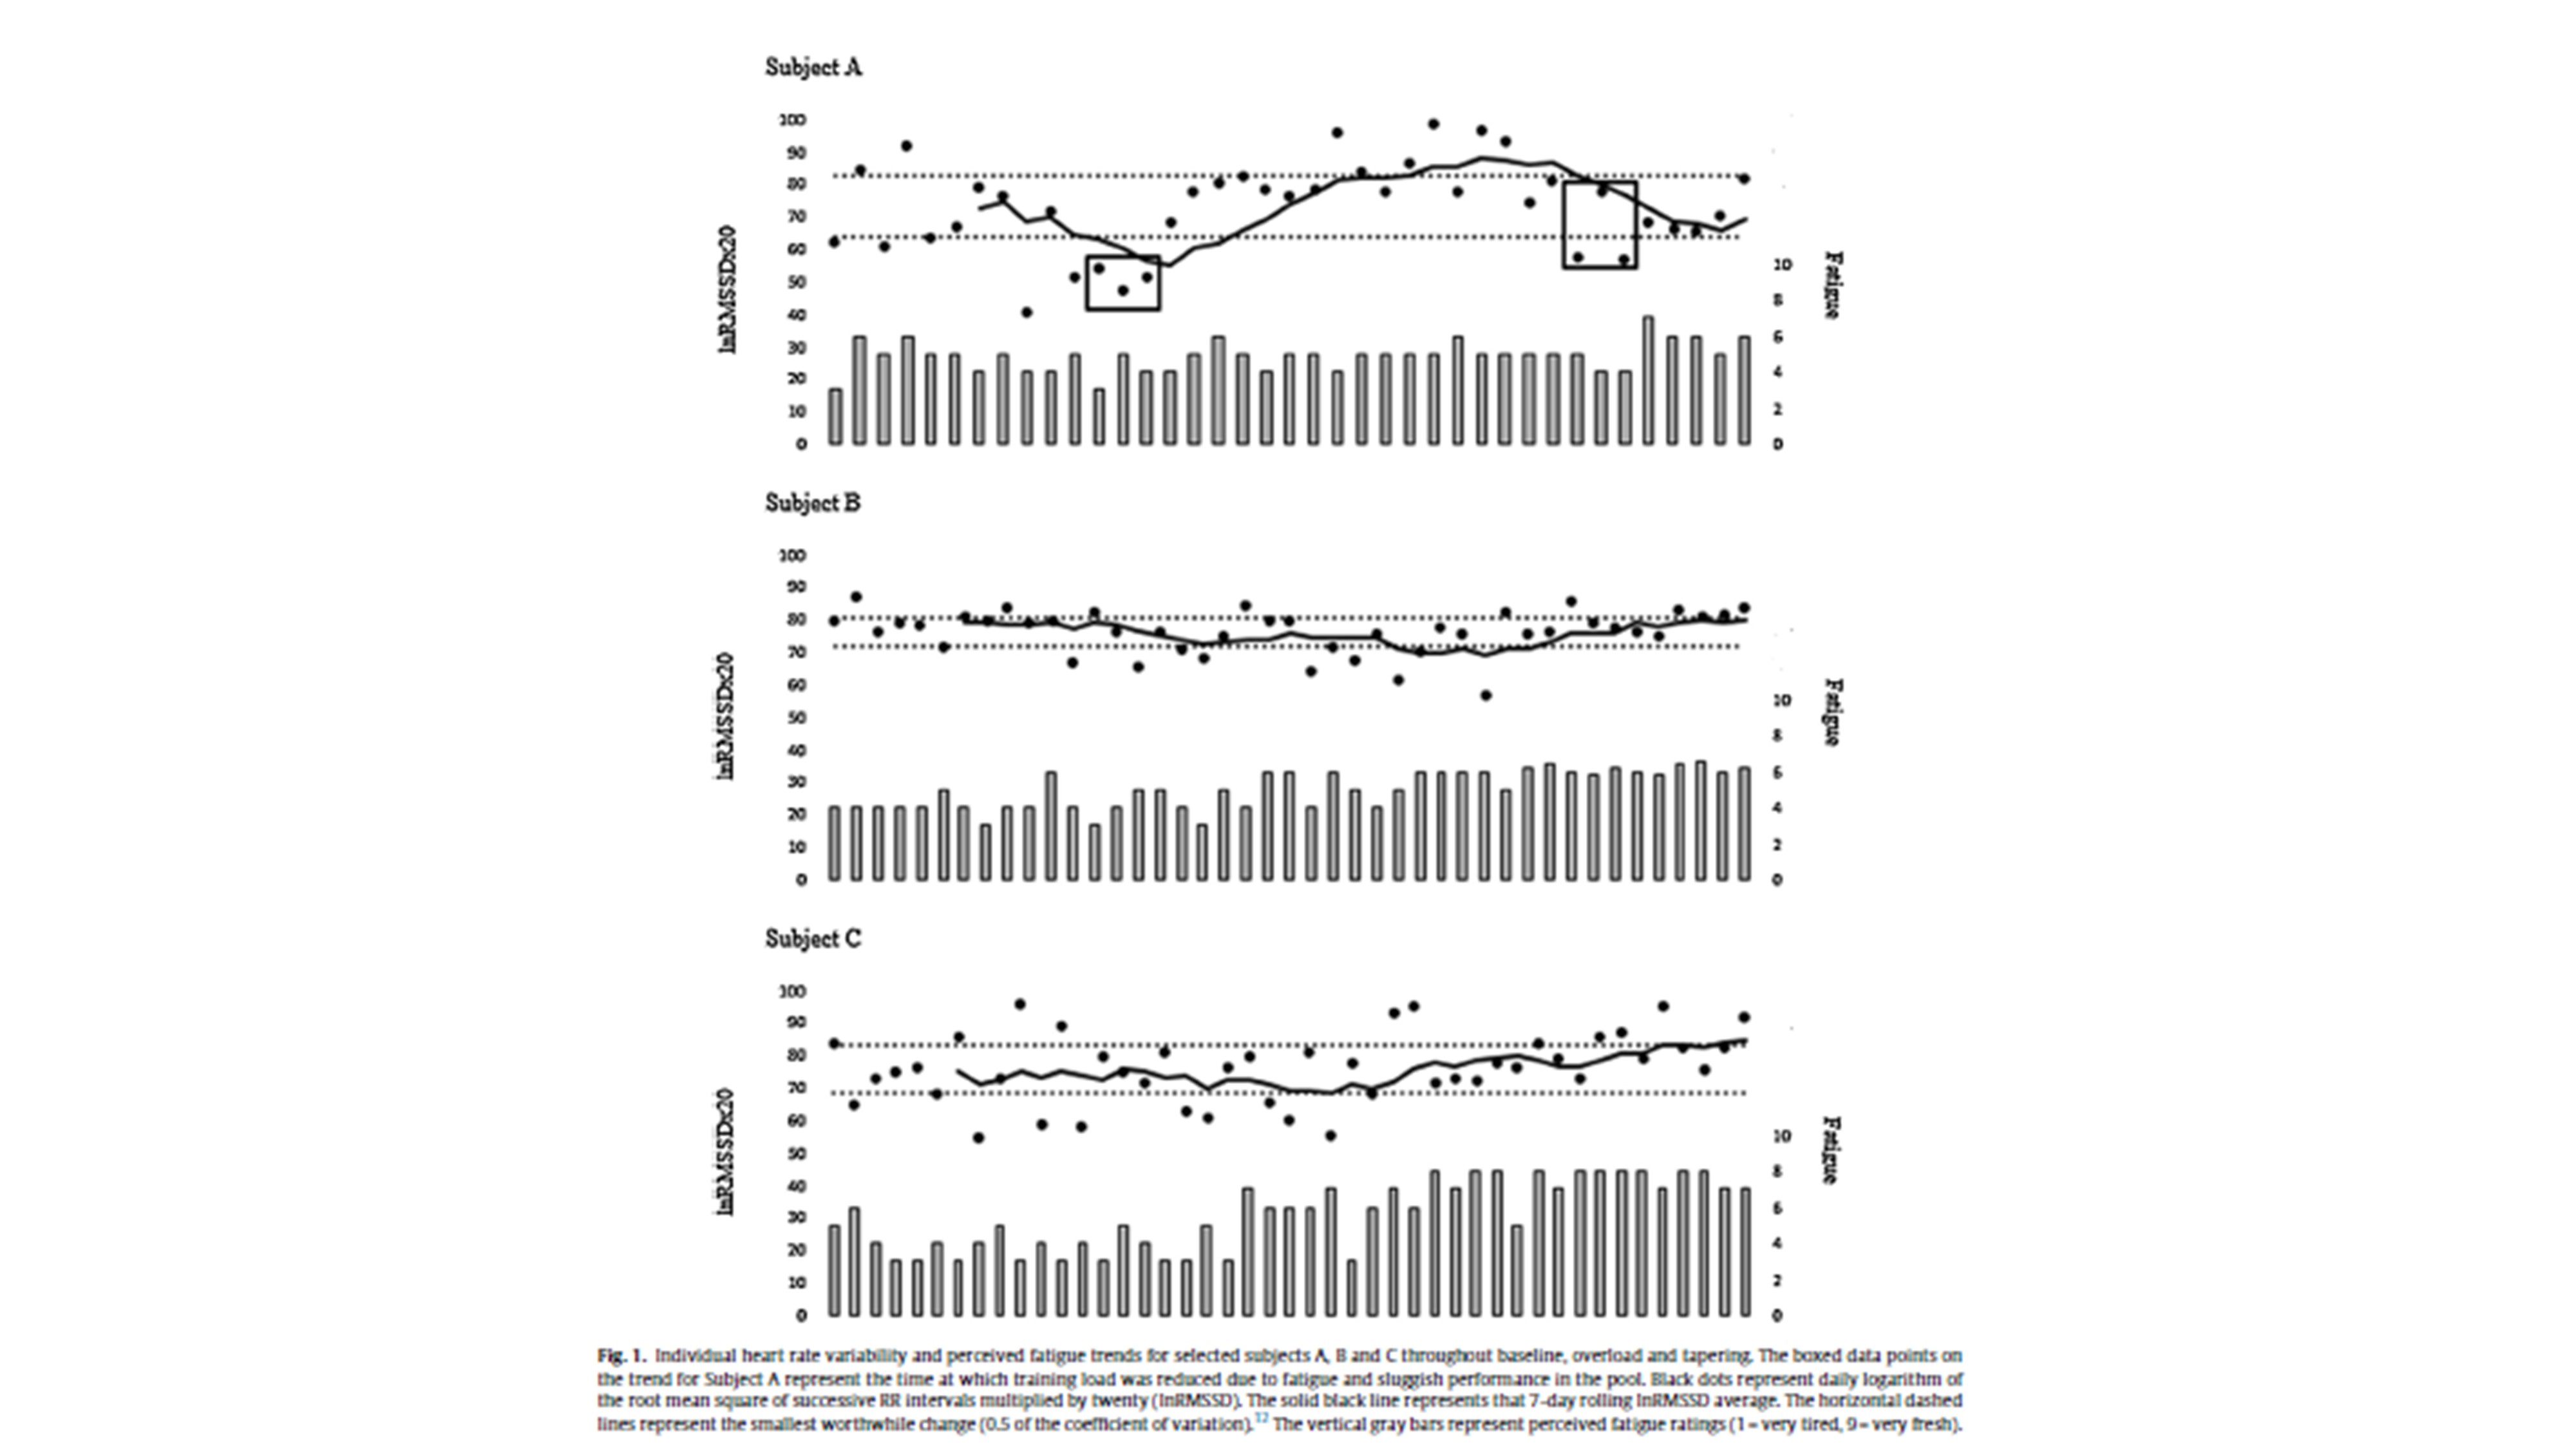
While group responses are certainly meaningful, the individual responses provide more meaningful information to practitioners. The figure below shows the individual trends from 3 athletes that exemplify 3 common training responses I’ve observed in a variety of athletes.

swim-trend-hrvtraining-blog

Subject B (middle) has the smallest CV at baseline and subsequently handles the overload very well, with minimal reductions in lnRMSSD. This indicates that Subject B is in great shape and could probably handle greater loads.

Subject C (bottom) displays what I would consider to be a very expected response to overloading. There is a considerable increase in daily lnRMSSD fluctuation (i.e., increased CV) and progressive but small decrease in the trend. I interpret this type of response to indicate that the loads are sufficient enough to provoke the fatigue/recovery process but not so high that HRV becomes suppressed. This is possibly indicative of a load/dose of training that is high but within the overall recovery capacity of the athlete.

Subject A (top) has the highest CV of the group at baseline and subsequently responds the least favorably to the overload. lnRMSSD pretty much crashes almost immediately and remains suppressed for several days (boxed data points). The coach pulled back on subject A due to high fatigue, reduced performance, decrements in pulse-rate recovery between sets, etc. The trend immediately improves until about 1-week out from competition at which point loads again were further reduced. Ultimately, this athlete improved upon previous best times at competition from that year, suggesting that the interventions were effective.

The main take-home would be that the typical response to intensified training includes a reduction and greater daily fluctuation in HRV, along with decrements in wellness scores. Athletes demonstrating different responses (i.e., minimal change in HRV trend or conversely chronic suppression of HRV) may be coping better or worse than expected. Coaches should then investigate and address factors contributing to the poor response.

Is a 60 second HRV measurement sufficient for valid assessment?

When I first moved out to Auburn to work on some HRV projects, I fully expected to jump right into some training study’s where we’d have team’s use an HRV app and start collecting data. I realized pretty quickly that these projects would probably have a hard time making it through the review process with a journal without validation of the field devices and the modified recording methodology that they utilize. Our first projects were therefore to cross-validate an HRV app that we could use with the athletes (link to study), assess the agreement between the ultra-short measurement duration typically used by app’s, and determine how long it took for an athlete to achieve a physiologically stable condition prior to recording HRV.

In our latest project we recorded 5 minute ECG’s from 23 collegiate male athletes (from the Soccer and Basketball teams) at rest and following a maximal graded exercise test. 5 minutes has been established as the standard for short-term HRV assessment. However, for lnRMSSD (the value used by the smart phone app’s like ithlete and BioForce), there is evidence suggesting that ultra-short measures (60 seconds or less) may be sufficient. From the 5 minute ECG’s, we randomly selected 10, 30 and 60 second segments to compare to the 5 minute lnRMSSD values. Essentially, we found that 60 second measures showed near perfect agreement with the 5 minute measures both at rest and post-exercise. However, as might be suspected, as measurement duration decreased (to 30 and 10 seconds), the agreement with the 5 minute measures also decreased. The key points of the study are listed below.

key points ultra short


Our results make us quite confident that 60 seconds is sufficient for valid HRV assessment in athletes. The full text for this study is linked below.

Ultra-Short-Term Heart Rate Variability Indexes at Rest and Post-Exercise in Athletes: Evaluating the Agreement with Accepted Recommendations

Our latest project, currently in the process of being submitted for review, assesses how long the pre-recording resting period needs to be for “stabilization” prior to an HRV recording. One of our primary goals is to determine the shortest valid recording methodology possible to enhance convenience of HRV monitoring in field settings. Next is to determine how this can be practically applied in the sports field for training management as there is very little longitudinal data from team sport settings reported in the literature. We hope that the shorter measurement protocols and validity of field tools will encourage more work in this area.

HRV Recording Methodology: Stabilization

Smart phone app’s and other field tools have made HRV data collection relatively simple and affordable for coaches, athletes and recreational lifters. However, the shortened recording methodology utilized by these devices requires validation. Standardized guidelines recommend that short-term (i.e., 5-min) HRV be collected under physiologically stable conditions (Task Force). Most HRV papers will allow for 5 minutes or greater of supine rest prior to HRV recording to allow for stabilization. However, this 5+ minute pre-recording period is not practical for daily monitoring. A 1 – 2 minute HRV recording period with a very minimal stabilization period used by many app’s is still too long for some individuals to comply with daily measures.

The issue of “stabilization” was the topic of our latest research project that we just presented at the ACSM Annual Meeting in Orlando this past weekend. We looked at the time-course for stabilization of HRV across 5-min ECG segments (e.g., 0-5 min, 1-6 min, 2-7 min, 3-8 min, etc.)  in 12 endurance athletes (6 female) and 12 non-athletes (6 female). We included lnHFnu, lnLFnu, and lnRMSSD.

The figures from the poster are displayed below (Athletes on left)

Stab Poster title

stability figures


The full manuscript for this project (with a different methodological approach) is currently in review so I will not get into too much depth on the discussion of the results. However, it is quite clear that lnRMSSD demonstrates the most and earliest stability of the 3 HRV parameters. Therefore, for lnRMSSD assessment, a minimal stabilization period is likely a non-issue. When including spectral measures (e.g., HF, LF), a longer period for stabilization may be required, though lnHFnu was relatively stable in the athletic group in the current sample.