New Study: Monitoring weekly HRV in futsal players during the preseason

Here’s a quick look at our latest collaboration with Dr. Fabio Nakamura and colleagues, published in J Sport Sci: Sci Med Football. This paper nicely demonstrates the inter-individual variation in HRV responses to training in team sports. An interesting finding was the large negative relationship between the weekly mean of lnRMSSD and the weekly CV of lnRMSSD. Essentially, the athletes with higher HRV tended to show smaller daily fluctuations in HRV and vice versa. This is likely an effect of higher fitness, which we (and others) have touched on in previous studies.
ABSTRACT

This study aimed to compare the weekly natural log of the root-mean-square difference of successive normal inter-beat (RR) intervals (ln RMSSDWeekly) and its coefficient of variation (ln RMSSDCV) in response to 5 weeks of preseason training in professional male futsal players. A secondary aim was to assess the relationship between ln RMSSDWeekly and ln RMSSDCV. The ln RMSSD is a measure of cardiac–vagal activity, and ln RMSSDCV represents the perturbations of cardiac autonomic homeostasis, which may be useful for assessing how athletes are coping with training. Ten futsal players had their resting ln RMSSD recorded prior to the first daily training session on four out of approximately five regular training days·week−1. Session rating of perceived exertion (sRPE) was quantified for all training sessions. Despite weekly sRPE varying between 3455 ± 300 and 5243 ± 463 arbitrary units (a.u.), the group changes in ln RMSSDWeekly were rated as unclear (using magnitude-based inference), although large inter-individual variability in ln RMSSD responses was observed. The ln RMSSDCV in weeks 4 and 5 were likely lower than the previous weeks. A large and significant negative correlation (r = −0.53; CI 90%: −0.36; −0.67) was found between ln RMSSD and ln RMSSDCV. Therefore, monitoring individual ln RMSSD responses is suggested since large inter-individual variations may exist in response to futsal training. In addition, higher values of ln RMSSD are associated with lower oscillations of cardiac autonomic activity.

HRV futsal Fig 1

Full Text on Research Gate

New Podcast: Discussing Smartphone HRV Apps

I recently had a chance to sit down and discuss all things HRV monitoring with James Darley of the Historic Performance Podcast. There’s also a number of great interviews in the podcast archives worth checking out.

Topics discussed:

  • Background
  • Physiological basis for HRV as a recovery status metric
  • Preferred HRV parameter for athletes
  • HRV recording methodology (position, conditions, time of day, etc.)
  • Considerations for chosing the right HRV app for your situation
  • Recent research
  • Interpreting HRV data

Link to Podcast with show notes 

Show in Overcast App


New Study: Interpreting daily HRV changes in female soccer players

Here’s a quick look at our latest study published ahead of print in the Journal of Sports Medicine and Physical Fitness. Below is the abstract and some brief comments about the findings.

Full text link:

Interpreting daily heart rate variability changes in collegiate female soccer players

BACKGROUND: Heart rate variability (HRV) is an objective physiological marker that may be useful for monitoring training status in athletes. However, research aiming to interpret daily HRV changes in female athletes is limited. The objectives of this study were (1) to assess daily HRV (i.e., log-transformed root mean square of successive R-R interval differences, lnRMSSD) trends both as a team and intra-individually in response to varying training load (TL) and (2) to determine relationships between lnRMSSD fluctuation (coefficient of variation, lnRMSSDcv) and psychometric and fitness parameters in collegiate female soccer players (n=10).

METHODS: Ultra-short, Smartphone-derived lnRMSSD and psychometrics were evaluated daily throughout 2 consecutive weeks of high and low TL. After the training period, fitness parameters were assessed.

RESULTS: When compared to baseline, reductions in lnRMSSD ranged from unclear to very likely moderate during the high TL week (effect size ± 90% confidence limits [ES ± 90% CL] = -0.21 ± 0.74 to -0.64 ± 0.78, respectively) while lnRMSSD reductions were unclear during the low TL week (ES ± 90% CL = -0.03 ± 0.73 to -0.35 ± 0.75, respectively). A large difference in TL between weeks was observed (ES ± 90% CL = 1.37 ± 0.80). Higher lnRMSSDcv was associated with greater perceived fatigue and lower fitness (r [upper and lower 90% CL] = -0.55 [-0.84, -0.003] large, -0.65 [-0.89, -0.15] large).

CONCLUSIONS: Athletes with lower fitness or higher perceived fatigue demonstrated greater reductions in lnRMSSD throughout training. This information can be useful when interpreting individual lnRMSSD responses throughout training for managing player fatigue.

The idea of evaluating relationships between the coefficient of variation of lnRMSSD  (lnRMSSDcv) with fitness parameters was inspired by a 2010 paper by Martin Buchheit et al. In that study,  greater lnRMSSDcv derived from post-submaximal exercise recordings negatively correlated with maximum aerobic speed in youth soccer players. We had similar findings in our current paper where we observed large negative relationships between lnRMSSDcv (derived from waking, ultra-short smartphone  recordings) and VO2max and Yo-Yo IRT-1.

Another objective of this study was to focus on individual HRV responses in addition to group responses (see figure below). An interesting observation we made was that greater lnRMSSDcv was also associated with higher perceived fatigue. This finding is in contrast to a recent case comparison study by Plews et al. that found a decreased lnRMSSDcv to be associated with non-functional overreaching in an elite triathlete. However, this can possibly be explained by the severity of fatigue. For example, the decreased lnRMSSDcv observed in the triathlete was accompanied with a chronically suppressed lnRMSSDmean. Thus, lnRMSSD decreased and did not periodically return to baseline.

In our current study, large decreases in lnRMSSD typically returned to baseline after 24-72 hours. Thus, loads were not so high that the athletes were unable to return to baseline. Therefore, it is possible that there may be a progression in one’s HRV trend leading from moderately fatigued to severely fatigued that is characterized first by a greater lnRMSSDcv (reflecting fatigue and recovery process) followed by chronic suppression of lnRMSSD with no rebounding to baseline (reduced lnRMSSDmean and reduced lnRMSSDcv). More on this to come.

Figure interpreting daily HRV

HRV monitoring for strength and power athletes

This article is a guest post for my colleague, Dr. Marco Altini’s website. Marco is the creator of the HRV4training app that enables HRV measures to be performed with no external hardware (e.g., HR strap), just the camera/flash of your smartphone and your finger tip. He has several archived articles pertaining to HRV measurement procedures and data analysis from compiled user data that are well worth checking out.

The intro is posted below. Follow the link to read the full article.

Intro

​A definitive training program or manual on how to improve a given physical performance quality in highly trained individuals of any sport does not exist. Nor will it ever. This is because of (at least) two important facts:

  1. High inter-individual variability exists in how individuals respond to a given program.
  2. The performance outcome of a training program is not solely dependent on the X’s and O’s of training (i.e., sets, reps, volume, intensity, work:rest, frequency, etc.) but also largely on non-training related factors that directly affect recovery and adaptation.

The closest we’ll get to such a definitive training approach, (in my opinion) may be autoregulatory training. This concept accepts the 2 facts listed above and attempts to vary training accordingly in attempt to optimize the acute training stimulus to match the individual’s current performance and coping ability.

Improvements in physical performance are the result of adhering to sound training principles rather than strict, standardized training templates. A thorough understanding of sound training principles enables good coaches and smart lifters to make necessary adjustments to a program when necessary to maintain continued progress. In other words, good coaches can adapt the training program to the athlete rather than making the athlete to try and adapt to the program. This is the not so subtle difference between facilitating adaptation and trying to force it.

The theme of this article is not about traditional training principles, but rather about recovery and adaptation concepts that when applied to the process of training, can help avoid set-backs and facilitate better decision-making with regards to managing your program. Given that this site is about HRV, naturally we’re going to focus on how daily, waking measures of HRV with your Smartphone may be useful in this context. For simplicity, we will focus on one HRV parameter called lnRMSSD which reflects cardiac-parasympathetic activity and is commonly used by most Smartphone applications. Drawing from research and real-life examples of how HRV responds to training and life-style factors, I hope to demonstrate how HRV can be used by individuals involved in resistance training-based sports/activities to help guide training.


Continue reading on the HRV4training site.

New Podcast Interview: HRV in Soccer

Last week I had pleasure of being interviewed on the Just Kickin’ It Podcast. In the interview we discuss HRV basics, implementation and interpretation with soccer teams, our recent research findings and future directions.

Thank you to Brian and Josh for having me on. I also encourage you to check out the podcast archives as there are some great interviews with other researchers and coaches (i.e., Dr. Mike Young, Dr. Tim Gabbett and Dr. Shawn Arent to name a few I’ve listened to), in addition to plenty of others that are on my list.

Enjoy and Merry Christmas.

https://soundcloud.com/just-kickin-it-pod/episode-35-andrew-flatt


Trend Changes versus Daily Changes

HRV fluctuates to a certain extent on a daily basis. I’ve seen athletes with coefficient of variations (CV, a marker of deviation from the weekly mean) as low as 2% to >15%. An athlete’s CV changes over time, which itself serves as what I believe to be, an important indication of training adaptation.  The CV is related to individual fitness level and training stress and possibly even performance potential. Measurement position will also affect the CV with lower CV’s observed in the supine position compared to standing.

Here’s an important lesson I’ve learned about interpreting HRV in athletes. A daily change in HRV can occur for a number of reasons, and may or may not have any meaningful impact on acute performance or “readiness”. Putting too much focus on an acute change in HRV without stepping back and observing the overall trend is a bit myopic. This isn’t to say that daily changes aren’t useful, just that a full appreciation of the training process, including the evolution of the trend in response to training will enable better analysis and therefore decision-making. This is because longitudinal changes in an athlete’s HRV trend do not occur for no reason. Increases, decreases, greater fluctuation, less fluctuation, when assessed over time, are all very meaningful.

Observe the screenshot below which details the last 6 months of a high level collegiate sprint-swimmers trend. The data pretty much interprets itself when you compare the changes in the trend to changes in training and life events.

6motrend

What can we observe from this?

  • Greater fluctuation and a decreasing trend during heavy training stress
  • Less fluctuation and an increasing trend during reduced training stress
  • Greater fluctuation and a decreasing trend during normal training with increased academic stress (preparing for and writing exams). Thanks to recent work from Bryan Mann, we know that this increase in non-training related stress may put athletes at greater risk of injury or illness.

I strongly believe that to use HRV effectively, you need to consider the changes in the trend, and not just the day to day stuff. When asked what HRV products are worthwhile or what do I think of App X or product Z, I always suggest that they invest in one that provides the best visualization of the data over time and includes other markers of training status (i.e., load, wellness, etc.). This enables more meaningful interpretation of the data and can therefore be more insightful and useful when determining the appropriate action to take with regards to training program adjustment.

New Study: Ultra-Short HRV is Sensitive to Training Effects in Team Sports Players

Here’s a quick look at a recent study of ours in press with the Journal of Sports Science and Medicine. We’ve shown previously that lnRMSSD can be validly assessed in 60-s from an isolated measure in a variety of athletes, but in this paper we demonstrate that 60-s measures are capable of tracking lnRMSSD changes in elite athletes. The full text is open access on the JSSM site.

Abstract
The aim of this study was to test the possibility of the ultra-short-term lnRMSSD (measured in 1-min post-1-min stabilization period) to detect training induced adaptations in futsal players. Twenty-four elite futsal players underwent HRV assessments pre- and post-three or four weeks preseason training. From the 10-min HRV recording period, lnRMSSD was analyzed in the following time segments: 1) from 0-5 min (i.e., stabilization period); 2) from 0-1 min; 1-2 min; 2-3 min; 3-4 min; 4-5 min and; 3) from 5-10 min (i.e., criterion period). The lnRMSSD was almost certainly higher (100/00/00) using the magnitude-based inference in all periods at the post- moment. The correlation between changes in ultra-short-term lnRMSSD (i.e., 0-1 min; 1-2 min; 2-3 min; 3-4 min; 4-5 min) and lnRMSSDCriterion ranged between 0.45 – 0.75, with the highest value (p = 0.75; 90% CI: 0.55 – 0.85) found between ultra-short-term lnRMDSSD at 1-2 min and lnRMSSDCriterion. In conclusion, lnRMSSD determined in a short period of 1-min is sensitive to training induced changes in futsal players (based on the very large correlation to the criterion measure), and can be used to track cardiac autonomic adaptations.

ultra short HRV sensitive to training effects

Thanks to Dr. Fabio Nakamura and his research group out of Brazil for inviting me to collaborate with them on this one. We have several more in production looking at daily HRV changes in response to training  in different teams and how Wellness and Fitness markers influence HRV responses.

Interpreting HRV Trends in Athletes: High Isn’t Always Good and Low Isn’t Always Bad

This article was written for the FreelapUSA site. The intro is posted below. You can follow the link for the full article. Thanks to Christopher Glaeser from Freelap for inviting my contribution as I’ve found this site to be a great resource.

Interpreting HRV Trends in Athletes: High Isn’t Always Good and Low Isn’t Always Bad

Heart rate variability (HRV) monitoring has become increasingly popular in both competitive and recreational sports and training environments due to the development of smartphone apps and other affordable field tools. Though the concept of HRV is relatively simple, its interpretation can be quite complex. As a result, considerable confusion surrounds HRV data interpretation. I believe much of this confusion can be attributed to the overly simplistic guidelines that have been promoted for the casual-end, non-expert user.

In the context of monitoring fatigue or training status in athletes, a common belief is that high HRV is good and low HRV is bad. Or, in terms of observing the overall trend, increasing HRV trends are good, indicative of positive adaptation or increases in fitness while decreasing trends are bad, indicative of fatigue accumulation or “overtraining” and performance decrements. In this article I address the common notions of both acute and longitudinal trend interpretation, and discuss why and when these interpretations may or may not be appropriate. We will briefly explore where these common interpretations or “rules” have come from within the literature, and then discuss some exceptions to these rules.

Continue reading article on FreelapUSA

Early changes in HRV relate to eventual fitness changes in collegiate soccer players

Numerous studies have shown that increases in fitness (e.g., VO2max, MAS, Yo-Yo, etc.) are associated with increased cardiac-parasympathetic activity among healthy, athletic and clinical populations. This is one of the reasons why aerobic exercise is considered to be cardio-protective, due to enhanced resting vagal-modulation.

However, there is considerable inter-individual variation in how a given individual responds to an exercise program. Following a standardized endurance training program, some individuals will show significant improvements in aerobic fitness while others will show only small improvements. Some may even regress. Why this occurs is likely due to a variety of potential variables including genetic factors, appropriateness of training stimulus and life style factors (i.e., sufficient recovery, sleep quality, nutrition, stress, etc.). Given the association between fitness changes and HRV changes, monitoring HRV throughout training may be useful in evaluating individual adaptation to a training program.

In our latest study (in press with JSCR), we wanted to determine if changes in HRV mid-way through a training program related to eventual changes in intermittent running performance in a collegiate female soccer team. It would be useful for coaches to be able to identify athletes who may not be coping well with training earlier on rather than waiting until post-testing to realize some athletes didn’t improve much. Coaches can then investigate the potential cause (i.e., fatigue, insufficient sleep, etc.) and intervene accordingly with modifications to training load or life style factors to get athletes back on track.

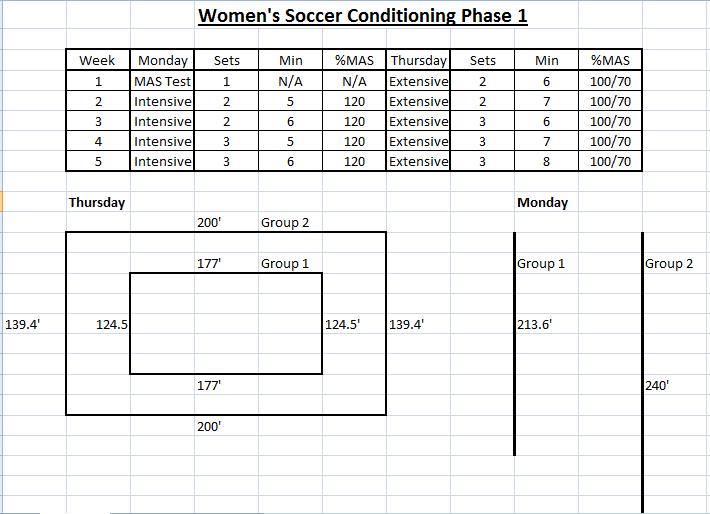
Before and after a 5-week conditioning program, we tested the team’s intermittent running capacity with the Yo-Yo IRT1. The conditioning program was designed based on the individuals max aerobic speed (MAS) adapted from Dan Baker’s MAS guide (link). Below is a screen shot of the conditioning program (unofficial).

MAS prog. Flatt

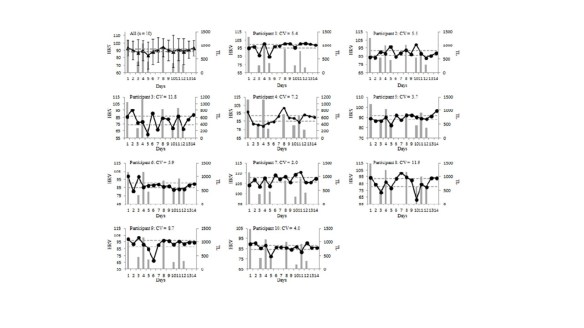
During week 1 and week 3, the athletes recorded their resting HRV each morning after waking with their smartphone using the ithlete HRV application which we validated previously (link). The weekly mean and weekly coefficient of variation (CV) for HRV and HR values were calculated. Change variables from week 1 to week 3 of HRV and HR (mean and CV) were correlated with the changes in Yo-Yo IRT1 performance from week 0 to week 5.

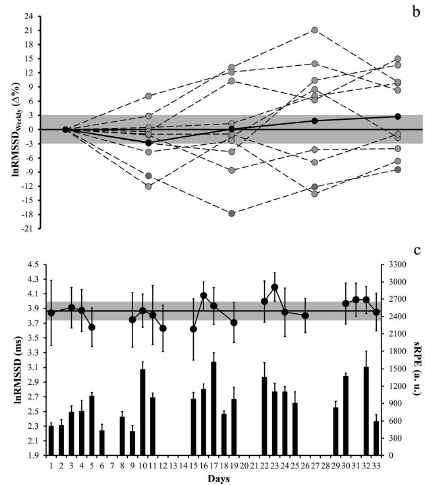
We found a very large correlation between the change in HRV CV at week 3 and Yo-Yo IRT1 changes at week 5 (r = -0.74). A large correlation was also found between the change in HRV mean and Yo-Yo IRT1 (r = 0.50). The HR measures showed only moderate correlations with the eventual changes in fitness.

Based on these results, it appears that monitoring HRV throughout training may be useful for evaluating how individual athletes are adapting to training. Specifically, we’re looking for two possible trend changes:

  1. A decrease in day-to-day fluctuation in HRV scores (i.e., decreased HRV CV)
  2. An increase in the weekly mean

Athletes demonstrating the opposite (increased CV and/or decreased weekly mean) may require a little closer attention from coaching personnel  to ensure that the training load is appropriate or that the athlete’s are taking care of the non-training factors that can be effecting their recovery.

Another novel finding of this study was that ultra-short HRV recordings (~1 min) derived from a smartphone app used by the athletes provided meaningful training status information. This indicates that HRV monitoring can be much more affordable and convenient than traditional approaches (i.e., longer recording periods with more expensive HRV tools).

I have plans for a much more elaborate post in the near future on the HRV CV. I’ll cover previous research, post some data and discuss how to interpret changes in the CV with appropriate context.

Link to current study: Evaluating individual training adaptation with Smartphone-derived heart rate variability in a collegiate female soccer team

HRV, Stress and Training Adaptation

Below is my HRV trend following my first year of working on my PhD. Training was held pretty much constant throughout this time period (lift 4x/week, moderate aerobic work 2-3x/week). Both my first and second semester were equally as busy, however my perception of stress and my HRV trend was much lower and higher, respectively,  in semester 2. The first few weeks of the first semester were so bad I was sick for over  a week with the flu, which rarely happens to me (occurring at the lowest dip, early in the trend).

SWCtrendphdyr1

From the trend above, we can see that I spent a lot of time below the smallest worthwhile change (SWC=0.5*CV) during the first semester. Over Christmas I didn’t fall below the SWC at all. In the second semester I experienced considerably less scores below the SWC. Once summer started, I experienced an immediate increase in scores.

Here’s the trend with perceived stress (purple columns, lower score = higher perceived stress). Clearly a big difference between first and second semester.

phdyr1hrvtrend

In reviewing this data, I’m reminded of a study that evaluated the relationship between perceived stress and fitness adaptations in healthy subjects (thanks to Fabio Nakamura for sharing this one with me a while back). Perceived stress levels measured before a training program showed moderate, negative correlations with improvements in fitness. See abstract below:

Ruuska, Pirita S., et al. “Self-rated mental stress and exercise training response in healthy subjects.” Frontiers in Physiology 3 (2012): 51.

Abstract

Purpose: Individual responses to aerobic training vary from almost none to a 40% increase in aerobic fitness in healthy subjects. We hypothesized that the baseline self-rated mental stress may influence to the training response.Methods: The study population included 44 healthy sedentary subjects (22 women) and 14 controls. The laboratory controlled training period was 2 weeks, including five sessions a week at an intensity of 75% of the maximum heart rate for 40 min/session. Self-rated mental stress was assessed by inquiry prior to the training period from 1 (low psychological resources and a lot of stressors in my life) to 10 (high psychological resources and no stressors in my life), respectively. Results: Mean peak oxygen uptake (VO2peak) increased from 34 ± 7 to 37 ± 7 ml kg−1 min−1 in training group (p < 0.001) and did not change in control group (from 34 ± 7 to 34 ± 7 ml kg−1 min−1). Among the training group, the self-rated stress at the baseline condition correlated with the change in fitness after training intervention, e.g., with the change in maximal power (r = 0.45, p = 0.002, W/kg) and with the change in VO2peak (r = 0.32, p = 0.039, ml kg−1 min−1). The self-rated stress at the baseline correlated with the change in fitness in both female and male, e.g., r = 0.44, p = 0.039 and r = 0.43, p = 0.045 for ΔW/kg in female and male, respectively. Conclusion: As a novel finding the baseline self-rated mental stress is associated with the individual training response among healthy females and males after highly controlled aerobic training intervention. The changes in fitness were very low or absent in the subjects who experience their psychological resources low and a lot of stressors in their life at the beginning of aerobic training intervention.

There’s also ample research demonstrating strong relationships between HRV and fitness adaptation in a variety of populations. This includes research showing that baseline HRV relates to fitness changes, in addition to the change in HRV from pre to post training relating well with changes in fitness.

We have 2 paper’s in review at the moment that show how early changes in HRV showed very large relationships with changes in fitness markers (lab and field measures) in team-sport athletes.

~50% (or more) of the variance in fitness adaptation is explained by genetics, so there’s not too much we can do about that. But the other things that explain smaller %variance in training adaptation should be managed. This includes the obvious: stress, sleep quality, nutrition, etc. which all tend to influence HRV as well.