Unknown's avatar

About hrvtraining

Researcher and Professor. Former athlete and coach.

Interpreting HRV Trends in Athletes: High Isn’t Always Good and Low Isn’t Always Bad

This article was written for the FreelapUSA site. The intro is posted below. You can follow the link for the full article. Thanks to Christopher Glaeser from Freelap for inviting my contribution as I’ve found this site to be a great resource.

Interpreting HRV Trends in Athletes: High Isn’t Always Good and Low Isn’t Always Bad

Heart rate variability (HRV) monitoring has become increasingly popular in both competitive and recreational sports and training environments due to the development of smartphone apps and other affordable field tools. Though the concept of HRV is relatively simple, its interpretation can be quite complex. As a result, considerable confusion surrounds HRV data interpretation. I believe much of this confusion can be attributed to the overly simplistic guidelines that have been promoted for the casual-end, non-expert user.

In the context of monitoring fatigue or training status in athletes, a common belief is that high HRV is good and low HRV is bad. Or, in terms of observing the overall trend, increasing HRV trends are good, indicative of positive adaptation or increases in fitness while decreasing trends are bad, indicative of fatigue accumulation or “overtraining” and performance decrements. In this article I address the common notions of both acute and longitudinal trend interpretation, and discuss why and when these interpretations may or may not be appropriate. We will briefly explore where these common interpretations or “rules” have come from within the literature, and then discuss some exceptions to these rules.

Continue reading article on FreelapUSA

Early changes in HRV relate to eventual fitness changes in collegiate soccer players

Numerous studies have shown that increases in fitness (e.g., VO2max, MAS, Yo-Yo, etc.) are associated with increased cardiac-parasympathetic activity among healthy, athletic and clinical populations. This is one of the reasons why aerobic exercise is considered to be cardio-protective, due to enhanced resting vagal-modulation.

However, there is considerable inter-individual variation in how a given individual responds to an exercise program. Following a standardized endurance training program, some individuals will show significant improvements in aerobic fitness while others will show only small improvements. Some may even regress. Why this occurs is likely due to a variety of potential variables including genetic factors, appropriateness of training stimulus and life style factors (i.e., sufficient recovery, sleep quality, nutrition, stress, etc.). Given the association between fitness changes and HRV changes, monitoring HRV throughout training may be useful in evaluating individual adaptation to a training program.

In our latest study (in press with JSCR), we wanted to determine if changes in HRV mid-way through a training program related to eventual changes in intermittent running performance in a collegiate female soccer team. It would be useful for coaches to be able to identify athletes who may not be coping well with training earlier on rather than waiting until post-testing to realize some athletes didn’t improve much. Coaches can then investigate the potential cause (i.e., fatigue, insufficient sleep, etc.) and intervene accordingly with modifications to training load or life style factors to get athletes back on track.

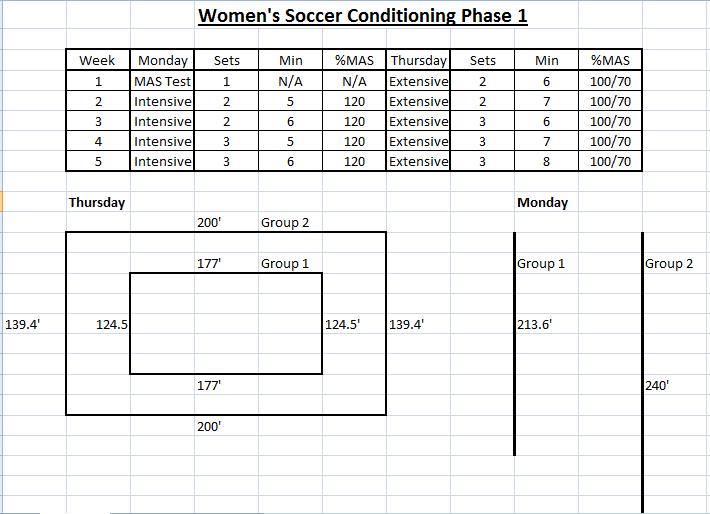
Before and after a 5-week conditioning program, we tested the team’s intermittent running capacity with the Yo-Yo IRT1. The conditioning program was designed based on the individuals max aerobic speed (MAS) adapted from Dan Baker’s MAS guide (link). Below is a screen shot of the conditioning program (unofficial).

MAS prog. Flatt

During week 1 and week 3, the athletes recorded their resting HRV each morning after waking with their smartphone using the ithlete HRV application which we validated previously (link). The weekly mean and weekly coefficient of variation (CV) for HRV and HR values were calculated. Change variables from week 1 to week 3 of HRV and HR (mean and CV) were correlated with the changes in Yo-Yo IRT1 performance from week 0 to week 5.

We found a very large correlation between the change in HRV CV at week 3 and Yo-Yo IRT1 changes at week 5 (r = -0.74). A large correlation was also found between the change in HRV mean and Yo-Yo IRT1 (r = 0.50). The HR measures showed only moderate correlations with the eventual changes in fitness.

Based on these results, it appears that monitoring HRV throughout training may be useful for evaluating how individual athletes are adapting to training. Specifically, we’re looking for two possible trend changes:

  1. A decrease in day-to-day fluctuation in HRV scores (i.e., decreased HRV CV)
  2. An increase in the weekly mean

Athletes demonstrating the opposite (increased CV and/or decreased weekly mean) may require a little closer attention from coaching personnel  to ensure that the training load is appropriate or that the athlete’s are taking care of the non-training factors that can be effecting their recovery.

Another novel finding of this study was that ultra-short HRV recordings (~1 min) derived from a smartphone app used by the athletes provided meaningful training status information. This indicates that HRV monitoring can be much more affordable and convenient than traditional approaches (i.e., longer recording periods with more expensive HRV tools).

I have plans for a much more elaborate post in the near future on the HRV CV. I’ll cover previous research, post some data and discuss how to interpret changes in the CV with appropriate context.

Link to current study: Evaluating individual training adaptation with Smartphone-derived heart rate variability in a collegiate female soccer team

New study: Assessing shortened field-based HRV data acquisition in team-sport athletes

Our latest study “Assessing shortened field-based heart rate variability data acquisition in team-sport athletes” is now available ahead of print in IJSPP.

This project was a collaboration with Dr. Fabio Nakamura, Lucas Pereira, Dr. Irineu Loturco and Dr. Rodrigo Ramirez-Campillo. We have several more papers in production, in review and in press, so stay tuned for those.

This study expands on previous work of ours (link, link) that  assessed the agreement between ultra-short (60 s) HRV measures with standard 5 minute measures (following a 5 min stabilization period). This study differs from our previous work in a few key areas:

1. We assessed HRV (LnRMSSD) in the seated position here versus the supine position previously. Having to accommodate to the seated position may take longer than the supine position due to the vertical positioning and extra stress on the heart. Additionally, the seated position has been suggested in recent review papers to be the preferred position for athlete monitoring. Therefore, investigation into the time-course for HRV stabilization (i.e., how long must we wait to achieve a stable R-R signal), in addition to the agreement between ultra-short measures and the criterion (5 min post 5 min stabilization) segment from seated measures is required.

2. This study also evaluated the ratio between LnRMSSD and the R-R interval (LnRMSSD:R-R). Previous work has shown that highly fit athletes can demonstrate “parasympathetic saturation” which is characterized by a decrease in HRV despite very low resting heart rates. Daniel Plews et al. describe this phenomenon in their recent review paper: “The underlying mechanism is likely the saturation of acetylcholine receptors at the myocyte level: a heightened vagal tone may give rise to sustained parasympathetic control of the sinus node, which may eliminate respiratory heart modulation and reduce
HRV.”

3. In our previous studies we used an ECG for HRV analysis which is considered the gold standard, though not very practical for routine monitoring. In this study we used the Polar RS800,  a field tool heart rate monitor system that is more commonly used in practical settings.

4. Lastly, this study included elite level athletes whereas our previous work included collegiate athletes.

Our results show that the first 5 min LnRMSSD value (stabilization period) was not different than the criterion segment (mins 5-10). Additionally, we found that each isolated minute from the stabilization period (i.e., min 0-1, 1-2, 2-3, etc.) showed good agree with the criterion. Therefore, when 5 minute measures cannot be obtained due to time constraints or for compliance reasons, 60 s measures appear suitable for valid assessment, in agreement with our previous investigations.

In our next paper (in press) we assess if ultra-short LnRMSSD measures are sensitive to training effects in elite athletes.

Abstract
Purpose: The aims of this study was to compare the LnRMSSD and the LnRMSSD:RR values obtained during a 5-min stabilization period with the subsequent 5-min criterion period and to determine the time course for LnRMSSD and LnRMSSD:RR stabilization at 1-min analysis in elite team-sport athletes. Methods: Thirty-five elite futsal players (23.9 ± 4.5 years; 174.2 ± 4.0 cm; 74.0 ± 7.5 kg; 1576.2 ± 396.3 m in the YoYo test level 1), took part in this study. The RR interval recordings were obtained using a portable heart rate monitor continuously for 10-min in the seated position. The two dependent variables analyzed were the LnRMSSD and the LnRMSSD:RR. To calculate the magnitude of the differences between time periods, the effect size (ES) analysis was conducted. To assess the levels of agreement the intra-class correlation coefficient (ICC) and the Bland-Altman plots were used. Results: TheLnRMSSD and LnRMSSD:RR values obtained during the stabilization period (i.e., 0-5-min) presented very large to near perfect ICCs with the values obtained during the criterion period (i.e., 5-10-min), with trivial ES. In the ultra-short-term analysis (i.e., 1-min segments) the data showed slightly less accurate results, but only trivial to small differences with very large to near perfect ICCs were found. Conclusion: To conclude, LnRMSSD and LnRMSSD:RR can be recorded in 5-min without traditional stabilization periods under resting conditions in team-sport athletes. The ultra-short-term analysis (i.e., 1-min) also revealed acceptable levels of agreement with the criterion.

HRV, Stress and Training Adaptation

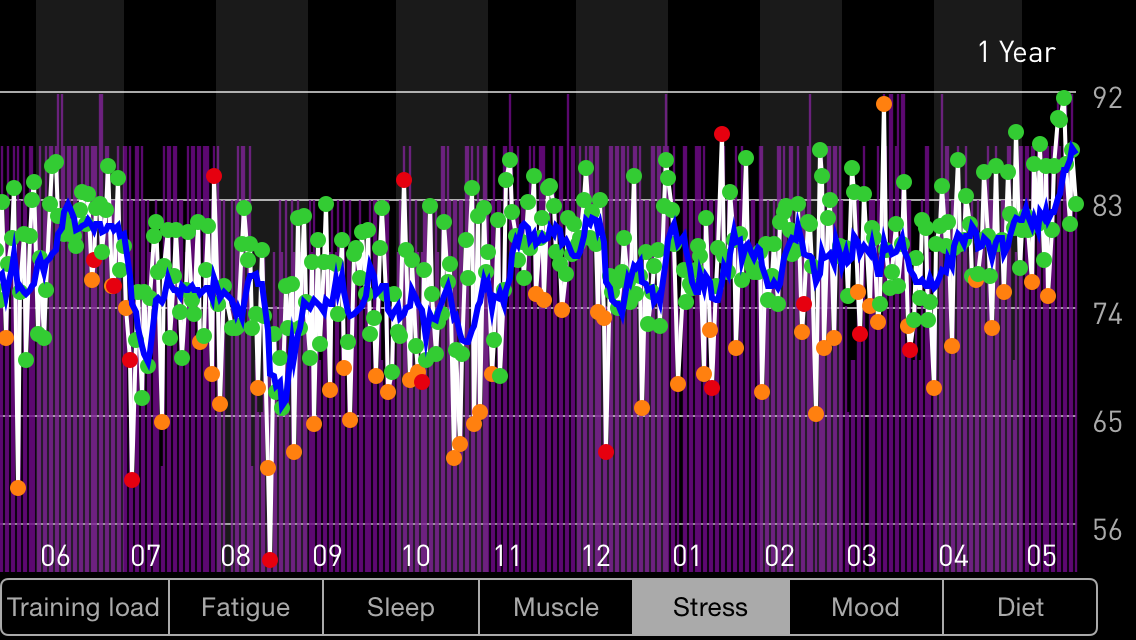
Below is my HRV trend following my first year of working on my PhD. Training was held pretty much constant throughout this time period (lift 4x/week, moderate aerobic work 2-3x/week). Both my first and second semester were equally as busy, however my perception of stress and my HRV trend was much lower and higher, respectively,  in semester 2. The first few weeks of the first semester were so bad I was sick for over  a week with the flu, which rarely happens to me (occurring at the lowest dip, early in the trend).

SWCtrendphdyr1

From the trend above, we can see that I spent a lot of time below the smallest worthwhile change (SWC=0.5*CV) during the first semester. Over Christmas I didn’t fall below the SWC at all. In the second semester I experienced considerably less scores below the SWC. Once summer started, I experienced an immediate increase in scores.

Here’s the trend with perceived stress (purple columns, lower score = higher perceived stress). Clearly a big difference between first and second semester.

phdyr1hrvtrend

In reviewing this data, I’m reminded of a study that evaluated the relationship between perceived stress and fitness adaptations in healthy subjects (thanks to Fabio Nakamura for sharing this one with me a while back). Perceived stress levels measured before a training program showed moderate, negative correlations with improvements in fitness. See abstract below:

Ruuska, Pirita S., et al. “Self-rated mental stress and exercise training response in healthy subjects.” Frontiers in Physiology 3 (2012): 51.

Abstract

Purpose: Individual responses to aerobic training vary from almost none to a 40% increase in aerobic fitness in healthy subjects. We hypothesized that the baseline self-rated mental stress may influence to the training response.Methods: The study population included 44 healthy sedentary subjects (22 women) and 14 controls. The laboratory controlled training period was 2 weeks, including five sessions a week at an intensity of 75% of the maximum heart rate for 40 min/session. Self-rated mental stress was assessed by inquiry prior to the training period from 1 (low psychological resources and a lot of stressors in my life) to 10 (high psychological resources and no stressors in my life), respectively. Results: Mean peak oxygen uptake (VO2peak) increased from 34 ± 7 to 37 ± 7 ml kg−1 min−1 in training group (p < 0.001) and did not change in control group (from 34 ± 7 to 34 ± 7 ml kg−1 min−1). Among the training group, the self-rated stress at the baseline condition correlated with the change in fitness after training intervention, e.g., with the change in maximal power (r = 0.45, p = 0.002, W/kg) and with the change in VO2peak (r = 0.32, p = 0.039, ml kg−1 min−1). The self-rated stress at the baseline correlated with the change in fitness in both female and male, e.g., r = 0.44, p = 0.039 and r = 0.43, p = 0.045 for ΔW/kg in female and male, respectively. Conclusion: As a novel finding the baseline self-rated mental stress is associated with the individual training response among healthy females and males after highly controlled aerobic training intervention. The changes in fitness were very low or absent in the subjects who experience their psychological resources low and a lot of stressors in their life at the beginning of aerobic training intervention.

There’s also ample research demonstrating strong relationships between HRV and fitness adaptation in a variety of populations. This includes research showing that baseline HRV relates to fitness changes, in addition to the change in HRV from pre to post training relating well with changes in fitness.

We have 2 paper’s in review at the moment that show how early changes in HRV showed very large relationships with changes in fitness markers (lab and field measures) in team-sport athletes.

~50% (or more) of the variance in fitness adaptation is explained by genetics, so there’s not too much we can do about that. But the other things that explain smaller %variance in training adaptation should be managed. This includes the obvious: stress, sleep quality, nutrition, etc. which all tend to influence HRV as well.

New Study: Smartphone-derived HRV and Training Load in a Female Soccer Team

About a week ago our latest study was published ahead of print in the International Journal of Sports Physiology and Performance.

Smartphone-derived Heart Rate Variability and Training Load in a Female Soccer Team.

This study was 4 years in the making and is without a doubt the biggest project we’ve done to date. Since my Masters in 2011/2012, it’s been my number one priority to study the usefulness of smartphone-derived HRV in a team of athletes. Every project we’ve done leading up to this was simply to enable us to conduct this study. This includes:

  • Validation of the smartphone app (link)
  • Evaluating the agreement between standard HRV recordings (5-min) and ultra-short recordings utilized by the app (60-s) (link)
  • Evaluating the time-course of HRV stabilization in athletes to determine the most convenient and valid recording methodology (link)
  • And some case study work (link)

Finally, in 2014 we implemented smartphone-HRV monitoring with a collegiate female soccer team throughout their spring season. The icing on the cake was having this paper accepted in IJSPP, a journal that I’ve been reading for years and that has published some very important papers that have advanced the practical application of HRV monitoring in field settings. The following will serve as a brief overview of the study.

Background:

  • Up until recently, HRV data has been traditionally recorded via ECG in the laboratory or with heart rate monitors in the field. The cost and time consuming nature of data collection and analysis procedures with these systems make them prohibitive in team-sport settings. Smartphone HRV technology is an affordable, user-friendly and new alternative that has yet to be studied in the field.
  • Smartphone apps utilize ultra-short recording procedures for HRV data acquisition (brief stabilization period followed by ~1 min recording). These modified recording procedures have not been studied in field settings and therefore it is unclear if meaningful training status information can be acquired with such short R-R interval recordings.
  • It is unclear which position is more preferable for HRV recording. Parasympathetic saturation has been observed in highly fit athletes in the supine position. This is when HRV is low despite very low resting heart rates. Therefore, HRV measures following an orthostatic stimulus (upright posture) have been proposed for use in highly fit athletes to counteract saturation effects. More research to determine which position is most suitable for team-sport athletes is required.
  • The weekly HRV mean and CV have been proposed to be more meaningful than isolated (once per week) measures. No previous research has assessed the evolution of mean and CV values in response to varying weekly training load in collegiate female team-sport athletes. Particularly from ultra-short, smartphone-derived measures.
  • Lastly, previous work has demonstrated that HRV measured between 3 and 5 days per week was sufficient for reflecting weekly mean values in endurance athletes. It is unclear if this applies to team-sport athletes engaged in regular strength and conditioning and soccer training. Reducing HRV measurement requirements to between 3 and 5 days per week would make HRV monitoring much more practical for coaches and athletes by reducing compliance demands.

Methods:

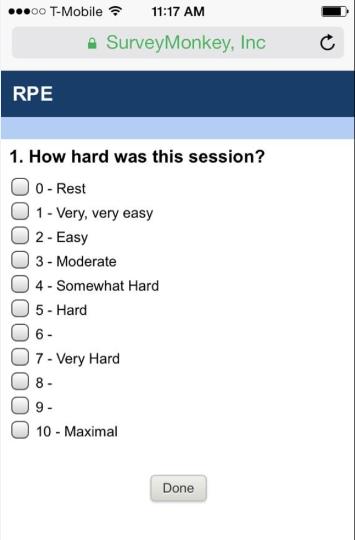
HRV data was recorded daily by the athletes after waking with the ithlete smartphone app over 3 weeks of moderate, high and low training load. As this study took place before the Wellness feature was added to the application, Wellness measures (fatigue, sleep, soreness, mood and stress) were acquired on M-W-F of each week via SurveyMonkey (see guide here).

photo 2

Training load was quantified via sRPE which was acquired between 15-30-min following all resistance training, conditioning and soccer practice sessions via email (SurveyMonkey) delivered to each athletes smartphone.

srpesm

The weekly mean and CV for HRV in both standing and supine measures was determined first intra-individually and then averaged as a group. This was also done for sRPE and Wellness values.

The supine and standing HRV mean and CV were then determined for M-W-F of each week for 3-day values and again for M-T-W-R-F for 5-day values. These were then compared to the 7-day values (the criterion).

Results

The 5 and 3-day measures within each week provided very good to near perfect intraclass correlations (ICCs ranging from 0.74 – 0.99) with typical errors ranging from 0.64 – 5.65 when compared with the 7-day criteria. The supine values demonstrated a smaller CV compared to standing. Therefore the supine measures over 3 and 5 days agreed strongly with the 7-day measures. The standing measures, particularly when measured across 3-days showed the lowest agreement.

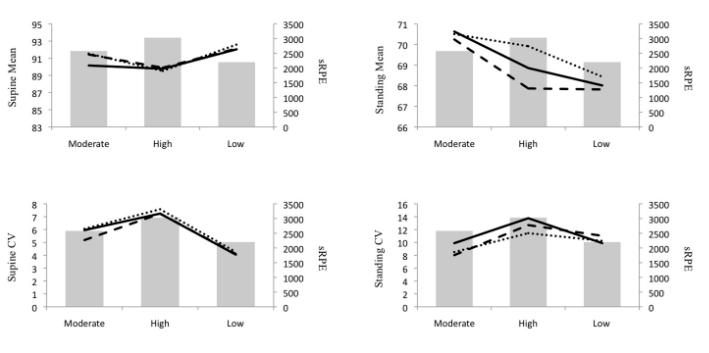
HRV mean values demonstrated small effects in response to varying TL where the lowest HRV mean occurred during the high load week and highest HRV mean occurred during the low load week. The CV values were highest during the high load week and lowest during the low load week. The CV was more sensitive to changes in TL than the mean values (moderate effects). Wellness values were lowest during the high load week (moderate effects) and similar between moderate and low load weeks (trivial effects).

ijspp fig

Brief Discussion and Practical Applications

This study demonstrated that the HRV CV showed greater sensitivity to the changes in TL over the 3-week training period. Essentially, during high load training, the athletes experienced greater fluctuation in their scores. Greater training stress caused greater homeostatic perturbation, reflected in their Wellness and HRV scores in both standing and supine positions. In contrast, during the low load week, there was less day-to-day fluctuation in HRV because there was less fatigue from training stress. Therefore, monitoring CV changes throughout training may provide insight regarding training adaptation. Athletes experiencing greater fatigue will likely show greater CV values. More experienced athletes and those with higher fitness will likely demonstrate lower CV values. When these athletes show increases in the CV, it may be due to non-training related stressors. Comparing individual values to the group average will help identify athletes who may require further follow-up to determine if training of lifestyle modification is necessary.

Quoting from the paper:

Smart-phone derived, ultra-short HRV is a potentially useful, objective internal training status marker to monitor the effects of training in female team-sport athletes as part of a comprehensive monitoring protocol. Coaches and physiologists are encouraged to evaluate the weekly CV in addition to the weekly mean when interpreting HRV trends throughout training as this marker was more sensitive to TL adjustment in the short-term (i.e, 3 weeks). An increase in lnRMSSDmean and decrease in lnRMSSDcv were observed when TL was reduced following moderate and high TL weeks and interpreted as a positive response. Both supine and standing CV measures related well to TL in this study but only supine CV values acceptably maintained this relationship when assessed in 5 and 3 days. Therefore, caution should be used when evaluating standing HRV when only 5 or 3-day measures are used. Seated measures may provide a lower CV relative to standing while still providing an upright posture to counteract possible saturation effects. This may make seated measures preferable to standing as a lower CV is more likely to be captured in fewer than 7 days as demonstrated with the supine values. Reducing HRV data collection to 5 days per week may alleviate compliance demands of athletes and thus may make HRV implementation a more practical monitoring tool among sports teams.

HRV stabilization in athletes: towards more convenient data acquisition

Our “stability” paper has recently been published in Clinical Physiology and Functional Imaging.

http://onlinelibrary.wiley.com/doi/10.1111/cpf.12233/abstract

ABSTRACT

Resting heart rate variability (HRV) is a potentially useful marker to consider for monitoring training status in athletes. However, traditional HRV data collection methodology requires a 5-min recording period preceded by a 5-min stabilization period. This lengthy process may limit HRV monitoring in the field due to time constraints and high compliance demands of athletes. Investigation into more practical methodology for HRV data acquisition is required. The aim of this study was to determine the time course for stabilization of ECG-derived lnRMSSD from traditional HRV recordings. Ten-minute supine ECG measures were obtained in ten male and ten female collegiate cross-country athletes. The first 5 min for each ECG was separately analysed in successive 1-min intervals as follows: minutes 0–1 (lnRMSSD0–1), 1–2 (lnRMSSD1–2), 2–3 (lnRMSSD2–3), 3–4 (lnRMSSD3–4) and 4–5 (lnRMSSD4–5). Each 1-min lnRMSSD segment was then sequentially compared to lnRMSSD of the 5- to 10-min ECG segment, which was considered the criterion (lnRMSSDCriterion). There were no significant differences between each 1-min lnRMSSD segment and lnRMSSDCriterion, and the effect sizes were considered trivial (ES ranged from 0·07 to 0·12). In addition, the ICC for each 1-min segment compared to the criterion was near perfect (ICC values ranged from 0·92 to 0·97). The limits of agreement between the prerecording values and lnRMSSDCriterion ranged from ±0·28 to ±0·45 ms. These results lend support to shorter, more convenient ECG recording procedures for lnRMSSD assessment in athletes by reducing the prerecording stabilization period to 1 min.

CPFI figure

In collaboration with Dr. Fabio Nakamura, we have a new paper currently in review that assesses the suitability of ultra-short (60-s) measures with minimal stabilization in elite team-sport athletes using the Polar system. We will also be assessing if these modified HRV recording procedures sufficiently reflect changes in fitness after a training program. Overall, shortened lnRMSSD recording procedures appear very promising. This will hopefully enhance the practicality of HRV monitoring among sports teams.

3 Month HRV and Wellness trends of two D1 Athletes

Below are the HRV trends of two NCAA D1 athletes from a team we’ve been working with over a 3 month period of virtually the same training schedule.

  • The vertical gray bars represent average perceived wellness (9 point scale)
  • The dotted horizontal black line is daily HRV
  • The thin black horizontal line is the 7-day rolling average
  • The dashed parallel horizontal lines represent the smallest worthwhile change (SWC = 0.5xCV)
  • HRV and wellness was acquired daily by the athletes with the ithlete finger sensor in the seated position.

Interestingly, these two athletes have very similar responses. About 3 weeks into the trend was a very intense training camp that was held out of state before Christmas. One athlete appears to experience more fatigue than the other with nearly the whole week below the SWC and a more pronounced decrease in wellness. HRV and wellness for both athletes improve over Christmas break. Following Christmas there is an intense 2-week training period followed by a reduction in training load. Both athletes frequently fall below the SWC here. Athlete A oscillates up and down while Athlete B remains below the SWC for nearly an entire week along with a decrease in wellness (middle of the trends). Both athletes trend upward after the intense training period and remain steady throughout the last half of the trend.

Athlete A

Athlete B

What makes things interesting is when athletes do not respond as expected. This is when the monitoring becomes invaluable as training intervention becomes extremely important.

Weekly endurance performance and HRV: A case study of a collegiate cross-country athlete

During the fall season of 2013, we collected daily HRV, perceived wellness, training load and performance (race times) from a collegiate cross country runner. We wrote this up as a case study and it was published this month in JASC.

Endurance performance relates to resting heart rate and its variability: A case study of a collegiate male cross-country athlete.

This post is a brief summary of our findings.

This athlete competed in 8 km races on Saturday’s throughout the 8 week competitive season for a total of 6 races. HRV data was collected daily with ithlete in a seated position after waking and elimination. Daily wellness questionnaires were delivered to the athletes e-mail via SurveyMonkey (thanks to Carl Valle for this idea) which asked the subject to rate his perceived sleep quality, muscle soreness, fatigue, mood and stress levels out of 5 for a total wellness score /25. Training sessions were quantified with sRPE and a basic TRIMP value. Race times were collected from the host University’s official final results.

Resting heart rate and HRV derived from the smartphone measures were averaged weekly. In addition the coefficient of variation (CV) was calculated for all weekly HR measures.

*Note: lnRMSSD (i.e., HRV) is modified by the application (lnRMSSDx20) which is how the data is presented.

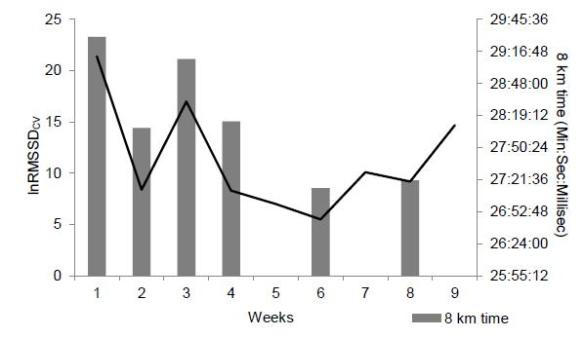
Our initial hypothesis was that the weekly mean of HRV would relate best to performance (8 km races) and that HRV would be a more sensitive measure than basic RHR. However, we found a near perfect correlation between the CV of HRV and performance (r = 0.92). When the CV was high for a given week, performance was worse (slower 8 km race time) whereas when the CV was lower, performance was better. A very similar, but slightly weaker correlation was found with the CV of resting heart rate. The figure below represents the relationship between weekly HRVcv and 8 km race times.
CV 8 km

The weekly mean related less well to performance. Quoting from the paper:

It has been suggested that as a result of tapering and the associated decrease in lnRMSSDmean, the relationship between lnRMSSDmean and performance is reversed (1). This may explain our finding of only a moderate correlation between lnRMSSDmean and 8 km race time and indicates that associations between endurance performance and lnRMSSDmean must be assessed within the context of the training phase and period (1).

The CV reflects the fluctuation in a metric (i.e., HRV/HR in this case) across the week. It’s been suggested that this marker represents the fatigue (decrease in HRV) and recovery process (return toward baseline). However, we also know that non-training related stressors may also effect daily changes. Therefore, a week with higher CV likely represents higher overall stress whereas a decrease in CV might indicate lower stress and/or better recovery, etc. This however should be taken into context with other indications of training status (e.g., TL, wellness, etc.) as a decreased CV has previously been associated with non-functional overreaching in an elite female triathlete in a case study by Daniel Plews and colleagues.

Two races were held at the same course, several weeks apart at the same time of day on Saturday. See excerpt from the paper below:

HRmean and lnRMSSDmean measures were similar on both occasions this season (lnRMSSDmean 73.8, HRmean 70.1 in week 3, lnRMSSDmean 72.6, HRmean 70.5 in week 8), however lnRMSSDcv and HRcv values in week 8 were nearly half of the values in week 3 (lnRMSSDcv 17, HRcv 12.7 in week 3, lnRMSSDcv 9.2, HRcv 6.5 in week 8). Most importantly, race time was 1:49 (min:sec) faster in week 8.  

Obviously, as this was only a case study of a single athlete across a single season, our results need to be interpreted with caution. However, if you’re monitoring HRV in yourself or of athletes, it would likely be best to include the CV in addition to the weekly mean when evaluating training status.

Looking ahead, we have 2 new manuscripts in review right now that evaluate the mean and CV of smartphone-derived HRV in a team of collegiate female soccer players as we make associations with training load changes and performance adaptations. These are very practical papers and the first, to my knowledge, that utilize smartphone applications with ultra-short measures (~1 min) for athlete monitoring.

 

HRV Monitoring Interview

Here’s a recent interview I had the pleasure of doing with Chris Beardsley of the Strength and Conditioning Research site:

http://www.strengthandconditioningresearch.com/2014/11/18/andrew-flatt-hrv/

We go over;

  • What HRV is and why we measure it
  • Practical and valid recording methodology as it pertains to shortened measurement duration and stabilization periods
  • HRV data interpretation for training and athlete monitoring
  • Practical recommendations

HRV Monitoring Podcast Episode

About a month ago I had  the pleasure of being interviewed on the Quantified Body Podcast. In the interview we touch on a variety of topics including:

  • HRV basics
  • HRV recording methodology (duration, position, etc.)
  • Smart Phone Apps
  • Data analysis and interpretation
  • Practical Applications
  • Monitoring athletes
  • Current research projects
  • Misconceptions and common errors
  • Future directions
  • Etc. 

You can listen to the podcast from the Quantified Body website here.

There is a list of the names and resources mentioned within the episode on the Quantified Body web page. 

Your feedback is welcome.