Below are the 4 abstracts and screen shots of our posters that we presented last weekend at the NSCA National Conference in Las Vegas. Many of these projects were in progress at the time of submission deadlines so 3/4 of the posters are actually just small parts of bigger projects. Following the title links will take you to the NSCA page where the posters can be viewed with zoom-in feature. There were plenty of good posters being presented all weekend so it would be worth your time to scroll through the website and view some of the other applied S&C research.
Michael R. Esco, Andrew A. Flatt, Robert L. Herron
PURPOSE: Heart rate variability (HRV) and heart rate recovery (HRR) are noninvasive indicators of cardiovascular autonomic control and are becoming popular for observing physiological changes associated exercise training and reflecting recovery status. Previous research suggests there is a relationship between HRV and HRR, though the extent of this link remains unclear. Additionally, measuring HRV in different body positions (supine vs. stand [SUP vs STA]) could further help explain the variance found in HRR following maximal exercise. The purpose of this study was to determine the extent of variation in HRR that could be accounted for by HRV measured in SUP and STA in collegiate-female athletes. METHODS: Twenty-three females (height = 1.65 ± 0.06 m, weight = 60.8 ± 6.3 kg, VO2peak = 44.6 ± 5.2 mL∙kg-1∙min-1) participated in this study. Each participant rested in the supine position while HRV was recorded during the last 5-min of a 10-min SUP period, followed by an additional 6-min STA period of which the final 5-min was analyzed. Participants completed a modified Bruce protocol treadmill exercise test to attain VO2peak. Immediately following the exercise test, each subject actively walked at 0.89 m∙s-1 and 1.5% grade, while recording HRR at the 1-min (HRR1) and 2-min recovery mark (HRR2). HRV values were expressed as root mean of successive R-R interval differences (RMSSD). Pearson-product moment correlations were used to investigate the relationships between the HRR and HRV variables. RESULTS: The STA and SUP values were as follows; RMSSD = 40.4 ± 26.3 ms and 87.17 ± 38.8 ms, respectively. Mean values for HRR1 was 28 ± 11 bpm and for HRR2 was 49 ± 11 bpm. Significant correlations were found for STA and HRR1 (r = 0.54, p = 0.008) and HRR2 (r = 0.48, p = 0.020). However, no significant relationships were found between SUP and HRR1 (r = 0.25, p = 0.255) or HRR2 (r = 0.38, p = 0.073). CONCLUSIONS: These results provide evidence that HRR is related to resting parasympathetic modulation when measured in the standing position within collegiate-female athletes. However, no association was found between HRR and supine HRV. Therefore, when compared to the resting supine measures, standing RMSSD appears to be more strongly related to post-exercise vagal return. PRACTICAL APPLICATIONS: HRV and HRR are two non-invasive markers of cardiovascular autonomic control. Both markers are becoming popular objective measures to consider when monitoring athletic recovery status and physiological adaptation to training. Practitioners need to be aware that resting HRV and HRR may be independently associated with cardiac-autonomic control. Therefore, these measures could reflect different responses to training. Additional research involving longitudinal investigation is needed.

Andrew A. Flatt, Michael R. Esco
PURPOSE: The purpose of this study was to determine if the mean value of 5 and 3 day per week heart rate variability (HRV) recordings from both supine and standing positions would accurately reflect the weekly mean value in collegiate female soccer players during spring season training. METHODS: Twelve female soccer players (height = 165.12 ± 5.32 cm; weight = 60.78 ± 6.00 kg; body fat = 27.3 ± 4.98; VO2max = 46.08 ± 3.14 ml.kg.-1min-1) recorded their HRV with a smart phone application, a wireless ECG receiver and a chest-strap transmitter each morning for a one week period during a spring season strength and conditioning cycle. The participants first performed a supine followed by a standing measurement after waking and elimination. Upon completion of their morning HRV recordings, each athlete manually exported their data to a spreadsheet via the smart phone application to the investigator for analysis. The HRV parameter that was evaluated by the application was the natural log transformed root mean square of successive normal-to-normal interval differences multiplied by 20 (lnRMSSDx20) from a 55-sec recording. Weekly (7 day) mean values were calculated for each athlete for the supine and standing lnRMSSDx20 measures. Thereafter, mean values were gathered from Monday through Friday for the 5 day recordings and Monday, Wednesday and Friday for the 3 day recordings. Agreement between the 5 and 3 day mean lnRMSSDx20 values and the weekly mean values were determined with repeated measures analysis of variance, intraclass correlations (ICC), and the method of Bland-Altman. RESULTS: The mean supine lnRMSSDx20 values were as follows: 89.39 +/- 6.84 for the 7 day; 89.72 +/- 7.00 for 5 day; 89.09 +/- 7.09 for 3 day. When compared to the 7 day supine measures, the 5 and 3 day values revealed ICC values of 0.99 and 0.96, respectively, with tight limits of agreement (2.53 above to 1.87 below the mean difference of 0.33 for 5 day and 3.50 above to 4.10 below the mean difference of -0.30 for 3 day). The mean standing lnRMSSDx20 values were as follows: 70.43 +/- 9.36 for 7 day; 70.65 +/- 9.17 for 5 day; 70.31 +/- 9.62 for 3 day. When compared to the 7 day standing measures, the 5 and 3 day values revealed ICC values of 0.98 and 0.96, respectively, with tight limits of agreement (4.25 above to 4.01 below to mean difference of 0.22 for 5 day and 5.31 above to 5.55 below the mean difference of -0.12 for 3 day). CONCLUSIONS: This study showed that lnRMSSDx20 recordings in supine and standing positions averaged over 5 and 3 days showed good agreement with the 7 day mean in female collegiate soccer players during a spring season microcycle. Future research should aim to determine if 5 and 3 day recordings reflect changes in training status over a chronic period. PRACTICAL APPLICATIONS: lnRMSSDx20 values averaged over a one week period can be used as an objective measure of training status in athletes. However, obtaining data with a daily frequency is challenging in the applied sports setting, limiting the potential usefulness of HRV as a monitoring tool among sports teams. It appears that 5 day or 3 day recordings of ultra-short-term lnRMSSDx20 obtained by athletes on their smart phone device will suitably reflect the 7 day mean. This greatly reduces compliance demands of athletes. Limiting data acquisition to 5 or 3 weekdays instead of over the entire 7 day period may enhance the practicality and convenience of HRV monitoring in field settings.

*This was taken from one week of what was actually 12 week training study. However, data collection was still ongoing during the time of submission deadlines for the conference. The full paper will include additional weeks with an overload and unloading period to see if the 3 and 5 days still reflect the 7 day mean. CV will also be included. This paper was inspired by recent work by Plews et al.
Andrew A. Flatt, Michael R. Esco
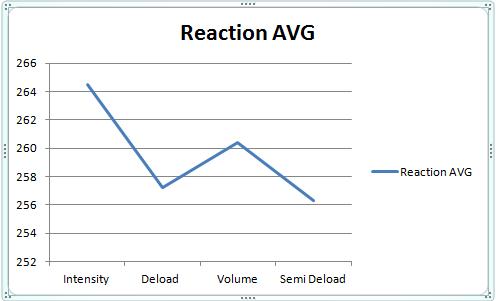
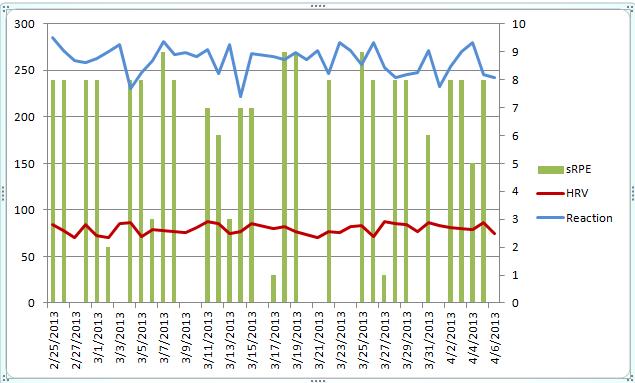
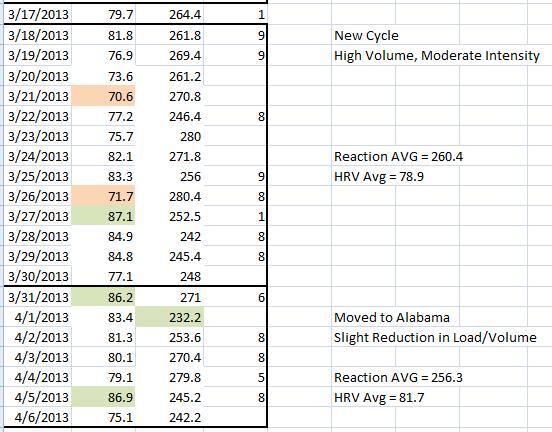
PURPOSE: This study aimed to determine if resting heart rate variability (HRV) values reflect previous day training load in a team of collegiate female soccer players after the first day of spring season strength and conditioning (S&C) training. METHODS: A team of female collegiate soccer players (n = 11; height = 165.16 ± 5.82 cm; weight = 60.26 ± 6.30 kg; body fat = 27.07 ± 5.39 %; VO2max = 46.76 ± 2.40 ml.kg.-1min-1) volunteered for this study. Supine and standing HRV values were acquired from each participant with a specialized smart phone application that utilized a wireless ECG receiver and a chest-strap transmitter. Supine and standing measures were obtained following waking and bladder emptying on the first day of spring S&C training (SUPRE and STPRE, respectively) and on the two days that followed (SUPOST1, STPOST1, respectively and SUPOST2, STPOST2, respectively). The natural log transformed root mean square of successive normal-to-normal interval differences multiplied by 20 (lnRMSSDx20) was the HRV parameter evaluated in this study. This value was automatically determined by the smart-phone application following a 55-sec recording which was manually exported to the investigator for analysis via e-mail. A one-way repeated measures analysis of variance (ANOVA) procedure with Tukey Post-hoc follow up tests were used to determine if there was any significant differences across the three days in lnRMSSDx20. RESULTS: The mean supine lnRMSSDx20 values for SUPRE, SUPOST1, SUPOST2 were 92.68 ± 8.19, 90.07 ± 7.58 and 90.62 ± 10.52, respectively. The supine values were not significantly different (p > 0.05). The mean standing lnRMSSDx20 values for STPRE, STPOST1, STPOST2 were 71.73 ± 10.07, 66.85 ± 10.10 and 70.78 ± 11.41, respectively. STPRE and STPOST2 were significantly higher compared to STPOST1 (p < 0.05). CONCLUSIONS: The results of this study show changes in mean standing lnRMSSDx20 following a heavy training day in collegiate female soccer players. However, there were no significant mean differences in the supine HRV values across the three days. Therefore, standing HRV measures may better reflect recovery status following a day of heavy training compared to HRV measured in the supine position. Future work should assess whether HRV measures can reflect training load over a longitudinal training program. PRACTICAL APPLICATIONS: Advancements in technology have made for more affordable and convenient tools for acquiring HRV data in the field for the purposes of monitoring fatigue and training status in athletes. Though HRV has been traditionally measured in a supine position, this data suggests that a standing position may be a more sensitive marker in response to heavy training load in female team-sport athletes. It should be noted that while mean HRV values provide the coach with a general indication of recovery status of the team, individual assessment should also be considered.

*As with the above abstract, the full paper will include multiple weeks of data looking at the acute responses to training in both standing and supine positions.
Michael R. Esco, Andrew A. Flatt
This paper was recently published and can be accessed here.

We actually had one more abstract to present in an oral presentation, but we ended up not being able to do it last minute and pulled it. Will save it for the future. The title was:
VALIDITY OF A SMART PHONE APPLICATION AND FINGER SENSOR FOR EVALUATING SUPINE AND STANDING HEART RATE VARIABILITY IN ATHLETES