During spring training camp, we found that Linemen demonstrate the greatest reductions in LnRMSSD at ~20 h post-training, followed by Mid-Skill and Skill, possibly reflecting inadequate cardiovascular recovery between consecutive-day sessions for the larger players, despite lower PlayerLoad values. (Full-text available here)
Our first follow-up study during the early part of the competitive season found the same position-based trend, where Linemen demonstrated the greatest reductions in LnRMSSD at ~20 h post-training, followed by Mid-Skill and Skill. However, the magnitude of the reductions in LnRMSSD during the in-season were smaller relative to spring camp. We speculate that both reduced PlayerLoad values (15-22% lower than spring camp) and adaptation to intense preseason training in the heat and humidity during the preceding weeks account for the smaller LnRMSSD reductions observed during the early part of the competitive season. (Full-text available here: Cardiac_Autonomic_Responses_to_In_Season_Training_Among_Division1_College_Football_Players)
Cardiac-Autonomic Responses to In-Season Training Among Division-1 College Football Players.
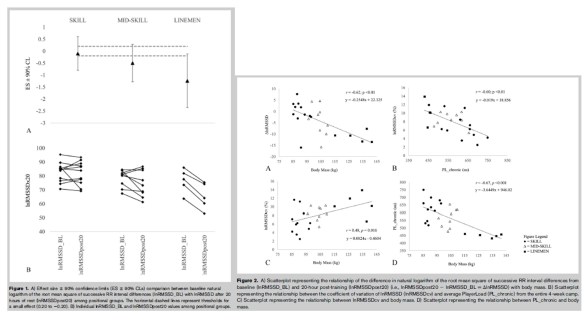
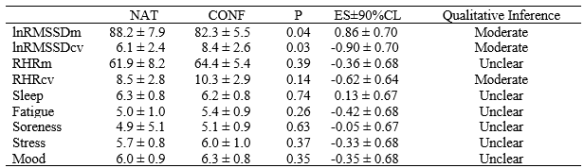
Despite having to endure a rigorous in-season training schedule, research evaluating daily physiological recovery status markers among American football players is limited. The purpose of this study was to determine if recovery of cardiac-autonomic activity to resting values occurs between consecutive-day, in-season training sessions among college football players. Subjects (n = 29) were divided into groups based on position: receivers and defensive backs (SKILL, n = 10); running backs, linebackers and tight-ends (MID-SKILL, n = 11) and linemen (LINEMEN, n = 8). Resting heart rate (RHR) and the natural logarithm of the root-mean square of successive differences multiplied by twenty (LnRMSSD) were acquired at rest in the seated position prior to Tuesday and Wednesday training sessions and repeated over three weeks during the first month of the competitive season. A position × time interaction was observed for LnRMSSD (p = 0.04), but not for RHR (p = 0.33). No differences in LnRMSSD between days was observed for SKILL (Tuesday = 82.8 ± 9.3, Wednesday = 81.9 ± 8.7, p > 0.05). Small reductions in LnRMSSD were observed for MID-SKILL (Tuesday = 79.2 ± 9.4, Wednesday = 76.2 ± 9.5, p < 0.05) and LINEMEN (Tuesday = 79.4 ± 10.5, Wednesday = 74.5 ± 11.5, p < 0.05). The individually averaged changes in LnRMSSD from Tuesday to Wednesday were related to PlayerLoad (r = 0.46, p = 0.02) and body mass (r = -0.39, p = 0.04). Cardiac-parasympathetic activity did not return to resting values for LINEMEN or MID-SKILL prior to the next training session. Larger reductions in LnRMSSD tended to occur in players with greater body mass despite having performed lower workloads, though some individual variability was observed. These findings may have implications for how coaches and support staff address training and recovery interventions for players demonstrating inadequate cardiovascular recovery between sessions.

Our next paper, currently in production, will feature HRV responses among positions throughout the entire preparatory and competitive season.