Making HRV More Practical For Athletes: Measurement Frequency?

Perhaps the biggest limitation with HRV monitoring in a team setting is obtaining and maintaining compliance from athletes. Daily HRV measurements can become monotonous, particularly for athletes who may not fully understand the value of the data. One question I’ve had in mind for a while now is; what is the minimal frequency of HRV measurements we can acquire that can still offer meaningful information regarding training status in athletes?

If you’ve read any of the research on HRV and athletes, you’d note that HRV is rarely measured daily. This is likely because having each subject report to the lab everyday to have their HRV measured on an ECG is impractical. However, with the advent of valid and reliable devices such as the Polar RS800, R-R intervals can be collected in the field making more frequent measurements a little more practical in the research setting. However, for the practitioner in the field, an even more practical, economical and user friendly device is desired. Thankfully smart phone app’s such as ithlete were created to accommodate this.

So now we have very affordable, very user friendly smart phone applications that can provide us with HRV data. The trick is getting the athletes to use them often enough so that we can use the data for monitoring purposes. Is it more of a reasonable expectation of our athletes to collect only one or two HRV measurements per week as opposed to every day? Will this provide us with enough information to draw meaningful interpretations from?

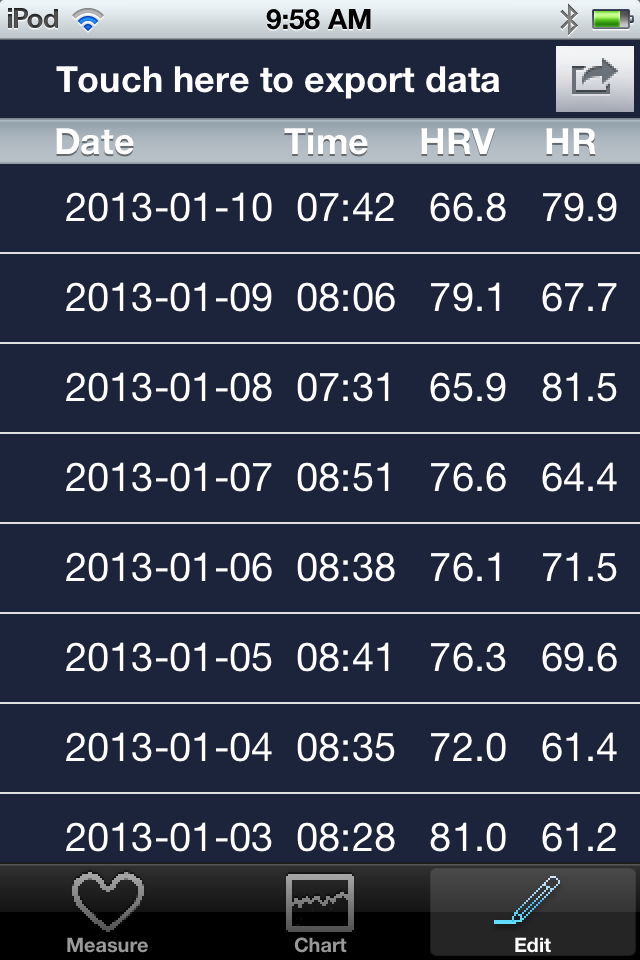
After giving it some thought, I decided to review some data over a 3 month period. With my own HRV data, I recreated trends in excel with; once per week, twice per week and daily measurements. The purpose of this is to see what these varying frequencies of measurement reveal in the trend. I’ve also included sleep score data which is graded 1-5 based on perceived quality and quantity after waking.

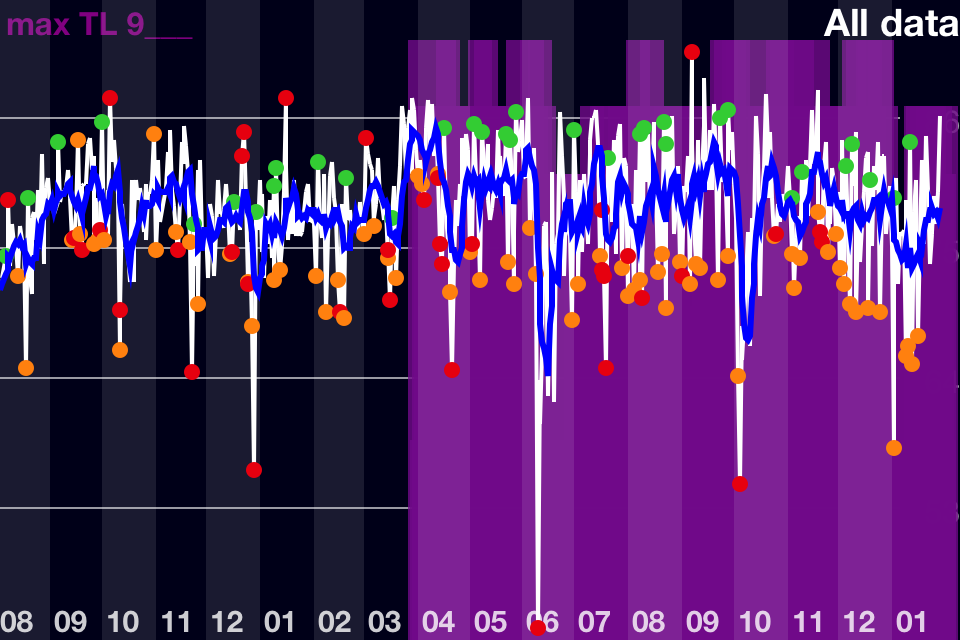
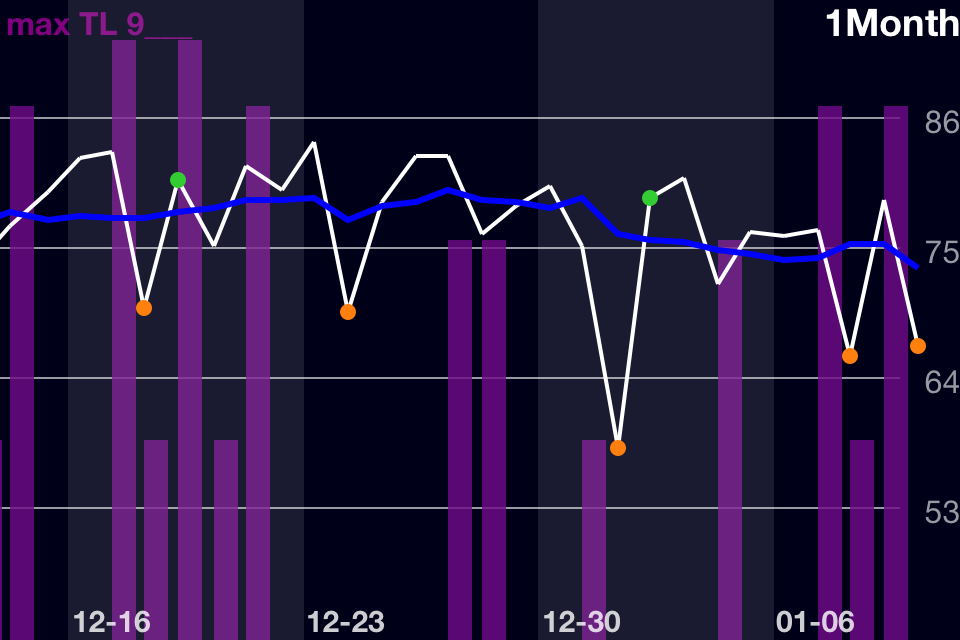
Daily Measurement 3 Month Trend

 daily3monthtrend


–          There is a period of time between the 4th week of December to the 2nd week of January that my HRV trend declines and I rarely see scores over 80. During this time (the Christmas Holidays)I was not lifting regularly and experienced some detraining.

–          Daily measurements allow for sRPE to be recorded providing the coach with a good indication of how the athlete is perceiving and responding to the workouts. Conversely, the sRPE allows the coach to see when the athlete is experiencing high stress in the absence of a high load training day.

–          Daily measurements allow the coach to see acute changes in HRV which can be important in planning or manipulating training.

–          It’s worth mentioning that my highest levels of strength were displayed over the last week of February and early March (early March not included). This is expected as I am nearing the end of my training cycle which has transitioned from moderate intensity/high volume to high intensity/low volume. Coincidentally, my HRV is reaching peak heights. I’m not entirely sure what to attribute these high scores to as I have been doing less aerobic work than normal. This may or may not have any meaning. Some vid’s are posted below from this “realization” phase. 


 Once Per Week HRV Measurement 3 Month Trend

 onceweekhrv

–          I chose Monday as the reference day because it is the day of the week furthest from training stress that can influence HRV. My goal was to find a day that gives me the best indication of baseline HRV. Since I train Mon-Fri and rest on weekends this left Sunday or Monday as the best options. I selected Monday over Sunday because Saturday nights can be social, late, etc. and therefore affect Sunday morning results.

–          This trend clearly shows my detraining period over the holidays.

–          Given that I adjust my training when necessary to avoid excessive fatigue accumulation, my baseline HRV is relatively consistent apart from the detraining period. Training is being well tolerated because I’m intentionally adjusting my training for that purpose. However, in a more pre-planned setting such as a collegiate weight room the result/trend would likely differ; particularly in a preparation phase (pre-season, early off-season, etc)

–          Coaches should be cautious when using weekly measurements due to potentially low scores caused by non training related stressors that may obscure interpretation. For example, if an athlete has a rough sleep Sunday night, HRV may be lower than usual Monday morning. This does not mean the athlete is fatigued or should have training loads reduced. Therefore, coaches need to keep tabs on performance and feedback from the comments section.  Clearly, weekly measurements have its limitations however it still may offer some value.

Twice Per Week HRV Measurements 3 Month Trend

twiceweek3monthhrv

–          I chose Monday and Saturday as my reference days because Monday represents HRV at rest while Saturday represents HRV after fatigue has been accumulated all week from training. This may provide some insight as to how stressful the training was based on Mon-Fri change in HRV. I am a bad example for this as I try and allow for HRV to reach baseline at least once during the week using Wednesday as an active recovery day. Data from an athlete involved in training, practices, class, etc. would have a different trend.

–          This trend allows for comparison of Sleep quality pre and post microcycle. In my trend, Mondays sleep scores never fall below 4 while there are 2’s and a 3 from Friday night’s sleep.

– As with the weekly measurement, this trend fails to capture major acute changes (highs and low’s).

Final Thoughts

Weekly measurements performed after a day or two of rest to allow for a true measure of baseline HRV can be useful in determining how an individual is coping with training on a week to week basis. However, I would urge you to be very cautious when interpreting trends as a low score caused by poor sleep or something other than training fatigue can provide a false sense of training response. This is where subjective measures, performance indications and regular communication is important.

Twice per week measurements might be the frequency which provides us with the most meaningful information from the least amount of data and therefore demand from the athlete. Seeing how HRV changes from pre to post training over a one week period likely provides much more meaningful information about training status verses weekly measures. It goes without saying that this needs to be manipulated according to the team’s training/practice/competition schedule. I used myself as the example today but most teams will not have Saturday and Sunday completely off from training.

Perhaps starting with weekly or twice weekly measurements is sufficient for getting athletes started and comfortable with the device. The goal should be to eventually get them to take daily measurements as this will provide more complete information including sRPE, daily sleep score and comments. The comments section is highly underrated and I intend to elaborate more on it’s value in a future post.

New HRV Research: Vol. 3

Here are 7 new studies pertaining to HRV and training.

New HRV Research: Vol. 1

New HRV Research: Vol. 2 

1.

Dupuy, O. et al. (2013) Night and postexercise cardiac autonomic control in functional overreaching. Applied Physiology, Nutrition, and Metabolism, 2013, 38(2): 200-208, 10.1139/apnm-2012-0203

ABSTRACT

The purpose of this study was to evaluate the effect of a 2-week overload period immediately followed by a 1-week taper period on the autonomic control of heart rate during the night or after exercise cessation. Eleven male endurance athletes increased their usual training volume by 100% for 2 weeks (overload) and decreased it by 50% for 1 week (taper). A maximal graded exercise test and a constant-speed test at 85% of peak treadmill speed, both followed by a 10-min passive recovery period, were performed at baseline and after each period. Heart rate variability was also measured during a 4-h period in the night or during estimated slow-wave sleep. All participants were considered to be overreached based on performance and physiological and psychological criteria. We found a decrease in cardiac parasympathetic control during slow-wave sleep (HFnu = 61.3% ± 11.7% vs 50.0% ± 10.1%, p < 0.05) but not during the 4-h period, as well as a faster heart rate recovery following the maximal graded exercise test (τ = 61.8 ± 14.5 s vs 54.7 ± 9.0 s, p < 0.05) but not after the constant-speed test, after the overload period. There was a return to baseline for both measures after the taper period. Other indices of cardiac autonomic control were not altered by the overload period. Care should be taken in selecting the most sensitive heart rate measures in the follow-up of athletes, because cardiac autonomic control is not affected uniformly by overload training.


2.

Vargas, W. et al. (2013) Higher mean blood pressure is associated with autonomic imbalance but not with endothelial dysfunction in young soccer players. American Journal of Hypertension, doi: 10.1093/ajh/hps034

BACKGROUND Blood pressure (BP) should be kept within a narrow range to allow adequate tissue perfusion. In particular, heart-rate variability (HRV) can be used to assess autonomic cardiovascular modulation, and flow-mediated dilation (FMD) can provide valuable information about the ability of the cardiovascular system to adapt to different pressures. Our objective in the study described here was to investigate the effect of a difference of 10mm Hg in mean arterial pressure (MAP) on endothelial function and autonomic balance in young and normotensive soccer players.

METHODS Twenty-nine young male soccer players (mean age 17.7 years) were divided into two groups according to their MAP (mm Hg): MAP-84 and MAP-94. The BP, FMD, HRV and maximum oxygen uptake (VO2max) of each group were measured.

RESULTS Systolic BP (SBP) and diastolic BP (DBP) were significantly higher (P < 0.0001 and P < 0.006, respectively) in the MAP-94 group. There were no differences in VO2max and endothelial function in the two groups (P < 0.7699). However, the standard deviation (SD) of normal RR intervals (SDNN) and the square root of the mean squared differences in successive RR intervals (RMSSD) were significantly lower in the MAP-94 than in the MAP-84 group (P < 0.0001 and P < 0.005, respectively). In the MAP-94 group, both the high-and low-frequency components were significantly (P< 0.001, P < 0.021, P < 0.017, respectively) lower in both absolute and normalized units, whereas the LF/HF ratio was significantly (P < 0.012) higher.

CONCLUSIONS Collectively, our findings indicate that in young soccer players, autonomic cardiovascular modulation is impaired when MAP is increased by 10mm Hg, even within an optimal range of BP and regardless of endothelial function and VO2max.


3.

Heydari, M., Boutcher & Boutcher. (2013) High-intensity intermittent exercise and cardiovascular and autonomic function. Clinical Autonomic Research, 23(1): 57-65

Objective

The effect of 12 weeks of high-intensity intermittent exercise (HIIE) on cardiac, vascular, and autonomic function of young males was examined.

Methods

Thirty-eight young men with a BMI of 28.7 ± 3.1 kg m−2 and age 24.9 ± 4.3 years were randomly assigned to either an HIIE or control group. The exercise group underwent HIIE three times per week, 20 min per session, for 12 weeks. Aerobic power and a range of cardiac, vascular, and autonomic measures were recorded before and after the exercise intervention.

Results

The exercise, compared to the control group, recorded a significant reduction in heart rate accompanied by an increase in stroke volume. For the exercise group forearm vasodilatory capacity was significantly enhanced, P < 0.05. Arterial stiffness, determined by pulse wave velocity and augmentation index, was also significantly improved, after the 12-week intervention. For the exercise group, heart period variability (low- and high-frequency power) and baroreceptor sensitivity were significantly increased.

Conclusion

High-intensity intermittent exercise induced significant cardiac, vascular, and autonomic improvements after 12 weeks of training.


4.

Souza, G., et al. (2013) Resting vagal control and resilience as predictors of cardiovascular allostasis in peacekeepers. Stress, doi:10.3109/10253890.2013.767326

Abstract

The body’s adaptive reaction to a stressful event, an allostatic response, involves vigorous physiological engagement with and efficient recovery from stress. Our aim was to investigate the influence of individual predispositions on cardiac responses to and recovery from a standardized psychosocial stress task (Trier Social Stress Task) in peacekeepers. We hypothesized that those individuals with higher trait resilience and those with higher resting vagal control would be more likely to present an allostatic response: a vigorous cardiac response to stress (i.e., reduction in interbeat intervals and heart rate variability (HRV)) coupled with a significant cardiac recovery in the aftermath. Fifty male military personnel with a mean age of 25.4 years (SD ± 5.99) were evaluated after returning from a peacekeeping mission. Electrocardiogram recordings were made throughout the experimental session, which consisted five conditions: basal, speech preparation, speech delivery, arithmetic task, and recovery. Mean interbeat intervals and HRV were calculated for each condition. An Ego-Resilience Scale and resting vagal control assessed individual predispositions. Stress tasks reduced interbeat intervals (tachycardia) and HRV in comparison with basal, with return to basal in the aftermath (p < 0.001, for all comparisons). Resilience and resting vagal control correlated positively with cardiac parameters for both stress reactivity and recovery (r ≥ 0.29; p < 0.05). In conclusion, peacekeepers showing higher trait resilience and those with higher resting vagal control presented a more adaptive allostatic reaction characterized by vigorous cardiac response to stress (i.e., tachycardia and vagal withdrawal) and efficient cardiac recovery after stress cessation.

5.

Lujan, H.L. & DiCarlo. (2013) Physical activity, by enhancing parasympathetic tone and activating the cholinergic anti-inflammatory pathway, is a therapeutic strategy to restrain chronic inflammation and prevent many chronic diseases. Medical Hypotheses, doi:10.1016/j.mehy.2013.01.014

Abstract

Chronic diseases are the leading cause of death in the world and chronic inflammation is a key contributor to many chronic diseases. Accordingly, interventions that reduce inflammation may be effective in treating multiple adverse chronic conditions. In this context, physical activity is documented to reduce systemic low-grade inflammation and is acknowledged as an anti-inflammatory intervention. Furthermore, physically active individuals are at a lower risk of developing chronic diseases. However the mechanisms mediating this anti-inflammatory phenotype and range of health benefits are unknown. We hypothesize that the “cholinergic anti-inflammatory pathway” (CAP) mediates the anti-inflammatory phenotype and range of health benefits associated with physical activity. The CAP is an endogenous, physiological mechanism by which acetylcholine from the vagus nerve, interacts with the innate immune system to modulate and restrain the inflammatory cascade. Importantly, higher levels of physical activity are associated with enhanced parasympathetic (vagal) tone and lower levels of C-reactive protein, a marker of low-grade inflammation. Accordingly, physical activity, by enhancing parasympathetic tone and activating the CAP, may be a therapeutic strategy to restrain chronic inflammation and prevent many chronic diseases.


6.

Luque-Casado A, Zabala M, Morales E, Mateo-March M, Sanabria D (2013) Cognitive Performance and Heart Rate Variability: The Influence of Fitness Level. PLoS ONE 8(2): e56935. doi:10.1371/journal.pone.0056935

Abstract

In the present study, we investigated the relation between cognitive performance and heart rate variability as a function of fitness level. We measured the effect of three cognitive tasks (the psychomotor vigilance task, a temporal orienting task, and a duration discrimination task) on the heart rate variability of two groups of participants: a high-fit group and a low-fit group. Two major novel findings emerged from this study. First, the lowest values of heart rate variability were found during performance of the duration discrimination task, compared to the other two tasks. Second, the results showed a decrement in heart rate variability as a function of the time on task, although only in the low-fit group. Moreover, the high-fit group showed overall faster reaction times than the low-fit group in the psychomotor vigilance task, while there were not significant differences in performance between the two groups of participants in the other two cognitive tasks. In sum, our results highlighted the influence of cognitive processing on heart rate variability. Importantly, both behavioral and physiological results suggested that the main benefit obtained as a result of fitness level appeared to be associated with processes involving sustained attention.


7.

Oliveira, T.P. et al. (2013) Absence of parasympathetic reactivation after maximal exercise. Clinical Physiology and Functional Imagine, 33(2): 143-149.

Summary

The ability of the human organism to recover its autonomic balance soon after physical exercise cessation has an important impact on the individual’s health status. Although the dynamics of heart rate recovery after maximal exercise has been studied, little is known about heart rate variability after this type of exercise. The aim of this study is to analyse the dynamics of heart rate and heart rate variability recovery after maximal exercise in healthy young men. Fifteen healthy male subjects (21·7 ± 3·4 years; 24·0 ± 2·1 kg m−2) participated in the study. The experimental protocol consisted of an incremental maximal exercise test on a cycle ergometer, until maximal voluntary exhaustion. After the test, recovery R-R intervals were recorded for 5 min. From the absolute differences between peak heart rate values and the heart rate values at 1 and 5 min of the recovery, the heart rate recovery was calculated. Postexercise heart rate variability was analysed from calculations of the SDNN and RMSSD indexes, in 30-s windows (SDNN30s and RMSSD30s) throughout recovery. One and 5 min after maximal exercise cessation, the heart rate recovered 34·7 (±6·6) and 75·5 (±6·1) bpm, respectively. With regard to HRV recovery, while the SDNN30s index had a slight increase, RMSSD30s index remained totally suppressed throughout the recovery, suggesting an absence of vagal modulation reactivation and, possibly, a discrete sympathetic withdrawal. Therefore, it is possible that the main mechanism associated with the fall of HR after maximal exercise is sympathetic withdrawal or a vagal tone restoration without vagal modulation recovery.

HRV and Adaptation: Insights from a hockey player

One of the first things I learned from using ithlete was that my HRV trend reflected my progressive adaptation to exercise. After my first conditioning session in two years I saw an immense drop in my HRV. Each session thereafter resulted in smaller fluctuations in my HRV score until eventually my trend was virtually unchanged from it. In the screenshot below you can see that in early October of 2012, I experienced a huge drop in HRV with a red indication. That was the morning after my first conditioning session (stair intervals). These workouts were performed each Wednesday thereafter with a progressive increase in sets and duration however you’ll see that HRV isn’t nearly as effected as it initially was. The next major drop in my HRV occurred in late November but wasn’t the result of a conditioning session.

HRV Chart

I also learned that HRV reflects illness, as well as the time it takes to fully recover from it. In the screen shot below you can see when I get sick and how long it took for my HRV to return to baseline levels (discussed in much more depth here).

073112_1517_Illnessreco3.png

Based on the sRPE levels, you can see that moderate workouts were causing large drops in HRV; a clear indication that my body was still fighting the infection even though I was symptom free.  I was able to adjust my training accordingly and not push it too hard until my body was ready to handle it.

See also a case study by Botek et al (2012) who used HRV to guide an elite athlete back to competition after having infectious mononucleosis.

HRV has also been shown to reflect acclimatization to heat (Dranitsin, 2008; Epstein et al. 2010).

Hockey Player

About 8 weeks ago I posted the HRV trend of a hockey player that I’m working with. Below in his screen shot you can see that the first two weeks of workouts were very taxing. However, we only had a short period of time to train and therefore waiting for optimal recovery wasn’t an option.

A.E.Trend

Keeping tabs on HRV, subjective measures of fatigue and performance markers I would make small changes in his training. For example I would maintain intensity but reduce volume when his HRV was low and he felt fatigued. I’ve found volume to affect HRV much more than intensity.

At this point his HRV baseline has improved 8 points and his HRV is not nearly as affected after intense training sessions. He’s put on about 10lbs of lean body mass and has increased both strength and fitness considerably; clear indications of positive adaptation. I’ve found that with this particular athlete HRV is generally in line with his perceived levels of fatigue. For example, he’ll report some soreness but that he feels great and highly motivated to train. This will typically corresponds with a good HRV score. However, on days where he reports feeling fatigued, unmotivated etc, HRV is almost always below baseline. Sleep duration and quality will also correlate with his HRV and perceived fatigue.

AETrendFeb

In each of the above examples, HRV has been a valuable tool in reflecting adaptation. Acute changes (daily change) in HRV are valuable in that they reflect a transient response to a significant stressor (response to a workout, high emotional stress, awful sleep, extreme deviation in nutrition, etc.). Monitoring the weekly and monthly trends provides insight as to how training and global stress is being tolerated over time (cycle to cycle). At no point did this athletes strength performance drop during our training. Even on days with low HRV he was able to hit or match a PR in strength exercises. However, strength levels weren’t too high to begin with so I wouldn’t read too much into that.

I’ve had some compliance issues with this athlete and taking daily measurements so getting him to fill in the comments section or use the training load function was out of the question. Therefore that data is not posted.

In closing, taken with subjective measures of fatigue, performance and global stress, HRV can potentially reveal meaningful information about adaptation and training response.

References

Botek, M. et al. (2012) Return to play after health complications associated with infection mononucleosis guided on ANS activity in elite athlete: a case  study. Gymnica, 42(2)

Dranitsin, O. (2008) The effect on heart rate variability of acclimatization to a humid, hot environment after a transition across five time zones in elite junior rowers. European Journal of Sport Science, 8(5): 251-258 Abstract

Epstein, Y. et al. (2010) Acclimation to heat interpreted from the analysis of heart rate variability by the Multipole Method. Journal of Basic & Clinical Physiology Pharmacology, 21(4): 315-23 Abstract

HRV Data from a High School Sprinter

Here is some more data and analysis from a nationally ranked high school sprinter (Junior) that I have using ithlete. Please note that the sprinter trains primarily with his sprint coach. I work with him roughly 3 days/week on mobility, restoration, etc.  He was an ideal candidate for monitoring HRV as he is an extremely motivated and dedicated athlete and there was no doubt in my mind that he could handle the daily measurements. The data stops in early January because he somehow broke the HRV receiver I gave him. A new one has been ordered recently I’ve been told. This data collection is primarily for observational purposes since I do not control or manipulate his training as mentioned above.

November

ZWNovTable

ZWNovtrend

  •  After 1 week of using ithlete, I had him start using the comments section and sleep score.
  • His resting heart rate was higher than I expected. I had him perform his measurements standing but in hindsight I should’ve had him do them seated based on his RHR.
  • HRV average is mid 70’s which is what I expect from an anaerobic athlete. Still would expect his HR to be at least in the high 60’s in standing position.
  • Clearly he stays up super late on weekends and sleeps in late. Been on his case about this. 

First Half of December

ZWDec1Table

 ZWDec1Trend1

  • HR/HRV average remains consistent. Coping with training well.
  • Race day on 12/7, hit a PB in his part of the relay. Not a hard race, treated as practice.
  • Reports of back soreness that persisted long enough for him to seek treatment (documented in next table).

Christmas Break – Second Half of December & Early January 

ZWXmasTable

ZWXmasTrend

  •  This last section of data is from his Christmas break. Interestingly his HRV average drops and his RHR increases. I attribute this to the change in routine (off of school), staying up late regularly, etc. I also notice changes in my HRV when my routine is interrupted. The body likes consistency.
  • Things appear to be going well though as he seldom gets below baseline scores (amber).
  • Race day on 1/6 and hits a PB on 60m.

Given that this athlete is still young and taking advantage of “newbie” strength gains, I would expect him to hit PB’s relatively consistently on the track. Based on his trend, fatigue was never really an issue. More training may have been well tolerated.

I’d like to get him to start using the training load feature too now to get a better idea of how hard his workouts are (perceptively).

4 Months of HRV, sRPE, Tap Test and Sleep score: Charts, Tables and Analysis

Since about mid-September of 2012 I started using a CNS Tap Test to see if it provided any indication of training fatigue or if it correlated with my HRV. In addition to tracking my tap test and HRV, I’ve also documented  sRPE and sleep score.

Descriptions

Tap Test – On the tap test app,  perform as many taps as possible in 10 seconds with right index finger and left index finger. I charted these values both separately as Right and Left as well as there total (sum). Tap test was performed immediately following morning HRV test.

HRV – Standard ithlete HRV measurement performed immediately after waking and bladder emptying. The measurements were all performed in the standing position. The ithlete uses the following formula for the HRV value:  20 x Ln (RMSSD). RMSSD is a time domain measure that reflects parasympathetic tone and has been shown to correlate reliably with the high frequency component of frequency domain measures (Sinnreich et al. 1998).

sRPE – Following a workout session I would rate perceived exertion on a scale of 1-10. Generally, active recovery/aerboic work would fall between 1-5 while resistance sessions fell between 6-10.

Sleep Score – I used the ithlete sleep rating score to track sleep quality. On a scale of 1-5 I would rate sleep quality after HRV measurement. Generally, an uninterrupted 7-8 hour sleep was rated as 5. One disturbance/wake was given a 4, etc.

Not Discussed – Today I will not be including discussion on strength performance in relation to HRV or Tap test as I did not really keep track of this. However, in the future I will do this once I determine the best way to quantify this.

Below are the charts with brief comments regarding training/stress for that month.

OCTOBER

Oct_data

– High stress and lack of training in early October due to work related trip over 3-4 days.

NOVEMBER

Nov_data

– Most consistent training month, most sessions completed, most stable HRV, highest HRV Avg, highest Tap Test Avg, highest sleep score. (more on averages and sleep at the end)

DECEMBER

Dec_data

– Highest strength demonstrated in this month out of the 4. Training interruption over the Christmas holiday.

JANUARY

Jan_data

– HRV effected by NYE party but Tap Test appears unaffected (alcohol, late night, etc.). Detrained slightly from lack of training of holidays. Training resumes, transitioning to lifting 4 days/week. Lowest HRV avg, lowest tap sum avg, fewest aerobic sessions.

Comparison of HRV, Sleep, and Tap Test Averages 

Avg_data1

data table avg

– HRV and Tap Test both peak during November which also has the highest average sleep rating. However from the table above you can see that these are by very small percentages.

– In the table and chart below you can see that peak HRV and peak Tap average also occur during the month of most consistent training, most aerobic sessions and most overall training sessions.

– HRV, Tap Test Left, Right and Sum all reach lowest averages in January. January also has the fewest aerobic sessions and comes after a period of detraining (discussed in depth here) in late December.

Comparison of HRV, # of Aerobic Sessions, # of Resistance Sessions & Sum of all sessions

lift_vs_hrv

lift_vs_hrv_table

Main Findings

Highest HRV avg, highest sleep avg, highest tap sum avg, highest left tap avg all occur in November. This corresponds with most total and most aerobic training sessions.

Conversely, lowest HRV avg, lowest tap left, right and sum average occur during January which also corresponds with fewest aerobic sessions but not with lowest sleep avg.

As you can clearly see, there is very little variation in month to month values  and therefore no significant or meaningful conclusions can really be made. However, my HRV data does fall inline with the overwhelming amount of research that shows HRV increases in response to aerobic exercise.

In a future experiment I will track performance ratings in addition to all of the other variables to see if there is any correlation. I will also plan some overload training to see how these markers respond. My training was relatively static during these 4 months.

Correlation between HRV, sRPE and subjective fatigue in athletes

Today I will review the research I’ve read that investigates the relationship between perceived exertion ratings of a workout session (sRPE), subjective levels of fatigue and HRV in effort to examine the usefulness of HRV in reflecting training load in athletic populations. Like all of my articles, this report is based on my interpretation of the research and perspectives from personal experience.

The Research

In a brand new study from the JSCR, Sartor and colleagues (2013) followed elite male gymnasts (n=6, age 16) over 10 weeks of training. HRV was monitored daily every other week while sRPE was collected immediately following each workout. HRV strongly correlated to previous day sRPE in both supine (HF%, HF%/LF%) and supine to seated measurements (mean RR, mean HR, HF%, SD1). Relationships were also seen between HRV, and perceived wellness (foster’s index). HRV correlated with training load (sRPE) and psychophysiological status.

Though sRPE wasn’t used in this next study, KeTien (2012) monitored HRV, blood-urine nitrogen (BUN) and profile of mood states (POMS) in 24 national level rugby players over an 8 week conditioning program. The program progressed from more aerobic based work to more anaerobic/interval based work. Spectral measures of HRV correlated with both POMS and BUN at each time point throughout the training period.

During the 2006 World Cup, Parrado and colleagues (2010) set out to determine if perceived tiredness could predict cardiac autonomic response to overload in elite field hockey players (n=8).  A strong correlation was found between per­ceived tiredness scores and HRV. Higher levels of perceived tiredness (acquired from questionnaire) were related to lower values of parasympathetic tone (RMSSD), pNN50 and higher LF/HF ratio. In order to discern changes in HRV brought on by fatigue from changes in HRV caused by pre-competitive anxiety, the researchers had the athletes complete anxiety questionnaires.

“Results show that cognitive anxiety and self-confidence sub­scales of the CSAI–2 were not related to perceived tiredness nor to heart rate variability. In the absence of a relation between cognitive anxiety and heart rate variability, it can be assumed that the relationship established between heart rate variability indexes and perceived tiredness scores are attributable to the fatigue state.”

Accounting for pre-game anxiety is very important as previous research has shown this to affect HRV (Edmonds et al. 2012, Mateo et al. 2012, Murray et al. 2008), thus making it difficult to distinguish fatigue from acute anxiety on the morning of a competition.

Edmonds et al. (2012) found that HRV (HF) correlated with sRPE in youth rugby players (n=9) during a one week microcycle of practices and a game. However, game day HRV values were lower which was attributed to the aforementioned pre-game anxiety since training loads were reduced before the competition.

Smith and Hopkins (2011) monitored performance, HRV, sRPE and subjective fatigue in elite rowers (n=10) throughout an intense 4 week training period. Interestingly, the most improved athlete and the only overtrained athlete both had statistically similar levels of perceived fatigue and changes in LF/HF ratio. However, after looking closely at the data, RMSSD showed a noticeable decline in the OT athlete compared to the most improved who had a moderate increase in RMSSD. The determining factor however in this case was performance changes.

Thiel at al. (2012) found that in 3 elite male tennis players, HRV, serum urea and psycho-physical state (assessed by EBF-52 questionnaire) each responded to overload training. As training load increased, HRV (RMSSD) decreased, perceived fatigue increased and serum urea increased. However, performance increased (V02 max, Single Leg CMJ, DJ index) and therefore performance metrics should always be considered when trying to discern functional overreaching (FOR) from non-functional overreaching (NFOR). HRV changes act as an early warning sign while performance decrements may represent the initial transition from FOR to NFOR.

Cipryan et al (2007) found that HRV correlated to performance in hockey players (age 17, n=4) but did not correlate to self-reported health status. Therefore, coaches should use caution when using perceived stress to predict ANS status and thus an objective measure (like HRV) is still recommended.

In elite female wrestlers, perceived stress (in the form of; excessive competition schedule, social, education, occupational, economical, travel, nutritional, etc) contributed to NFOR when HRV parameters were significantly increased (Tian et al. 2012). There was no mention of perceived stress/recovery in the NFOR group with significant decreases in HRV parameters. Regardless, subjective measures of stress including non-training related events require consideration when planning training. Monitoring the global stress of an athlete is more meaningful then simply training load.

Plews et al. (2012) monitored HRV and perceived measures of recovery (sleep, soreness, etc.) in two elite triathletes over a 77 day period leading up to competition. One athlete was considered NFOR. Perceived levels of recovery were not associated with HRV. However, the NFOR athlete admitted that she felt deterred from  reporting  low scores as anything below a certain score would be automatically sent to the coach. Therefore, when relying on perceptual measures from athletes, coaches must be prudent in ensuring honest reports. HRV was a better indicator of fatigue in this study.

The last study I’d like to mention only appears to be available in German at the moment. I translated the paper with google, however it was very rough to say the least. Therefore I will simply quote the pertinent information from the abstract:

“6 endurance athletes measured morning heart rate, heart rate variability (HRV) and mood state during a normal training period, a 17 day ultrarace (Deutschlandlauf) and following a recovery period. 4 out of 6 runners could not finish the race due to injury or exhaustion. 3 of them showed diagnostically relevant criteria of overreaching. All runners who quit the race showed increased morning heart rate, decreased HRV and a decreased mood state during competition. The studied parameters showed individually different adaptations but there were early changes that preceded the abortion of the run that gave diagnostically relevant information.” (Bossmann 2012)

Thoughts

Though there appears to be a strong tendency for HRV to reflect perceived training load and subjective fatigue, an objective measure of ANS status should still be considered. Subjective measures from athletes are only meaningful if honestly reported.

I’ve personally seen a strong correlation between morning HRV score and session rating of perceived exertion (sRPE) of the previous day’s workout. However, I’ve learned that this relationship isn’t perfect. I’ve experienced situations where;

–          Perceived exertion may be high but HRV response may be minimal if the workout is familiar (exercise selection, order, intensity, etc.).

–          In direct contrast to the above, perceived exertion may be moderate but HRV response may be significant if the workout is unfamiliar.

–          Non-training related factors affect HRV. Sleep, aerobic fitness, mental stress, nutrition, etc. can all impact ANS activity, possibly obscuring the relationship between training load and HRV.

–          Stress from travel, illness, occupation, etc. may have a larger impact on ANS than is perceived and reported.

–          More on other factors effecting HRV here.

In conclusion, obtaining both objective and subjective measures of fatigue along with performance indicators will provide a more accurate indication of training status. Monitoring of these variables regularly should enable the coach to better manipulate training loads to ensure progression and avoid unintentional overreaching.

References

Bossman, T. (2012) Effects of ultra-long-distance running on selected physiological and psychological parameters as a possible marker of overloading. Swiss Journal of Sports Medicine, 60(1): 21-5. Full Text

Cipryan, L., Stejskal, P., Bartakova, O., Botek, M., Cipryanova, H., Jakubec, A., Petr, M., & Řehova, I. (2007)  Autonomic nervous system observation through the use of spectral analysis of heart rate variability in ice hockey players.  Acta Universitatis Palackianae Olomucensis. Gymnica, 37(4): 17-21. Free Full-Text

Edmonds, RC., Sinclair, WH., and Leicht, AS. (2012) The effect of weekly training and a game on heart rate variability in elite youth Rugby League players. Proceedings of the 5th Exercise & Sports Science Australia Conference and 7th Sports Dietitians Australia Update. Research to Practice  Abstract

Ke-Tien, Y.(2012) Effects of Cardiovascular Endurance Training Periodization on Aerobic performance and Stress Modulation in Rugby Athletes. Life Science Journal, 9(2): 1218-25. Full-Text

Mateo, M. et al. (2012) Heart rate variability and pre-competitive anxiety in BMX discipline. European Journal of Applied Physiology, 112(1): 113-23.

Murray, N. P. et al. (2008) Heart rate variability as an indicator of pre-competitive arousal. International Journal of Sport Psychology, 39: 346-355.

Plews, DJ., Laursen, PB., Kilding & Buchheit, M. (2012) Heart rate variability in elite triathletes, is variation in variability the key to effective training? A case comparison. European Journal of Applied Physiology, 112(11): 3729-41.

Parrado, E.  et al. (2010)Perceived tiredness and HRV in relation to overload during a field hockey world cup. Perceptual and Motor Skills, 110(3): 699-713 Abstract

Sartor, F. et al. (2013) Heart rate variability reflects training load and psychophysiological status in young elite gymnasts. Journal of Strength & Conditioning Research, Published ahead of print.

Smith, T.B., & Hopkins, WG. (2011) Heart rate variability and psychological stress in an elite female rower who developed over-training syndrome. New Zealand Journal of Sports Medicine, 38(1): 18-20.

Thiel, C. et al. (2012) Functional overreaching in preparation training of elite tennis professionals. Journal of Human Kinetics, DOI: 10.2478/v10078-011-0025-x

Tian, Y., He, ZH., Zhao, JX., Tao, DL., Xu, KY., Earnest, CP. & McNaughton, LR. (2012) Heart rate variability threshold values for early-warning non-functional overreaching in elite women wrestlers. Journal of Strength & Conditioning Research, Published ahead of print


New HRV Research Vol: 2

Here are 5 new studies pertaining to HRV and training.

Previous Edition: Vol: 1       

1.

Sartor, F. et al. (2013) Heart rate variability reflects training load and psychophysiological status in young elite gymnasts. Journal of Strength & Conditioning Research, Published ahead of print. 

Abstract

In gymnastics monitoring of the training load and assessment of the psychophysiological status of elite athletes is important for training planning and to avoid overtraining, consequently reducing the risk of injures. The aim of this study was to examine whether heart rate variability (HRV) is a valuable tool to determine training load and psychophysiological status in young elite gymnasts. Six young male elite gymnasts took part in a 10 week observational study. During this period, beat to beat heart rate intervals were measured every training day in week 1, 3, 5, 7 and 9. Balance, agility, upper limb maximal strength, lower limb explosive and elastic power were monitored during weeks 2, 4, 6, 8 and 10. Training load of each training session of all 10 weeks was assessed by session-RPE and psychophysiological status by Foster’s index. Morning supine HRV (HF% and LF%/ HF%) correlated with the training load of the previous day (r=0.232, r=-0.279, p<0.05 ). Morning supine to sitting HRV difference (mean RR, mean HR, HF%, SD1) correlated with session-RPE of the previous day (r=-0.320, r=0.301 p<0.01, r=0.265, r=-0.270, p<0.05) but not with Foster’s index. Training day/reference day HRV difference (mean RR, SD1) showed the best correlations with session-RPE of the previous day (r=-0.384, r=-0.332, p<0.01) and Foster’s index (r=-0.227, r=-0.260, p<0.05). In conclusion, HRV, and in particular training day/reference day mean RR difference or SD1 difference, could be useful in monitoring training load and psychophysiological status in young male elite gymnasts.

2.

Boutcher, S.H. et al. (2013) The relationship between cardiac autonomic function and maximal oxygen uptake response to high-intensity intermittent exercise training. Journal of Sports Sciences, Published ahead of print.

Abstract

Major individual differences in the maximal oxygen uptake response to aerobic training have been documented. Vagal influence on the heart has been shown to contribute to changes in aerobic fitness. Whether vagal influence on the heart also predicts maximal oxygen uptake response to interval-sprinting training, however, is undetermined. Thus, the relationship between baseline vagal activity and the maximal oxygen uptake response to interval-sprinting training was examined. Exercisers (n = 16) exercised three times a week for 12 weeks, whereas controls did no exercise (n = 16). Interval-sprinting consisted of 20 min of intermittent sprinting on a cycle ergometer (8 s sprint, 12 s recovery). Maximal oxygen uptake was assessed using open-circuit spirometry. Vagal influence was assessed through frequency analysis of heart rate variability. Participants were aged 22 ± 4.5 years and had a body mass of 72.7 ± 18.9 kg, a body mass index of 26.9 ± 3.9 kg · m−2, and a maximal oxygen uptake of 28 ± 7.4 ml · kg−1 · min−1. Overall increase in maximal oxygen uptake after the training programme, despite being anaerobic in nature, was 19 ± 1.2%. Change in maximal oxygen uptake was correlated with initial baseline heart rate variability high-frequency power in normalised units (r = 0.58; P < 0.05). Thus, cardiac vagal modulation of heart rate was associated with the aerobic training response after 12 weeks of high-intensity intermittent-exercise. The mechanisms underlying the relationship between the aerobic training response and resting heart rate variability need to be established before practical implications can be identified.


3.      

James, DVC. Et al (2012) Heart Rate Variability: Effect of Exercise Intensity of Post-Exercise Response.  Research Quarterly for Exercise & Sport. 83(4)

Abstract:

The purpose of the present study was to investigate the influence of two exercise intensities (moderate and severe) on heart rate variability (HRV) response in 16 runners 1 hr prior to (-1 hr) and at +1 hr, +24 hr, +48 hr, and +72 hr following each exercise session. Time domain indexes and a high frequency component showed a significant decrease (p < .001) between -1 hr and +1 hr for severe intensity. The low frequency component in normalized units significantly increased (p < .01) for severe intensity at +1 hr. Only severe exercise elicited a change in HRV outcomes postexercise, resulting in a reduction in the parasympathetic influence on the heart at +1 hr; however, values returned to baseline levels by +24 hr.


4.

Gravitis, U. et al (2012) Correlation of basketball players physical condition and competition activity indicators. Lase Journal of Sports Science, 3(2): 39-46

Abstract

We failed to find any research about whether physical condition affects the indicators of a basketball player’s competition activity, and if yes, then to what extent; whether there is direct correlation between the indicators of a basketball player’s physical condition and his shooting accuracy in a game, as well as the number of obtained and lost balls by him.

Aim of the research: to investigate correlation of basketball players’ indicators of physical condition and competition activity.

Male basketball players aged 21-25 years participated in the research. On the pre-game day all basketball players were tested. Players’ heart rate was interpreted with the scientific device Omega M. A computer gave conclusion about a player’s degree of tension, as well as the degree of adaptation to physical loads, the readiness of the body energy provision system, the degree of the body training and the psycho-emotional condition, as well asthe total integral level of sports condition at the given moment. On the next day of the competition calendar game the content analysis of the competition technical recording was made to compare the player’s whose physical indicators were lower performance with his average performance in the whole tournament. Altogether 80 cases have been analysed when a player having lower physical condition indicators participated in a game.

All in all the players having lower indicators of physical condition in 80% of cases competition activity results were lower than their average performance in the tournament. The Pearson’s rank correlation coefficient also shows a close connection between the indicators of physical condition and competition activity (r=0.687; p<0.01), in comparison to a player’s average performance during the whole tournament. Basketball players’ indicators of physical condition have close correlation (r=0.687; p<0.01) with the indicators of competition activity.The results of physical condition test obtained with the help of the device Omega M can be used to anticipate basketball players’ performance of their competition activity.


5.

Chalencon S, Busso T, Lacour J-R, Garet M, Pichot V, et al. (2012) A Model for the Training Effects in Swimming Demonstrates a Strong Relationship between Parasympathetic Activity, Performance and Index of Fatigue.  PLoS ONE 7(12): e52636. doi:10.1371/journal.pone.0052636

Abstract

Competitive swimming as a physical activity results in changes to the activity level of the autonomic nervous system (ANS). However, the precise relationship between ANS activity, fatigue and sports performance remains contentious. To address this problem and build a model to support a consistent relationship, data were gathered from national and regional swimmers during two 30 consecutive-week training periods. Nocturnal ANS activity was measured weekly and quantified through wavelet transform analysis of the recorded heart rate variability. Performance was then measured through a subsequent morning 400 meters freestyle time-trial. A model was proposed where indices of fatigue were computed using Banister’s two antagonistic component model of fatigue and adaptation applied to both the ANS activity and the performance. This demonstrated that a logarithmic relationship existed between performance and ANS activity for each subject. There was a high degree of model fit between the measured and calculated performance (R2 = 0.84±0.14,p<0.01) and the measured and calculated High Frequency (HF) power of the ANS activity (R2 = 0.79±0.07, p<0.01). During the taper periods, improvements in measured performance and measured HF were strongly related. In the model, variations in performance were related to significant reductions in the level of ‘Negative Influences’ rather than increases in ‘Positive Influences’. Furthermore, the delay needed to return to the initial performance level was highly correlated to the delay required to return to the initial HF power level (p<0.01). The delay required to reach peak performance was highly correlated to the delay required to reach the maximal level of HF power (p = 0.02). Building the ANS/performance identity of a subject, including the time to peak HF, may help predict the maximal performance that could be obtained at a given time.

HRV and Strength Research: Implications for Strength/Power Athletes?

At this point there is quite a bit of research pertaining to HRV and aerobic exercise/endurance training. However, the application of HRV for strength/power (S/P) athletes is less clear. Today I will discuss the available research pertaining to resistance training (RT) and HRV and share some of my thoughts on the topic.

Unfortunately for S/P athletes, the majority of the research that exists involving RT and HRV do not involve athletes. Rather, most of the research tests the effects that RT has on resting HRV for the purposes of improving health/reducing mortality in elderly or diseased populations. Nevertheless, I will summarize what I’ve read.

Heffernan and colleagues (2007) found no change in HRV following 6 weeks of RT and after 4 weeks of detraining in 25 year old male untrained subjects (n=14).

Cooke and Carter (2005) saw non-significant increases in HRV following 8 weeks of RT compared to control in healthy young adults (n=22).

In middle aged folks with pre-hypertension, aerobic exercise increased HRV while RT resulted in decreases in HRV (Collier et al. 2009). In healthy young adults aerobic training improved HRV (in men but not women) while RT had no effect (Sloan et al. 2009).

Elite endurance athletes had higher HRV at rest compared to Elite power athletes but the power athletes had better resting HRV than control (Kaltsatou et al. 2011). No surprise here.

Following 16 weeks of resistance training, a high intensity group and a low intensity group of healthy older women both improved strength with no significant changes in HRV (Forte et al. 2003). These results were consistent with findings by Madden et al (2006) with the same population however they included an aerobic training group who did see increases in HRV.

RT improved HRV in women with fibromyalgia in a study by Figueroa et al. (2007) but failed to improve HRV in the same population in work by Kingsley et al. (2010).

Compared to 3 months of low intensity training (calisthenics and breathing training), intense training (combined aerobic and strength training) improved HRV at rest and in response to orthostasis (standing) in COPD patients (Camillo et al. 2011). The researchers found that better baseline HRV, muscle force and daily levels of activity were predictors of HRV changes after exercise intervention.

In healthy older men, 12 weeks of eccentric RT resulted in decreased HRV. (Melo et al. 2008)

If one’s goal is to increase HRV via exercise then I would definitely go with aerobic work as this seems to be more effective than RT, though the results are conflicting. Training protocols, subjects, health status, age, HRV measurement position and duration, etc. all vary quite a bit which likely accounts for the conflicting results. I assume that there is a volume/intensity threshold that must be met during RT periods to cause a change in resting HRV. For optimal health it is likely that a combination of aerobic work and RT will offer the most benefits.

From personal experience, I see much higher scores when I incorporate more aerobic or intermittent conditioning work. In reviewing my all time HRV trend, I can clearly see that over the spring and summer (03-09) of 2012 I had considerably more green scores and higher deflections. This is in line with the time that the weather got nicer and I started doing 30-40 minute runs 3-4x/week (March was unusually warm last year). I got really sick for 2 weeks in June as I discussed here, otherwise I would expect  my trend to be even higher. Once Sept. rolled around I started working full-time again and reduced my aerobic work to 2x/week for about 2o minutes and at a lower intensity at which point baseline declines back to pre-spring/summer levels.

trendalltimejan28

Implications for S/P Athletes

The application of HRV for S/P athletes is obviously different than for elderly or diseased populations. RT is incorporated in training as a means to increase performance, not to increase vagal tone. Therefore, the utility of HRV for this population revolves around its potential ability to:

(Any research I discuss in this section has been cited previously and will not be cited again today, see my older posts for references.)

  • Predict training outcomes

–       Higher HRV at baseline results in improvements in aerobic performance (see here). Would higher baseline HRV result in better S/P improvements? If so, would purposeful manipulation of ANS prior to intensive RT periods via “aerobic” (read “work capacity”) training be of benefit? We already know the importance of GPP but is this relationship mirrored in HRV? If so, HRV may be worth monitoring during these periods.

–       Better basketball and ice hockey performance as well as endurance performance has been correlated with HRV (specifically parasympathetic tone) as I’ve discussed in previous posts. I’m not sure this relationship exists with S/P athletes but it would still be worth testing. Anecdotally, I’ve experience reduced strength performance when HRV is low due to physical fatigue. However, I haven’t really seen strength affected when HRV is low caused by other factors (sleep, other stressors, etc.) Therefore, establishing this relationship must involve careful consideration of these variables.

  • Reflect Recovery Status/Training Load, Overreaching/Non-Functional Overreaching

–       Does overreaching in S/P athletes result in a concomitant decrease in performance and HRV?  Elite female wrestlers were considered non-functionally overreached when performance decreased and HRV was significantly above or below baseline for greater than 2 weeks. Elite tennis players saw significant decreases in HRV but improved performance. Generally in endurance athletes, overreaching will result in decreased performance and a significant increase or decrease in HRV (from baseline).

–       I feel that in S/P athletes, performance probably won’t decrease concurrently with HRV assuming it is a gradual decline as a result progressively increasing training loads. Rather, HRV will probably change first indicating an accumulation of fatigue and performance will fall at some point after if loading persists. Monitoring HRV may be useful to prevent excessive fatigue/overreaching if that isn’t the goal. Perhaps it is also useful in detecting transitions from functional to non-functional overreaching (the point at which HRV changes from overly sympathetic to highly parasympathetic).

–       Does the return to baseline HRV (after overreaching) happen concurrently with return or increase in S/P performance? This was the for case elite swimmers as peak performance occurred concurrently with peak HF values (parasympathetic tone). If so HRV would be a good tool for guiding tapers and establishing best protocols for meet/competition preparation.

–       HRV is an effective tool for guiding aerobic training. Does this apply to S/P athletes? Given that HRV reflects recovery status in S/P athletes (both in the research and anecdotally) and that HRV is sensitive to pretty much all forms of stress, it would seem logical to at least consider HRV in determining daily training. HRV may serve as a guide for determining training frequency and intensity/volume based on individual recovery. More on this topic here. It would be interesting to see HRV guided vs. Pre-planned RT compared in S/P athletes.

  • Guide Periodization

–       HRV will decrease in response to an intense workout. When you perform that workout again and again, your body adapts. The workout is no longer as stressful (decrease in soreness, lack of HRV response, quick recovery, etc. What benefits can HRV offer for adjusting volumes, intensities, exercise selections, frequencies etc. in effort to continually stimulate progress? Is HRV response after a workout any indication of how effective that workout is? Of course there are other factors to consider, not just the amount of stress/fatigue a workout causes. I have repeated workouts with high perceived exertion that have had little effect on HRV. Does that indicate that a change is needed in programming?

It goes without saying that several other factors and variables should be considered when analyzing HRV. HRV is only one variable and is sensitive to a variety of factors that  can influence a result (non-training related stressors, pre-competition anxiety, etc.).

Announcement

This March I will be relocating to Alabama to work in the Human Performance Lab at Auburn University (Montgomery campus) with Dr. Mike Esco. I met Dr. Esco at the NSCA National Conference in RI last summer. Dr. Esco has been researching HRV for several years now. We have several projects tentatively planned and doing an HRV and RT study is one that we’ve been considering. Hopefully we can make it happen.

References

Camillo, C.A. et al. (2011) Improvements of heart rate variability after exercise training and its predictors in COPD. Respiratory Medicine, 105(7): 1054-1062

Cook, W.H., & Carter, J.R. (2005) Strength training does not effect vagal-cardiac control or cardiovascular baroreflex sensitivity in young healthy subjects. European Journal of Applied Physiology, 93: 719-725

Forte, R. et al. (2003) Effects of dynamic resistance training on heart rate variability in healthy older women. European Journal of Applied Physiology, 89: 85-89

Heffernan, K.S. et al. (2007) Heart rate recovery and complexity following resistance exercise training and detraining in young men. American Journal of Physiology – Heart & Circulation Physiology, 293: H3180-H3186

Kaltsatou, A. et al. (2011) The use of pupillometry in the assessment of cardiac autonomic function in elite different type trained athletes. European Journal of Applied Physiology, 111: 2079-2087

Kingsley, J.D., et al (2010). The effects of 12 weeks of resistance exercise training on disease severity and autonomic modulation at rest and after acute leg resistance exercise in women with fibromyalgia. Archives of Physical Medicine & Rehabilitation, 91: 1551-1557

Madden, K.M. et al. (2006) Exercise training and heart rate variability in older adult female subjects. Clinical & Investigative Medicine, 29: 1 – ProQuest

Melo, R.C. et al. (2008) High Eccentric strength training reduces heart rate variability in healthy older men. British Journal of Sports Medicine, 42: 59-63

Sloan, R. P., Shapiro, P.A., DeMeersman, R.E., Bagiella, E., Brondolo, E., McKinley, P.S., Slavov, I., Fang, Y., & Myers, M.M. (2009). The effect of aerobic training and cardiac autonomie regulation in young adults. American Journal of Public Health, 99(5), 921-928

HRV Reflects Detraining – Trend Analysis

Generally when I see a decline in my HRV trend it is because of illness, high stress or significant accumulation of fatigue. However, over the Christmas break I decided to take 2 weeks off from lifting. This decision was based mostly on the fact that I wouldn’t have access to my training facility until after the break. The last time I remember taking this much time off from lifting was back in 2006 when my appendix ruptured and I didn’t get to a hospital until about a 10 days later. I have a nice 6 inch scar on my lower right abdomen to remind me to go see a doctor sooner than later when I feel really sick. Needless to say I was forced to take some time off.

Below are some screen shots of my data that clearly show a steady decline in my HRV trend after approximately one week of training cessation.

RPE Trend Jan 10

–          Above you can see that my last workout before the break was on 12/21 and my first workout back was this Monday (01/07). Between those dates I performed 4 body weight workouts that were largely half-assed. I think my rationale for them was to justify eating all of those high calories meals over the holidays. Without these mini workouts I believe the trend would’ve shown a steeper decline.  HRV baseline dropped from about 80 to about 74 by the end of the detraining period.

–          The steepest dip in the trend came on New Year’s Day as a result of the overeating and drinking from New Year’s Eve. HRV responds poorly to partying.

–          The high point on 01/03 I believe was the result of a day that included a 1 hour massage, hot pools, sauna, steam room, cold tub etc.

–          Training resumed 01/07 and as expected strength levels were noticeably down and a workout that previously could be considered a deload was rated as an 8 and caused a pronounced dip in HRV the following day accompanied with extreme soreness. A clear sign that I’ve detrained. The same happened for Wedneday’s workout (01/09).

Data Jan 10

–          In the image above you can see that my HRV is lower than usual (baseline is typically around 80). 01/04 stands out to me as a HR of 61.4 is usually accompanied with a high 70’s – low 80’s HRV score but instead HRV is at 72.

trend change Jan 10

–          Above you can see my 3 month trend charted and my Daily, Week and Month change. You can clearly see my baseline HRV steadily decline in late December.

I can think of 2 stuides that investigated the effects of detraining on HRV.

In a study by Gamelin et al (2007), healthy young men (untrained, age 21) were put through 12 weeks of aerobic training followed by 8 weeks of detraining to determine its effect on HRV. An improvement in HRV was seen after the 12 weeks however HRV scores returned to pre-test levels after only 2 weeks of training cessation. “Twelve weeks of aerobic training are sufficient to achieve substantial changes in Heart Rate Variability; and only two weeks of detraining completely reverse these adaptations.”

–          My declining trend in HRV was reflecting my fitness levels, not my strength levels even though they also declined. My trend would’ve likely remained relatively unchanged had I maintained aerobic fitness.

In a recent study by Gutin et al. (2012), obese children were put through a 4 month exercise intervention. RMSSD (a time domain measure of parasympathetic tone) increased after the exercise period and decreased during the detraining period. Below are some excerpts from the study I felt were worth sharing;

“The variables that were significantly associated with individual differences in responsivity to the PT were: (1) the pre-PT RMSSD level—higher pre-PT values were associated with lower change scores (r= −0.28, p = 0.018);”

–          I’m curious to know what accounted for higher pre-training RMSSD values in those subjects. Were they more fit? Were stress levels just considerably lower? Is this a genetic thing? How does resting RMSSD pre-training effect training response? In research I discussed here, higher HRV levels pre-training resulted in larger improvements in fitness vs. the subjects with lower HRV levels pre-training in recreational endurance athletes (Vesterinen et al. (2011) and in soccer players (Oliveira et al. 2012).

“the change in vigorous physical activity (r = 0.25, p = 0.040)—those who increased most in vigorous activity increased most in RMSSD.”

“The primary result of this study was that the RMSSD increased during 4-month periods during which the obese children were engaged in PT, and declined in the 4-month period following cessation of PT in Group 1. This demonstration of what occurred as a result of increases and decreases in controlled vigorous activity supports the idea that regular exercise has a favorable influence on PSA in this population. “

–          These results obviously aren’t shocking and we don’t need HRV to tell us we are detrained. However, monitoring the trends allows us to ensure favorable responses to training. This becomes much more important in athletes or individuals engaging in intense physical training.

Wrap up

Only two weeks of training cessation will result in noticeable decrements in performance and a decrease in resting parasympathetic tone. In the future I will likely perform 1-2 maintenance type workouts each week to maintain strength and fitness levels.

References:

Gamelin, et al. (2007) Effect of training and detraining on HRV in healthy young men. International Journal of Sports Medicine, 28(7): 564-70

Gutin, B., et al. (2012) Heart rate variability in obese children: Relations to total body and visceral adiposity and relations to physical training and detraining. Obesity Research, 8(1): 12-19

Oliveira, RS. et al. (2012) The correlation between heart rate variability and improvement in soccer player’s physical performance. Brazilian Journal of Kinanthropometry, 14(6)

Vesterinen, V. et al. (2011) Heart rate variability in prediction of individual adaptation to endurance training in recreational endurance athletes. Scandinavian Journal of Medicine & Science in Sports, DOI: 10.1111/j.1600-0838.2011.01365.x

A collection of thoughts on HRV and Sports Training

I’ve been having a lot of different thoughts running through my mind recently on various topics surrounding HRV and sports training. A lot of what I say today is based on a lot of the research I’ve been reading and comparing it to my personal experience with my own training and that of my athletes. I’ll try and organize it as best I can but it will be pretty random for the most part. Below are several topics that really deserve entire posts on their own however today I will just provide some quick thoughts on each one.


HRV as a predictor of Performance and or Adaptation

–          HRV appears to predict performance in aerobic athletes. I’ve discussed and cited this research in previous posts. However, in a new study by Chalencon et al. (2012) swim performance in elite athletes was related to parasympathetic activity.

 “the delay needed to return to the initial performance level was highly correlated to the delay required to return to the initial HF power level (p<0.01). The delay required to reach peak performance was highly correlated to the delay required to reach the maximal level of HF power (p = 0.02). Building the ANS/performance identity of a subject, including the time to peak HF, may help predict the maximal performance that could be obtained at a given time.”

See the full text here.

–          Prior to the initiation of intensive training, HRV values appear to predict training outcomes, again, mostly in aerobic athletes. Higher HRV values prior to training lead to better improvements in aerobic performance.  See here for more on this.

–          Higher HRV values on game day are correlated to better performance in amateur Basketball players (Di Fronso et al. 2012).

–          There are several factors that affect an athlete’s performance on any given day. By no means am I suggesting that one is doomed to poor performance if HRV isn’t high. I like the saying “psychology trumps physiology every time”. I think it was Alwyn Cosgrove who said that? Regardless, it’s very true. Furthermore pre-game anxiety can provide a skewed HRV result. More research on this needs to be done.

–           At the moment I do not believe that strength/power can be predicted by HRV on a day to day basis based on my experience. It likely play’s a factor but is certainly not determinant.

HRV as a reflection of recovery status

–          I believe this is one of HRV’s greatest attributes. Your level of fatigue after an intense workout or competition will be reflected in your HRV score. This is valuable for planning the weekly training so as not to load the athlete too soon after competition or too much before competition. In my experience this will usually correlate to perceived recovery. You can typically feel this. However, we cannot feel what our athletes are feeling. See Edmonds et al. (2012) for a study on elite youth rugby players for data on this subject.

–          Chen et al. (2011) showed that after an intense strength workout in elite weightlifters strength and HRV dropped. Strength did not return to baseline (or even above) levels until HRV returned to at or above baseline. This is one of the few studies that used HRV in strength athletes. Most coaches/trainee’s should already be aware that 1RM strength will be reduced for the net 24-48 hours after an intense workout but is cool to see that HRV may reflect the actual time period.

HRV as an early warning sign

–          Fatigue is ok, extreme fatigue is not. HRV is probably one of the first warning signs of fatigue. How much fatigue is okay? I think that first HRV will reflect that physical stress is accumulating. However, until performance changes, we likely needn’t change anything. If training is set up appropriately there should be enough rest/recovery for HRV to approach baseline at the end of each week. This will allow for a slower, more steady decline in the trend as opposed to a more rapid and steep decline which indicates excessive fatigue and overload. Planned overreaching should include the monitoring of several training status markers. HRV will respond early.

–          Researchers found that 3 elite tennis players saw significant reductions in HRV values over pre-season training however performance improved (Thiel et al. 2012). HRV alone does not indicate functional or non-functional overreaching. HRV did not correlate to performance markers but did correlate to other training status markers.

Limitations of Weekly or Monthly HRV Monitoring as opposed to higher frequency monitoring

–          Many studies I’ve read pertaining to athletes have measured HRV periodically (weekly, monthly, pre-post training phase, etc). This is much more practical for coaches as daily HRV measurements can be tedious and compliance can be hard to get from athletes. However, day to day measurements are more valuable as they allow the coach to make training adjustments before excessive fatigue builds up. However, if a coach could only use weekly HRV measurements with athletes I think these measurements would best be done the morning after a recovery day. HRV score at rest will provide the most meaningful information about training load/fatigue.

HRV in Elite vs. Non Elite Athletes

–          I have a lot of thoughts on this but will reserve comment until I do some more research on this. In short, I think there is a difference in how HRV data should be interpreted among these groups.

HRV in competitive athletes vs. Recreation lifters/athletes

–          HRV guided training (planning higher loads when HRV is at or above baseline and reducing them when HRV is below baseline) is likely safer and possibly more effective over longer term training. However, I don’t see how this method will work with athletes during shorter term training periods. Overload is required followed by a taper. Conversely, if your training results are not limited by requiring optimal performance at a certain date, HRV guided training will likely reduce risk of injury, illness, nagging join/soft tissue problems, etc. Recreational lifters would certainly benefit from this style of training.

Final thoughts for today

To be clear, the above are all simply thoughts/hunches I’ve been having. These are all incomplete at the moment and require further elaboration. Moreover, my stance on many of these topics are subject to change. My thoughts are limited by my experience and the research I’ve read. There is still a lot of work that needs to be done on HRV to uncover its potential as a monitoring tool in athletes.

References:

Chalencon S, Busso T, Lacour J-R, Garet M, Pichot V, et al. (2012) A Model for the Training Effects in Swimming Demonstrates a Strong Relationship between Parasympathetic Activity, Performance and Index of Fatigue. PLoS ONE 7(12): e52636. doi:10.1371/journal.pone.0052636

Chen, J., Yeh, D.,  Lee, J., Chen, C.,  Huang, C.,  Lee, S., Chen, C.,  Kuo, T., Kao, C., & Kuo, C. (2011) Parasympathetic nervous activity mirrors recovery status in weightlifting performance after training. Journal of Strength and Conditioning Research, 25(6):  1546-1552

Di Fronso, S. et al. (2012) Relationship between performance and heart rate variability in amateur basketball players during playoffs. Journal for Sports Sciences & Health, 8 (Suppl 1):S1–S70 45

Edmonds, RC., Sinclair, WH., and Leicht, AS. (2012) The effect of weekly training and a game on heart rate variability in elite youth Rugby League players. Proceedings of the 5th Exercise & Sports Science Australia Conference and 7th Sports Dietitians Australia Update. Research to Practice , 19-21 April 2012, Gold Coast, QLD, Australia , p. 183.

Oliveira, RS. et al. (2012a) Seasonal changes in physical performance and HRV in high level futsal players. International Journal of Sports Medicine. DOI: 10.1055/s-0032-1323720

Thiel, C. et al. (2012) Functional overreaching in preparation training of elite tennis professionals. Journal of Human Kinetics, DOI: 10.2478/v10078-011-0025-x