Effects of varying training load on HRV and running performance among an Olympic rugby sevens team

This study is the first of a few collaborations between Dan Howells and I involving HRV in elite rugby sevens players. Here we evaluated HRV and running performance responses  to peak training loads during preparation for the 2016 Olympic games. A practical summary follows the abstract below.

Effects of varying training load on heart rate variability and running performance among an Olympic rugby sevens team

JSAMS Abstract Flatt Howells HRV rugby sevens

How do elite seven’s players respond to substantial increments in training load? Based on previous studies, we’d expect the weekly LnRMSSD mean (LnRMSSDm) to decrease and the coefficient of variation (LnRMSSDcv) to increase relative to baseline. We’ve observed this in collegiate soccer players and sprint-swimmers.

In contrast to this hypothesis, the players showed no change in LnRMSSDmean throughout two weeks of intensified training relative to a baseline week of low loads. LnRMSSDcv demonstrated a small increase during the first week of increased load (expected response) but then showed a moderate decrease during the second week of increased load, which involved greater loads than the previous week (unexpected response).

No change (or an increase) in LnRMSSDm and a reduction in LnRMSSDcv is typically observed when training loads are reduced. Less training stress results in less fluctuations in LnRMSSD. However, these players demonstrated less fluctuation in LnRMSSD despite significant increments in training load.

The discrepancy here appears to be related to how players are tolerating and adapting to the training load. We often assume that increased loads will result in fatigue accumulation and temporary negative responses. However, these elite players demonstrated no reductions in subjective indicators of recovery status during the weeks of increased load. Additionally, there was no significant decrement in running performance (maximum aerobic speed) mid-way through the intensified microcycles.

Thus, the preservation of autonomic activity (no change in LnRMSSDm) and less fluctuations (reduced LnRMSSDcv) seem to reflect a postive coping response to the training. In fact, individuals who demonstrated the lowest LnRMSSDcv during week 1 of increased load showed the most favorable changes in running performance (r = -0.74).

This is yet another study that demonstrates that reduced fluctuations in LnRMSSD (i.e., decrease in LnRMSSDcv) is associated with positive training responses in athletes.

The Practical Implications of the study were:

•When evaluated as a group, LnRMSSDcv may be a more sensitive training response marker than LnRMSSDm during training load variations among elite players.

•LnRMSSDcv did not display a linear dose–response relationship with training load. Rather, LnRMSSDcv seems to reflect an adaptive physiological response to the imposed training stimulus which may be useful for identifying individuals responding undesirably to training.

•Elite rugby players presenting large day-to-day fluctuations in LnRMSSD in response to training load variation should be monitored closely for performance decrements, particularly when nearing important competitions.

HRV-guided vs. pre-planned training at altitude in an elite wheelchair marathoner

This new paper is in collaboration with Santi Sanz-Quinto and colleagues from his dissertation work. The case study compares HRV-guided vs. pre-planned training at altitude in an elite wheelchair marathoner with CMT.

Influence of Training Models at 3,900-m Altitude on the Physiological Response and Performance of a Professional Wheelchair Athlete: A Case Study.

Abstract

This case study compared the effects of two training camps using flexible planning (FP) vs. inflexible planning (IP) at 3,860-m altitude on physiological and performance responses of an elite marathon wheelchair athlete with Charcot-Marie-Tooth disease (CMT). During IP, the athlete completed preplanned training sessions. During FP, training was adjusted based on vagally mediated heart rate variability (HRV) with specific sessions being performed when a reference HRV value was attained. The camp phases were baseline in normoxia (BN), baseline in hypoxia (BH), specific training weeks 1-4 (W1, W2, W3, W4), and Post-camp (Post). Outcome measures included the root mean square of successive R-R interval differences (rMSSD), resting heart rate (HRrest), oxygen saturation (SO2), diastolic blood pressure and systolic blood pressure, power output and a 3,000-m test. A greater impairment of normalized rMSSD (BN) was shown in IP during BH (57.30 ± 2.38% vs. 72.94 ± 11.59%, p = 0.004), W2 (63.99 ± 10.32% vs. 81.65 ± 8.87%, p = 0.005), and W4 (46.11 ± 8.61% vs. 59.35 ± 6.81%, p = 0.008). At Post, only in FP was rMSSD restored (104.47 ± 35.80%). Relative changes were shown in power output (+3 W in IP vs. +6 W in FP) and 3,000-m test (-7s in IP vs. -16s in FP). This case study demonstrated that FP resulted in less suppression and faster restoration of rMSSD and more positive changes in performance than IP in an elite wheelchair marathoner with CMT

Revisiting 60-s HRV recordings vs. Criterion in athletes

I’ve recently had the pleasure of peer-reviewing a few very well-written and carried out studies investigating duration requirements for stabilization preceding HRV recordings by different research groups. I look forward to seeing the published versions as the quality of the papers was very high.

In reviewing these papers it prompted me to reconsider what we all have been using as the criterion period. My colleagues and I have published 5 papers using a 5-min R-R sample preceded by a 5-min ‘stabilization’ period (10 min total duration) as the criterion (as has other groups), which is in line with traditional procedures. But I think we failed to address an important limitation of these procedures…

The issue is that the ‘traditional procedures’ were not devised for the purposes of establishing LnRMSSD specifically (rather, they needed to accommodate spectral analysis), nor were they devised for reflecting fatigue and adaptation to training programs. Therefore, for these specific purposes, it can be argued that the traditional procedures may not be as relevant, or at the very least, calls into question whether the 5-10 min period following the 0-5 min stabilization is in fact a criterion within this context.

Some things to consider:

  • 10 min is a long time to lay or sit still, especially for athletes who struggle to go 30-sec without checking their iPhone (I don’t think anyone disputes this). Are they more relaxed and stable in this situation or are they growing impatient and restless?
  • Are ANS responses and adaptation to training best measured in a completely relaxed state, or perhaps in response to a mild stimulus such as orthostasis (sitting or standing) (previous thoughts on this here)?
  • Should we be as skeptical with the ‘criterion’ recordings as much as as we are with 60-s recordings? How do we know if one is better than the other in the context of monitoring athletes? There’s now numerous studies by different groups showing the usefulness of 60-s measures for reflecting training responses, associating with fitness, etc.
  • Perhaps the question shouldn’t be regarding the optimal duration of the recording but rather, what is the shortest, most convenient procedure possible that still provides meaningful training status information? I don’t think an athlete or coach cares if their 60 sec HRV isn’t the same as the criterion if it’s still providing useful information.
  • I’m doubtful we would have completed any longitudinal training studies where HRV recordings were >60 sec on a near-daily basis. In my experience, >60 sec measures are not feasible with teams. Therefore, it’s ~60 s or we don’t bother.
  • Should future research instead try to determine what are the best ways to perform a ~60 sec HRV measure to limit noise from confounding factors? How can we improve the validity and reliability of 60-sec measures? How long from food/fluid ingestion should we wait? Can we obtain this with PPG rather than HR straps? What is the best position to measure in? etc.

To be clear, I still think that research evaluating stabilization requirements and comparing to the ‘criterion’ is absolutely meaningful and an important starting point. This was not intended to be critical, but rather to open discussion on future research directions.


HRV responses to in-season training among D-1 college football players

During spring training camp, we found that Linemen demonstrate the greatest reductions in LnRMSSD at ~20 h post-training, followed by Mid-Skill and Skill, possibly reflecting inadequate cardiovascular recovery between consecutive-day sessions for the larger players, despite lower PlayerLoad values. (Full-text available here)

Our first follow-up study during the early  part of the competitive season found the same position-based trend, where Linemen demonstrated the greatest reductions in LnRMSSD at ~20 h post-training, followed by Mid-Skill and Skill. However, the magnitude of the reductions in LnRMSSD during the in-season were smaller relative to spring camp. We speculate that both reduced PlayerLoad values (15-22% lower than spring camp) and adaptation to intense preseason training in the heat and humidity during the preceding weeks account for the smaller LnRMSSD reductions observed during the early part of the competitive season. (Full-text available here: Cardiac_Autonomic_Responses_to_In_Season_Training_Among_Division1_College_Football_Players)

Cardiac-Autonomic Responses to In-Season Training Among Division-1 College Football Players.

Despite having to endure a rigorous in-season training schedule, research evaluating daily physiological recovery status markers among American football players is limited. The purpose of this study was to determine if recovery of cardiac-autonomic activity to resting values occurs between consecutive-day, in-season training sessions among college football players. Subjects (n = 29) were divided into groups based on position: receivers and defensive backs (SKILL, n = 10); running backs, linebackers and tight-ends (MID-SKILL, n = 11) and linemen (LINEMEN, n = 8). Resting heart rate (RHR) and the natural logarithm of the root-mean square of successive differences multiplied by twenty (LnRMSSD) were acquired at rest in the seated position prior to Tuesday and Wednesday training sessions and repeated over three weeks during the first month of the competitive season. A position × time interaction was observed for LnRMSSD (p = 0.04), but not for RHR (p = 0.33). No differences in LnRMSSD between days was observed for SKILL (Tuesday = 82.8 ± 9.3, Wednesday = 81.9 ± 8.7, p > 0.05). Small reductions in LnRMSSD were observed for MID-SKILL (Tuesday = 79.2 ± 9.4, Wednesday = 76.2 ± 9.5, p < 0.05) and LINEMEN (Tuesday = 79.4 ± 10.5, Wednesday = 74.5 ± 11.5, p < 0.05). The individually averaged changes in LnRMSSD from Tuesday to Wednesday were related to PlayerLoad (r = 0.46, p = 0.02) and body mass (r = -0.39, p = 0.04). Cardiac-parasympathetic activity did not return to resting values for LINEMEN or MID-SKILL prior to the next training session. Larger reductions in LnRMSSD tended to occur in players with greater body mass despite having performed lower workloads, though some individual variability was observed. These findings may have implications for how coaches and support staff address training and recovery interventions for players demonstrating inadequate cardiovascular recovery between sessions.

Figure 1

Our next paper, currently in production, will feature HRV responses among positions throughout the entire preparatory and competitive season.

HRV and Wellness responses to overload and taper in sprint-swimmers

Here’s a brief overview of our latest study capturing daily HRV and wellness ratings throughout overload and tapering in collegiate sprint swimmers preceding a championships competition.

The majority of research in the area has primarily focused on endurance athletes. It’s been a goal of mine for a while now to examine HRV responses in athletes participating in anaerobic events such as short-distance swimming.

The athletes completed wellness questionnaires and recorded HRV daily via smartphone and validated pulse-wave finger sensor (seated position) after waking. The observation period lasted 6-weeks which included 1 week of baseline, 2 weeks of overload and a progressive 3-week taper. The overload was characterized by a substantial increase in training intensity while overall volume varied by up to only 20%. Of the group, 2 athletes went on to compete in the 2016 Olympic summer games.

Full text link:

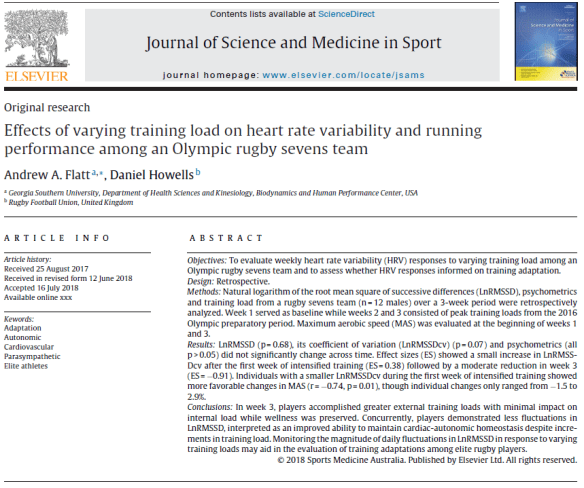
HRV and psychometric responses to overload and taper in collegiate sprint-swimmers 

OBJECTIVES:

The purpose of this study was to evaluate cardiac-parasympathetic and psychometric responses to competition preparation in collegiate sprint-swimmers. Additionally, we aimed to determine the relationship between average vagal activity and its daily fluctuation during each training phase.

DESIGN:

Observational.

METHODS:

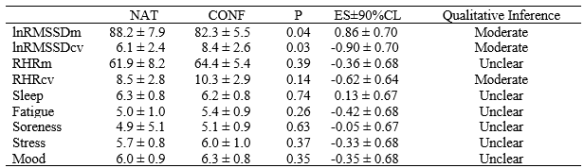
Ten Division-1 collegiate sprint-swimmers performed heart rate variability recordings (i.e., log transformed root mean square of successive RR intervals, lnRMSSD) and completed a brief wellness questionnaire with a smartphone application daily after waking. Mean values for psychometrics and lnRMSSD (lnRMSSDmean) as well as the coefficient of variation (lnRMSSDcv) were calculated from 1 week of baseline (BL) followed by 2 weeks of overload (OL) and 2 weeks of tapering (TP) leading up to a championship competition.

RESULTS:

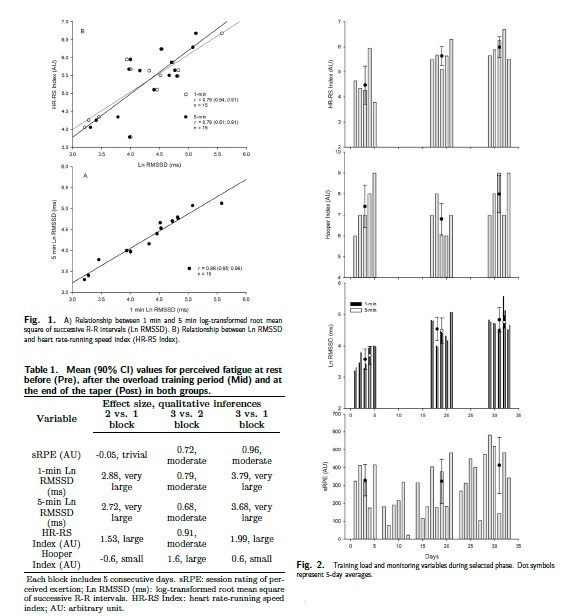
Competition preparation resulted in improved race times (p<0.01). Moderate decreases in lnRMSSDmean, and Large to Very Large increases in lnRMSSDcv, perceived fatigue and soreness were observed during the OL and returned to BL levels or peaked during TP (p<0.05). Inverse correlations between lnRMSSDmean and lnRMSSDcv were Very Large at BL and OL (p<0.05) but only Moderate at TP (p>0.05).

CONCLUSIONS:

OL training is associated with a reduction and greater daily fluctuation in vagal activity compared with BL, concurrent with decrements in perceived fatigue and muscle soreness. These effects are reversed during TP where these values returned to baseline or peaked leading into successful competition. The strong inverse relationship between average vagal activity and its daily fluctuation weakened during TP.

While group responses are certainly meaningful, the individual responses provide more meaningful information to practitioners. The figure below shows the individual trends from 3 athletes that exemplify 3 common training responses I’ve observed in a variety of athletes.

swim-trend-hrvtraining-blog

Subject B (middle) has the smallest CV at baseline and subsequently handles the overload very well, with minimal reductions in lnRMSSD. This indicates that Subject B is in great shape and could probably handle greater loads.

Subject C (bottom) displays what I would consider to be a very expected response to overloading. There is a considerable increase in daily lnRMSSD fluctuation (i.e., increased CV) and progressive but small decrease in the trend. I interpret this type of response to indicate that the loads are sufficient enough to provoke the fatigue/recovery process but not so high that HRV becomes suppressed. This is possibly indicative of a load/dose of training that is high but within the overall recovery capacity of the athlete.

Subject A (top) has the highest CV of the group at baseline and subsequently responds the least favorably to the overload. lnRMSSD pretty much crashes almost immediately and remains suppressed for several days (boxed data points). The coach pulled back on subject A due to high fatigue, reduced performance, decrements in pulse-rate recovery between sets, etc. The trend immediately improves until about 1-week out from competition at which point loads again were further reduced. Ultimately, this athlete improved upon previous best times at competition from that year, suggesting that the interventions were effective.

The main take-home would be that the typical response to intensified training includes a reduction and greater daily fluctuation in HRV, along with decrements in wellness scores. Athletes demonstrating different responses (i.e., minimal change in HRV trend or conversely chronic suppression of HRV) may be coping better or worse than expected. Coaches should then investigate and address factors contributing to the poor response.

The effect of training status on HRV in D-1 collegiate swimmers

When implementing HRV monitoring with a new team, the coach will be quick to point out the inter-individual variability in the athletes’ trends. Some athletes are showing high scores and some are low. Some are showing considerable daily fluctuation while others show very consistent numbers. Or, some show substantial fluctuation during this period but minimal fluctuation during that period. This can be confusing and difficult to interpret, but with some context, the trends (and changes therein) can usually be explained.

Greater fitness levels are associated with higher resting HRV and faster parasympathetic reactivation following exercise. This likely contributes to the smaller coefficient of variation  (CV) we (and others) have observed in athletes with higher VO2max and intermittent running performance. So if we were to categorize athletes of the same sport based on competitive level (i.e., training status), we should see group differences between their average lnRMSSD and CV. What makes our approach different from previous work is the longer observation period (1 month), the use of a finger sensor (PPG) and smartphone application using ultra-short HRV recordings for daily data acquisition and inclusion of the CV in the analysis. This was presented at the NSCA National Conference in New Orleans this July. Full manuscript in production soon.

THE EFFECT OF TRAINING STATUS ON HEART RATE VARIABILITY IN DIVISION-1 COLLEGIATE SWIMMERS

Andrew A. Flatt, Bjoern Hornikel, Michael R. Esco

University of Alabama, Tuscaloosa, AL

Resting heart rate variability (HRV) fluctuates on a daily basis in response to physical and psychological stressors and may provide useful information pertaining to fatigue and adaptation. However, there is limited research comparing HRV profiles between athletes of the same sport who differ by training status. PURPOSE: The purpose of this study was to compare resting heart rate (RHR) parameters between national and conference level Division-1 Collegiate swimmers and to determine if any differences were related to psychometric indices. METHODS: Twenty-four subjects were categorized as national (NAT, n = 12, 4 female) or conference level competitors (CONF, n=12, 5 female). Over 4 weeks, daily HRV was measured in the seated position by the subjects after waking and elimination with a validated smartphone application and pulse-wave finger sensor (app)  utilizing a 55-second recording period. Subjects then completed a questionnaire on the app where they rated perceived levels of sleep quality, muscle soreness, mood, stress and fatigue on a 9-point scale. The HR parameters evaluated by the app include RHR and the log-transformed root-mean square of successive RR interval differences multiplied by 20 (lnRMSSD). The 4-week mean for RHR (RHRm) and lnRMSSD (lnRMSSDm) in addition to the coefficient of variation (CV) for RHR (RHRcv) and lnRMSSD (lnRMSSDcv) were determined for comparison. In addition, psychometric parameters were also averaged between groups and compared. Independent t-tests and effect sizes ± 90% confidence limits (ES± 90% CL) were used to compare the HR and psychometric parameters. RESULTS: NAT was moderately taller (184.9 ± 10.0 vs. 175.5 ± 12.5 cm; p = 0.06, ES ± 90% CL = 0.83 ± 0.70) and heavier (80.4 ± 9.7 vs. 75.2 ± 11.9 kg; p = 0.26, ES ± 90% CL = 0.48 ± 0.67) than CONF, though not statistically significant. The results comparing HR and psychometrics are displayed in Table 1. lnRMSSDm and lnRMSSDcv was moderately higher and lower, respectively, in NAT compared to CONF (p<0.05). CONCLUSION: Higher training status is associated with moderately higher lnRMSSDm and lower lnRMSSDcv compared to those of lower training status. This was observed despite no significant difference in perceived stressors that may affect HR parameters. PRACTICAL APPLICATION: Training status appears to be a determinant of daily HRV and its fluctuation. This may be because higher level athletes are more fit and recover faster from training, resulting in a more stable HRV pattern. This information can be useful to practitioners when interpreting HRV trends in athletes. For example, an increase in HRV with reduced daily fluctuation may indicate improvements in an athletes training status. Alternatively, an athlete with high training status demonstrating reduced HRV and greater daily fluctuation may be showing signs of fatigue or loss of fitness depending on the context of the current training phase and program.

table swim HRV comarison

This figure shows a year of data from two athletes (Olympic level on top vs. Conference level on bottom) to provide a nice visual representation of their trend differences. HRV trend swim comparison

New Study: Intra- and inter-day reliability of ultra-short-term HRV in elite rugby union players

Here’s a look at our latest study in collaboration with Fabio Nakamura and colleagues, now in press with JSCR (Abstract below). In this study, HRV was recorded as a team at the training facility, not immediately after waking. This is the approach that many coaches are interested in using given the issue with compliance when trying to get athletes to perform HRV measures on their own at home after waking. Controlled and supervised measures at the facility appear promising, at least in these high level athletes.

It’s important to understand that autonomic activity is constantly making adjustments to physical, chemical and perceived psychological stimuli. Thus, HRV is inherently not the most reliable metric. However, training status/fitness appear to have a strong affect on day to day variation in HRV. More fit athletes recover faster/tolerate training better and thus tend to show less deviation from baseline compared to less fit athletes, of which will experience much greater homeostatic disruption from training and greater day to day variation. I strongly believe that the amount of daily fluctuation (i.e., lnRMSSDcv) is a very useful indication of fitness, stress and training adaptation.

We currently have a paper in production looking at the effect of training status on HRV. In the mean time, compare the trends below of an Olympic level and a conference level athlete, both short-distance swimmers (similar age and physical characteristics) across 4 consecutive weeks of training.

lnrmssd compareIntra- and inter-day reliability of ultra-short-term heart rate variability in rugby union players.

The aim of this study was to examine the intra-day and inter-day reliability of ultra-short-term vagal-related heart rate variability (HRV) in elite rugby union players. Forty players from the Brazilian National Rugby Team volunteered to participate in this study. The natural log of the root mean square of successive RR interval differences (lnRMSSD) assessments were performed on four different days. HRV was assessed twice (intra-day reliability) on the first day and once per day on the following three days (inter-day reliability). The RR interval recordings were obtained from 2-min recordings using a portable heart rate monitor. The relative reliability of intra- and inter-day lnRMSSD measures were analyzed using the intraclass correlation coefficient (ICC). The typical error of measurement (absolute reliability) of intra- and inter-day lnRMSSD assessments were analyzed using the coefficient of variation (CV). Both intra-day (ICC = 0.96; CV = 3.99%) and inter-day (ICC = 0.90; CV = 7.65%) measures were highly reliable. The ultra-short-term lnRMSSD is a consistent measure for evaluating elite rugby union players, in both intra- and inter-day settings. This study provides further validity to using this shortened method in practical field conditions with highly trained team sports athletes.

Full text on Research Gate

New Study: Individual HRV responses to preseason training in D-1 women’s soccer players

Here’s a brief look at a new paper of ours in press with JSCR. This is a very small study that we submitted as “Research Note” that looked at changes in HRV (via finger pulse sensor) and training load (via Polar Team2) across preseason training in D-1 women’s soccer players.

Full text link:

Individual HRV responses to preseason training in D-1 women’s soccer players

The purpose of this study was to track changes in training load (TL) and recovery status indicators throughout a 2-week preseason and to interpret the meaning of these changes on an individual basis among 8 Division-1 female soccer players. Weekly averages for heart ratevariability (lnRMSSD), TL and psychometrics were compared with effect sizes (ES) and magnitude based inferences. Relationships were determined with Pearson correlations. Group analysis showed a very likely moderate decrease for total training load (TTL) (TTL week 1 = 1203 ± 198, TTL week 2 = 977 ± 288; proportion = 1/2/97, ES = -0.93) and a likely small increase in lnRMSSD (week 1 = 74.2 ± 11.1, week 2 = 78.1 ± 10.5; proportion = 81/14/5, ES = 0.35). Fatigue demonstrated a very likely small improvement (week 1 = 5.03 ± 1.09, week 2 = 5.51 ± 1.00; proportion = 95/4/1; ES = 0.45) while the other psychometrics did not substantially change. A very large correlation was found between changes in TL and lnRMSSD (r = -0.85) while large correlations were found between lnRMSSD and perceived fatigue (r = 0.56) and soreness (r = 0.54). Individual analysis suggests that 2 subjects may benefit from decreased TL, 2 subjects may benefit from increased TL and 4 subjects may require no intervention based on their psychometric and lnRMSSD responses to the TL. Individual weekly changes in lnRMSSD varied among subjects and related strongly with individual changes in TL. Training intervention based on lnRMSSD and wellness responses may be useful for preventing the accumulation of fatigue in female soccer players.

FS_JSCR

Full Text on Research Gate

New Study: Monitoring weekly HRV in futsal players during the preseason

Here’s a quick look at our latest collaboration with Dr. Fabio Nakamura and colleagues, published in J Sport Sci: Sci Med Football. This paper nicely demonstrates the inter-individual variation in HRV responses to training in team sports. An interesting finding was the large negative relationship between the weekly mean of lnRMSSD and the weekly CV of lnRMSSD. Essentially, the athletes with higher HRV tended to show smaller daily fluctuations in HRV and vice versa. This is likely an effect of higher fitness, which we (and others) have touched on in previous studies.
ABSTRACT

This study aimed to compare the weekly natural log of the root-mean-square difference of successive normal inter-beat (RR) intervals (ln RMSSDWeekly) and its coefficient of variation (ln RMSSDCV) in response to 5 weeks of preseason training in professional male futsal players. A secondary aim was to assess the relationship between ln RMSSDWeekly and ln RMSSDCV. The ln RMSSD is a measure of cardiac–vagal activity, and ln RMSSDCV represents the perturbations of cardiac autonomic homeostasis, which may be useful for assessing how athletes are coping with training. Ten futsal players had their resting ln RMSSD recorded prior to the first daily training session on four out of approximately five regular training days·week−1. Session rating of perceived exertion (sRPE) was quantified for all training sessions. Despite weekly sRPE varying between 3455 ± 300 and 5243 ± 463 arbitrary units (a.u.), the group changes in ln RMSSDWeekly were rated as unclear (using magnitude-based inference), although large inter-individual variability in ln RMSSD responses was observed. The ln RMSSDCV in weeks 4 and 5 were likely lower than the previous weeks. A large and significant negative correlation (r = −0.53; CI 90%: −0.36; −0.67) was found between ln RMSSD and ln RMSSDCV. Therefore, monitoring individual ln RMSSD responses is suggested since large inter-individual variations may exist in response to futsal training. In addition, higher values of ln RMSSD are associated with lower oscillations of cardiac autonomic activity.

HRV futsal Fig 1

Full Text on Research Gate

New Podcast: Discussing Smartphone HRV Apps

I recently had a chance to sit down and discuss all things HRV monitoring with James Darley of the Historic Performance Podcast. There’s also a number of great interviews in the podcast archives worth checking out.

Topics discussed:

  • Background
  • Physiological basis for HRV as a recovery status metric
  • Preferred HRV parameter for athletes
  • HRV recording methodology (position, conditions, time of day, etc.)
  • Considerations for chosing the right HRV app for your situation
  • Recent research
  • Interpreting HRV data

Link to Podcast with show notes 

Show in Overcast App