Reflections, Thoughts & Some HRV Data Analysis from 2 Athletes

This week Carl Valle had a great article posted on Mladen’s site here. It’s definitely worth the read if you train athletes. This article inspired me to reflect on where HRV fits in to training, for whom it may work best for and why. I monitor HRV in a very small number of athletes who are the minority of the overall pool of athletes I work with.

To get the most out of HRV tracking, I believe it should be measured daily, in the morning after waking. With ithlete this requires less than 2 minutes of your time to perform the measurement and make any comments, input training load, etc. Though this is a simple task, it is not easy to get full compliance from individuals. Therefore, I don’t even consider getting an athlete taking measurements unless he possesses a great deal of intrinsic motivation, is responsible, reliable, and perhaps most importantly, is interested. Though I would prefer they know nothing about the device, it’s hard to convince people to commit to using it every day if they don’t understand why. After a few sessions I will mention it to them and give them some basic details. If they appear interested or ask if they can use it then it’s a go.

I have several motivations for tracking HRV in select athletes. Below, these motivations are listed with some follow-up thoughts and elaborations.

  • To observe ANS response to training, daily stressors, recovery modalities, etc.

What was HRV score the day following a workout? What else did the athlete do that day that may influence this score? What has the overall trend been that week (positive or negative)?  I like to compare HRV score to other training status markers like strength levels (did he hit target weights for the day?), movement ability (how does he look during warm-ups, jumps, etc.?), perceived recovery/readiness levels (Does he feel great when HRV is high, when its low?), etc.

This motivation serves two purposes.

  1. It gets the athlete more engaged in his life style and training (more on this in a bit)
  2. It satisfies my curiosity. I’ve got questions I want answered.
  • To observe HRV trends over times of illness, injury, etc. to determine if there were early warning signs in the trend and if the trend reflects recovery/return to play readiness.

In the event of an injury during practice or competition, what was the trend indicating? In the past year or so I hurt myself once during training and it happened with 60% of my 1RM during squats (hardly a threatening situation). My HRV that day was well below baseline. Possibly a coincidence, or possibly injury risk is heightened when HRV is really low. To my knowledge, there is no research on this in human athletes, but this seems to be the case in race horses. I discussed some very interesting research by Dr. Christine Ross in this post from last winter.

Here’s an excerpt from that post.

“Dr. Christine Ross monitored the HRV of 16 competitive race horses, all of which were in training. Of the 16, 13 had HRV readings that were associated with pain, fatigue, illness or injury. It was stated that even though the horses appeared healthy and energetic, they were considered “at risk” based on their HRV. There were no outward signs or symptoms to suggest these horses were currently sick or hurt. Within 3 months, 12 of the 13 at-risk horses got injured or sick requiring veterinary intervention and cessation of race training.”

Furthermore, I work with plenty of football players and hockey players who by nature are at risk of concussion. What insight can HRV provide regarding recovery and return to play after concussion? (Perhaps a post on this in the future)

  • In rare cases, to manipulate training if HRV has been consistently below baseline and the athlete displays signs of fatigue.

This is an interesting topic. Working with an athlete is rarely long term. In many cases you may only have 6-8 straight weeks of consistent training before interruption. That means we need to get them better quickly. Getting better can be defined in many ways but in the training realm this means improving strength, speed, power, work capacity, etc. To do this we need to apply stress. In some cases, a lot of stress, of various kinds. Naturally, HRV will drop. The organism has to work hard to adapt to the stress (and thus improve). We don’t have time to wait for “optimal” recovery and this is likely not even desirable.

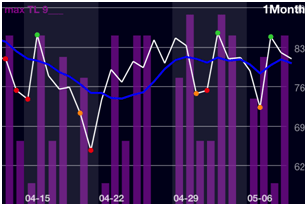
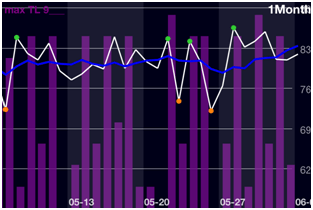
Let me use an example. Below is the HRV trend of a 25 year old hockey player I’m working with. He’s come to me to get in shape for a try-out he’s been invited to for a pro team in Germany.

A.E.Trend

He is a former NCAA hockey player and has been training relatively consistently throughout school. After this summer he thought he was done with competitive hockey and stopped training however he did start playing men’s league hockey.  Since he hasn’t been training I knew we’d probably see some pretty big downward deflections after our first few workouts. He missed a few mornings of HRV measurements but it’s been about 2 weeks since we started. The “week change” is -8 and his HRV trend is steadily decreasing. His strength is steadily improving as is his conditioning. He’s adapting fast and re-acquiring lost strength and fitness. Training loads are steadily increasing every week. Now that it’s Christmas I expect to see his HRV bump back up due to some extra rest and likely extra calorie intake. So long as HRV approaches baseline levels after a few days of rest then I think things are looking good. However, if HRV continues downward I will evaluate performance markers and make adjustments if necessary. The physical stress load is high as reflected by his HRV but it’s only been 2 weeks and his performance markers are improving. The weekly trends will likely continue to decrease until about 2 weeks out from the try-out at which point I’ll steadily reduce loads. HRV should climb back up and fatigue should dissipate. This is what happens when I have a relatively short period of time to work with an athlete.

In contrast, the trend below is of a high school sprinter I’m working with. He trains with his sprint coach and works with me for recovery/restoration, mobility, etc. He has a sub 11s 100m time and is one of the fastest high school sprinters in Canada. He is much more long term and his training load reflects that. His weight training volume has been reduced quite a bit and has transitioned into more sprint work and power development in the weight room (controlled and implemented by his Sprint Coach).

ZW Trend

This is an athlete who takes care of himself and is extremely motivated to get better, to say the least. He reports that training is going well, he’s hitting PR’s and it looks as though he’s handling training almost too well. Higher loads would be likely well tolerated. If I can just start getting him to get to bed at a decent hour on weekends he’ll be doing everything right.

In both cases the athletes have learned how lifestyle factors outside of training effect their recovery, soreness levels, etc. This is directly attributed to seeing their HRV trend, recognizing what events may have caused the additional stress and re-evaluating there decision making. One of the main things I like about HRV is that it forces you (and the athlete) to be more engaged in the process. It allows them to see how their actions (good or bad) can effect the quality of their training and their progress.

Final Thoughts

Having HRV records as an objective measure of training status helps guide the training process when taken with other markers of performance and fatigue. If the athlete is a high level athlete, mature enough to handle daily measurements and wants to use it then I am all for it. I don’t use it with many athletes because it would be a waste of time and energy for both parties. However, with the right athletes it can be a great tool to for monitoring training.

HRV Values: Indications of Training Readiness

In my recent articles on HRV in Team Sports, I discussed the idea of having our athletes report to pre-season camp with favorable autonomic profiles prior to the initiation of intensive training. The goal of this being to enhance adaptation and reduce injury potential. Today I’d like to delve into this topic a little deeper.

First I’d like to review some important research that helped form the basis of this thought process. Other, more intelligent minds thought of this stuff way before I did and have produced what I consider to be, some pretty compelling research.

Research

Vesterinen and colleagues (2011) found that recreational endurance runners who had high baseline HRV levels prior to intensive training improved their performance significantly more than runners who had low baseline HRV levels prior to training.

Oliveira and colleagues (2012) found a strong correlation between parasympathetic indices of HRV (analyzed before training) with the performance improvement in Yo-Yo IR1 in soccer players during pre-season training.

Hedelin and colleagues (2001) set out to investigate relationships between HRV and central and peripheral performance measures in various trained endurance athletes over a 7 month period. The authors reported that; “higher parasympathetic activity, at least in these fit subjects, rather was a cause than an effect of a further increase in aerobic fitness.”

Kiviniemi et al (2007) found that in fit males, training when HRV levels are at baseline or above results in significantly higher improvements in maximum running velocity and greater improvements in vo2 max compared to a group that followed pre-planned training, of which saw insignificant changes in both measures.

In a repeat study Kiviniemi et al (2010) included female groups and found that females take longer to recover from a training session and that fitness can be improved with fewer high intensity training days when guided by HRV compared to the pre-planned training group

Hautala et al (2003) reported that baseline HF Power was the most powerful determinant of future training response in healthy subjects. I strongly urge interested readers to read through this review by Hautala et al (2009) for a thorough discussion on this topic.

I’m certain I’m leaving out some good research but I think you get the idea. There is evidence to suggest that HRV levels can be a good indicator of training response in athletes and fit individuals.

Discussion

A couple issues I’m having with the evidence as it applies to team sport settings;

  1. HRV measurement is different in much of the research. Some is nocturnal, some is morning, etc. Therefore, we can’t say for certain if we can draw similar conclusions based on a morning measurement if the researchers used nocturnal HRV measurements. Having said that, I do feel that morning measurements are sufficient, if not optimal.
  2. The research mostly pertains to aerobic athletes and aerobic training. However, given that most team sports require a sufficient level of aerobic capacity I still think the discussed research offers valuable information. Even in a sport like American Football, many of the drills are serial and repetitive in nature and thus places a greater dependence on energy production from aerobic metabolism. Further, repeated sprint ability is related to oxygen uptake during rest periods (Dupont et al. 2010).

It appears that having a high level of resting parasympathetic tone prior to intensive training results in more favorable responses and performance improvements in athletes. The research suggests that HRV levels appear to reflect adaptive potential. It should be of high priority to the coaching staff that players remain healthy throughout training. Keeping tabs on HRV levels throughout training, taken with other measures of training status, may reveal maladaptation and therefore a necessitation for intervention.

I’d personally like to see HRV levels monitored in Collegiate American Football players throughout pre-season training camp. It’s conceivable that injury risk is heightened in athletes showing consistent decrements in HRV. It surprises me that there is very little research on HRV and injury (risk, recovery, return to play, etc) in comparison to HRV and performance enhancement/monitoring.

Whether or not we can apply this to strength/power athletes is not clear as there is very little research on this. It’s been a personal goal of mine to investigate this issue and I hope to do this at some point in the future.

Provided that athletes are engaging in training throughout the off-season having a high level of parasympathetic tone at rest shouldn’t be an issue. Team sport athletes will generally have low resting heart rates and a high work capacity. The concern would be with athletes that are either not preparing themselves for intense training, or with those that may be over doing it.

Apart from aiming to have high HRV levels prior to training we may also want to use HRV as an indicator of recovery status day to day. During intense training periods, recovery and restoration modalities can aid in parasympathetic re-activation and therefore more rapid recovery. Paying closer attention to nutritional strategies, active recovery, cold water immersion (a controversial topic at the moment it seems) sleep quality and duration, etc. may help us in maintaining favorable ANS activity; perhaps a topic for another day.

References:

Dupont, G., et al. (2010) Faster oxygen uptake kinetics during recovery is related to better repeated sprint ability. European Journal of Applied Physiology, (110)3: 627-34

Hautala, A.J., et al. (2003) Cardiovascular autonomic function correlates with the response to aerobic training in healthy sedentary subjects. American Journal of Heart & Circulatory Physiology, 285(5): H1747–52.

Hautala AJ, et al. (2009)Individual responses to aerobicexercise: the role of the autonomicnervous system. Neuroscience & Biobehavioral  Reviews, 33(2): 107–115.

Hedelin, R. et al. (2001) Heart Rate Variability in athletes: relationship with central and peripheral performance. Medicine & Science in Sports & Exercise, 33(8), 1394-1398.

Kiviniemi, A.M., Hautala, A., Kinnumen, H., & Tulppo, M. (2007) Endurance training guided by daily heart rate variability measurements. European Journal of Applied Physiology, 101: 743-751.

Kiviniemi, A.M., Hautala A.J., Kinnunen, H., Nissila, J., Virtanen, P., Karjalainen, J., & Tulppo, M.P. (2010) Daily exercise prescription on the basis of HR variability among men and women. Medicine & Science in Sport & Exercise, 42(7): 1355-1363.

Oliveira, RS. et al. (2012b) The correlation between heart rate variability and improvement in soccer player’s physical performance. Brazilian Journal of Kinanthropometry, 14(6)

Vesterinen, V. et al. (2011) Heart rate variability in prediction of individual adaptation to endurance training in recreational endurance athletes. Scandinavian Journal of Medicine & Science in Sports, DOI: 10.1111/j.1600-0838.2011.01365.x

HRV in a Team Setting: Follow-up Thoughts

Today I am going to share some thoughts on why I think HRV is useful for monitoring athletes individually or in team settings. However, I will state upfront that among the research, HRV analysis varies a great deal in important variables such as; position, time of day, duration of measurement, frequency of measurements, analysis (time domain, frequency domain) and populations (type of athlete, gender, age, etc.).  Therefore, the monitoring of a specific variable (performance, recovery, stress, etc.) requires careful consideration of methodology. I would also like to make it abundantly clear that HRV monitoring is most effective when considered with other variables (RPE, POMS, etc.).

For the purposes of safe, effective and efficient improvement in sport performance, HRV monitoring can be extremely valuable. As a non-invasive measure of autonomic status, HRV provides an objective measure of the collective stress load (emotional, physical, and physiologic) that an athlete carries.

HRV and Training Load

I’d like to preface this section by saying that although HRV reflects training load reasonably well, we need to be careful of not being too presumptuous. The ANS is an incredibly complex system that is impacted by damn near everything we do and experience (training, nutrition, emotion, etc.). Therefore, being cognizant of our athletes stresses (or of our own if we use HRV for our own training) outside of sport is critical. Looking for a perfect correlation between training load and HRV score is not looking at the big picture.  I was guilty of this in the past.

In a team setting, athletes are often subjected to the same workloads, be it in the weight room or on the field. Monitoring individual responsiveness to training provides coaches with a handle on training program efficiency and quality of effect.

  • What does HRV alone tell us?

My understanding of HRV is that once baseline is established (though baseline is not static) HRV reflects autonomic balance. An imbalance indicates stress. For example; If parasympathetic tone is unusually low or high compared to baseline values, something is going on; a red flag.

ans_imbalance

  • Analysis:

Through monitoring of training volumes/load, self reported stress, etc. we can try and assume the cause of the imbalance.  What can the change in HRV be attributed to? It is likely a combination of the physical and mental stress of training/sport however this may require further investigation. Tracking performance markers and other variables in conjunction with HRV will allow for an appropriate mode of action for a red flagged or “at-risk” athlete.

From my understanding of the research we can associate certain changes in HRV patterns with a specific interpretation.

  • Small but consistent decrements in HRV over a training period: training loads are appropriate as fatigue is expected to accumulate but not to an unreasonable level.
  • Large changes in HRV over a training period: This is a red flag. There is a marked imbalance indicating high stress. Reduce loads until HRV approaches baseline values.
  • No change or small increases in HRV over a training period: Training stress levels are below the athletes capacity and therefore increased loads will likely be well tolerated.

I must reiterate that other measures of performance and training status should obviously be considered before trying to infer any meaning from an HRV score.

For those using ithlete or bioforce keeping tabs on the weekly and monthly changes can be extremely valuable as this gives a better idea of overall patterns. I picked this tip up from Joel Jamieson at the CVSPS last spring.

In a perfect world, our athletes report to pre-season camp in shape. A high level of fitness is typically associated with high HRV, lower resting heart rates and a high tolerance to physical stress (fast recovery) – I realize I’m preaching to the choir here.

Furthermore, it appears that better conditioned athletes handle inflammation better (Martin-Sanchez et al. 2011) or is this a genetic thing? We know elite athletes typically have good genetics (for their craft); does this include more favorable inflammatory responses and is this common among most elite athletes? Perhaps someone can chime in on this? Regardless, this is important because there is a strong link between inflammation and HRV (Kylosov et al. 2009, Thayer 2009, Soares-Miranda 2012).

Continuing with our hypothetical situation; these conditioned athletes should respond well to the high volumes of training. In contrast, less conditioned athletes will become easily overloaded from the commencement of pre-season training and may be at a greater risk of injury, premature overreaching, emotional distress, etc.

This was what I was trying to get at when I was thinking about the possibility of trying to create favourable autonomic profiles of athletes prior to intensive training. The concept isn’t new as we are insistent that our athletes train over the summers and prepare for camp. Monitoring HRV throughout this time may be a good indicator of physical condition. We want to see HRV profiles that indicate a high level of fitness and tolerance for stress.

This leads me to the next topic…

Practicality

Referring back to the CVSPS last spring I distinctly remember Landon Evans say during his presentation something to the effect of; “Come on guys, HRV in the collegiate setting? Really?”. He’s absolutely right. Monitoring HRV in the collegiate setting is not easy! It’s especially difficult if you are responsible for multiple teams. Football players may in fact be the hardest group of athletes to get HRV data from.

Having said this, I believe that it can be done if it’s important enough to you and the coaching staff. This doesn’t mean you’ll get all 100 guys on the roster taking measurements, but perhaps starting with key players, starters, etc. is more realistic. Dealing with smaller teams (basketball, volley ball, tennis, etc.) is a bit more doable but a challenge nonetheless.

If using HRV as a monitoring tool is important to you, start small and progress from there. Every coach will have different resources and circumstances and therefore it’s hard to generalize. I look forward to the release of the ithlete Team HRV system as this will make this process much easier. From my understanding of the product, athletes will be able to take their measurement at home on their smart phone and the data will automatically be uploaded to a web based interface that will allow the coaches/sports medicine staff to see all players’ trends on the same chart. Red flagging at-risk athletes will be much easier and quicker with this system.

Wrap UP

Is HRV an effective monitoring tool? I think it is. Based on personal experience and the research, there is quite a bit of evidence to support its efficacy. Taking into consideration other measures of performance and training status HRV gives you an important and objective measure of the athletes overall stress levels.

However, I urge all readers to keep in mind that I am not an expert on this stuff. I theorize a lot so take my articles with a grain of salt. For all I know, there are several researchers over in Europe cursing my name for completely misinterpreting their research. Hopefully this isn’t the case.

I will write on this topic again in the future as I still have plenty of thoughts on the issue. Only so much can be discussed in one article. Thoughts for another time: HRV and performance prediction, HRV and injury, HRV as an early warning sign and more.

I decided not to discuss and cite a ton of research today since I’ve done this in plenty of previous posts. Instead I will just provide references as recommended reading so I don’t come off as baseless in my thoughts and allows readers to investigate this topic for themselves.

Further Reading/References in Team Settings:

Baumert, M. et al. (2006) Changes in heart rate variability of athletes during a training camp. Biomed Tech, 51(4): 201-4.

Cipryan, L. & Stejskal, P. (2010) Individual training in team sports based on ANS activity assessments. Medicina Sportiva, 14(2):  56-62 Free Full-Text

Cipryan, L., Stejskal, P., Bartakova, O., Botek, M., Cipryanova, H., Jakubec, A., Petr, M., & Řehova, I. (2007)  Autonomic nervous system observation through the use of spectral analysis of heart rate variability in ice hockey players.  Acta Universitatis Palackianae Olomucensis. Gymnica, 37(4): 17-21. Free Full-Text

Di Fronso, S. et al. (2012) Relationship between performance and heart rate variability in amateur basketball players during playoffs. Journal for Sports Sciences & Health, 8 (Suppl 1):S1–S70 45

Dranitsin, O. (2008) The effect on heart rate variability of acclimatization to a humid, hot environment after a transition across five time zones in elite junior rowers. European Journal of Sport Science, 8(5): 251-258 Abstract

Edmonds, RC., Sinclair, WH., and Leicht, AS. (2012) Theeffect of weekly training and a game on heart rate variability in elite youth Rugby League players. Proceedings of the 5th Exercise & Sports Science Australia Conference and 7th Sports Dietitians Australia Update. 5th Exercise & Sports Science Australia Conference and 7th Sports Dietitians Australia Update Research to Practice , 19-21 April 2012, Gold Coast, QLD, Australia , p. 183. Abstract

Hap, P., Stejskal, P. & Jakubec, A. (2010) Volleyball players training intensity monitoring through the use of spectral analysis of HRV during a training microcycle. Acta Universitatis Palackianae Olomucensis. Gymnica, 41(3): 33-38 Free Full-Text

Iellamo, F., Pigozzi, F., Spataro, A., Lucini, D., & Pagani, M. (2004) T-wave and heart rate variability changes to assess training in world class athletes. Medicine & Science in Sports and Exercise, 36(8): 1342-1346. Abstract

Ke-Tien, Y.(2012) Effects of Cardiovascular Endurance Training Periodization on Aerobic performance and Stress Modulation in Rugby Athletes. Life Science Journal, 9(2): 1218-25. Full-Text

Martin-Sanchez, F. (2011) Functional status and inflammation after preseason training program in professional and recreational soccer players: a proteomic approach. Journal of Sports Science & Medicine, 10: 45-51 Free Full-Text

Mazon, J. et al. (2011) Effects of training periodization on cardiac autonomic modulation and endogenous stress markers in volleyball players. Scandinavian Journal of Medicine & Science in Sports, doi: 10.1111/j.1600-0838.2011.01357.x Free Full-Text

Oliveira, RS. et al. (2012a) Seasonal changes in physical performance and HRV in high level futsal players. International Journal of Sports Medicine. DOI: 10.1055/s-0032-1323720 Abstract

Oliveira, RS. et al. (2012b) The correlation between heart rate variability and improvement in soccer player’s physical performance. Brazilian Journal of Kinanthropometry, 14(6) Abstract

Parrado, E.  et al. (2010)Percieved tiredness and HRV in relation to overload during a field hockey world cup. Perceptual and Motor Skills, 110(3): 699-713 Abstract

Rodas, G. et al. (2011) Changes in HRV in field hockey players during the 2006 World Cup.Apunts Medicina de l’Esport, (46): 117-123 Abstract

Vantinnen, T. et al. (2007) Practical experiences from measuring exercise intensity and recovery state with HR monitoring in team sport. Symposium Proceedings 6th IACSS Calgary, Alberta. Full-Text


Further Reading/References in athletes thought not necessarily in team settings:

Atlaoui, D. et al. (2007) Heart rate variability training variation and performance in elite swimmers. International Journal of Sports Medicine, 28(5): 394-400

Bosquet, L., Merkari, S., Arvisais, D., Aubert, A.E. (2008) Is heart rate a convenient tool to monitor over-reaching? A systematic review of the literature. British Journal of Sports Medicine, 42(9): 709-714.

Botek, M. et al. (2012) Return to play after health complications associated with infection mononucleosis guided on ANS activity in elite athlete: a case  study. Gymnica, 42(2)

Buchheit, M. et al (2009) Monitoring endurance running performance using cardiac parasympathetic function. European Journal of Applied Physiology, DOI 10.1007/s00421-009-1317-x

Chen, J., Yeh, D.,  Lee, J., Chen, C.,  Huang, C.,  Lee, S., Chen, C.,  Kuo, T., Kao, C., & Kuo, C. (2011) Parasympathetic nervous activity mirrors recovery status in weightlifting performance after training. Journal of Strength and Conditioning Research, 25(6):  1546-1552

Hedelin, R., Bjerle, P., & Henriksson-Larsen, K. (2001) Heart Rate Variability in athletes: relationship with central and peripheral performance. Medicine & Science in Sports & Exercise, 33(8), 1394-1398.

Hellard, P., et al. (2011) Modeling the Association between HR Variability and Illness in Elite Swimmers. Medicine & Science in Sports & Exercise, 43(6): 1063-1070

Huovinen, J. et al. (2009) Relationship between heart rate variability and the serum testosterone-to-cortisol ratio during military service. European Journal of Sports Science,9(5): 277-284

Kiviniemi, A.M., Hautala, A., Kinnumen, H., & Tulppo, M. (2007) Endurance training guided by daily heart rate variability measurements. European Journal of Applied Physiology, 101: 743-751.

Kiviniemi, A.M., Hautala A.J., Kinnunen, H., Nissila, J., Virtanen, P., Karjalainen, J., & Tulppo, M.P. (2010) Daily exercise prescription on the basis of HR variability among men and women. Medicine & Science in Sport & Exercise, 42(7): 1355-1363.

Kylosov, AA. et al. (2009) Changes in inflammatory activity, heart rate variability, and biochemical indices in young athletes during the regular training cycle. Human Physiology, 35(4): 465-478.

Manzi, V. et al (2009) Dose-response relationship of autonomic nervous system responses to individualized training impulse in marathon runners. American Journal of Physiology, 296(6): 1733-40

Mourot, L. et al (2004) Decrease in heart rate variability with overtraining: assessment by the Poincare plot analysis. Clinical Physiology & Functional Imaging, 24(1):10-8.

Nigam, A.K. (2010) Resting heart rate and overtraining in athletes. International Referred Research Journal, 2(21): 38-40.

Pichot, V., Busso, T., Roche, F., Gartet, M., Costes, F., Duverney, D., Lacour, J., & Barthelemy, J. (2002) Autonomic adaptations to intensive overload training periods: a laboratory study. Medicine & Science in Sports & Exercise, 34(10), 1660-1666.

Soares-Miranda, L. et al. (2012) High levels of C-reactive protein are associated with reduced vagal modulation and low physical activity in young adults. Scandinavian Journal of Medicine and Science in Sports, 22(2): 278-84

Thayer, J. (2009) Vagal tone and the inflammatory reflex. Cleveland Clinic Journal of Medicine, 76(2): 523-526

Tian, Ye. et al. (2012) HRV threshold values for early warning non-functional overreaching in elite women wrestlers. Journal of Strength and Conditioning Research, Published ahead of print

Uusitalo, A.L.T., et al (2000) Heart rate and blood pressure variability during heavy training and overtraining in the female athlete. International Journal of Sports Medicine, 21(1): 45-53

HRV Monitoring in a Team Setting: The Research

Though my original interest in HRV monitoring was for personal usage with my powerlifting training (and still is), I have become much more interested in its application with my athletes. In July, I wrote a post discussing some of the research and my thoughts on HRV in a team setting. I’ve come across some more great research that pertains to HRV monitoring in team settings and would like to share some thoughts on the topic.

Below is a  list of questions I’d like to address:

  • How effective is HRV monitoring in a team setting really?
  • What difference is there, if any, when monitoring HRV in elite vs. sub-elite athletes?
  • How practical is HRV monitoring in a team setting?
  • Can we create favorable autonomic profiles in athletes prior to intensive training blocks to improve global (all players) responsiveness to training? (to avoid injury, overtraining, etc)
  • How can we apply research that used frequency domain measures (HF, LF, HF/LF) with mobile apps/devices like ithlete and Bioforce that use RMSSD, a time domain measure of parasympathetic tone?

Keep in mind that I do not train elite athletes and therefore much of what I discuss is based on my interpretations of the research, discussions I’ve had with others and some theory. I certainly am not capable of providing answers to any of the above question.

First, I’d like to present brief summaries of the research I’ve read on the topic. I’ve only included studies that used HRV to monitor fatigue, training load, etc. At this time I’m not including studies using HRV during exercise, or post-exercise.

In some cases I could not get access to the full-text which you will see noted in the respective tables. Please enlighten me of any research on this topic I may have not included. I apologize for the poor presentation of the table’s below. I originally had all of this in a more reader friendly format in Word but for some reason it does not transfer over to wordpress very well.

Author Ke-Tien (2012)
Sport Male, National Level Rugby (n=24)
Aim To verify biological and psychological stress markers during strenuous cardiovascular endurance training periodization, using Profile of Mood States questionnaires, HRV & blood urine nitrogen as the criteria measurements.
Main Findings HRV correlated to profile of mood states survey and blood-urnine nitrogen in elite male national rugby players (n=24).
HRV Analysis Non-daily, Frequency Domain
Author Edmonds et al. (2012)
Sport Male, Elite Youth Rugby (n=9)
Aim To investigate the influence of weekly training & a competitive game on HRV in elite youth rugby league players, & to identify the importance of HRV as a monitoring tool for Rugby League player preparation.
Main Findings Prior to a match, elite youth, players exhibited a significant reduction in HRV that was sustained for at least 24 hours post-game. This withdrawal of parasympathetic &/or increased sympathetic control of HR possibly may result from pre-match anxiety as well as the physical demands of the game. Strong relationships between HRV and training load at Pre-2 indicate that early monitoring may assist in identifying training workloads for the upcoming week.
HRV Analysis Daily, Time & Frequency Domain
Author Oliveira et al. (2012a)  – Abstract Only
Sport Male, Elite Futsal (n=11)
Aim The aim of this study was to determine the changes in physical performance and resting heart rate variability (HRV) in professional futsal players during the pre-season and in-season training periods.
Main Findings Players improved their RSA & Yo-Yo IR1 performance with concomitant improvements in HRV. These indices were maintained during the in-season period while RSAbest was improved & RSAdecrement impaired. Frequent monitoring of these performances and HRV indices may assist with identification of individual training adaptations and/or early signs of maladaption.
HRV Analysis Non-daily, Unknown
Author Vantinnen et al. (2007)
Sport Male, Elite Soccer (n=24)
Aim To introduce a method commonly used in Finnish sport to monitor the exercise intensity & changes in recovery state of players in team sports by examining their heart rate (HR/HRV) responses to training & relaxation stimulus.
Main Findings Individual differences do exist in practices & games. This would imply that coaches need to quantify each game or practice exercise intensity & recovery for each individual, in order to organize & optimally prepare an individual training plan for each athlete.
HRV Analysis Various over 3 weeks (daily, nocturnal, 24 hr), Time and Frequency Domain
Author Oliveira et al. (2012b) – Abstract Only
Sport Male, Caliber Unknown, Soccer (n=10
Aim The aim of this study was to analyze whether the heart rate variability (HRV), assessed at the beginning of a soccer preseason, reveals a correlation with the improvement of physical performance over this training period.
Main Findings There were significant improvements in Yo-Yo IR1 performance & in the 30-m sprint time. The qualitative analysis revealed that the differences in Yo-Yo IR1 performance were very likely positive, were almost certainly positive for the sprint, but were inconclusive for the vertical jump. There was a strong correlation between one parasympathetic index and the change in performance. The study showed a strong correlation between parasympathetic indices of HRV with the performance improvement in Yo-Yo IR1 in the athletes during pre-season.
HRV Analysis Non-daily, Unknown
Author Rodas, G. et al. (2011) – Abstract Only
Sport Elite, Field Hockey (n=? entire team)
Aim To determine the changes in HRV during the 2006 World Cup
Main Findings HRV decreases progressively & the values of the parameters related to parasympathetic system activity (RMSSD & HF) reduce, which are indicative of good psychic-physical adaptability to the workload. At the same time, the value of the parameters related to sympathetic system activity (LF and LF/HF) increases, suggesting an increase in fatigue, tiredness and poor adaptability in general. Consequently, the analysis of HRV may be a good marker for monitoring the psychic-physical state, cardiovascular adaptability during exercise & a possible state of physical overload in athletes participating in competitions.
HRV Analysis Day of competitions only – Time and Frequency Domain
Author Martin-Sanchez et al. (2011)
Sport Male Pro Soccer (n=12) & Age/Sex matched Amateur Soccer (n=9)
Aim To determine if an intensive preseason training program modifies the inflammatory status in professional soccer players and if this inflammatory profile may be associated with the physical state.
Main Findings A negative association between cardiac low frequency & the plasma content of alpha-1 antichymotrypsin isotype 4, & a positive association between cardiac low frequency & fibrinogen gamma-chain isotype 3 was found. Our results suggest that the cardiac functional state of soccer players may be correlated with these proteins. Pro soccer players showed a decreased content of circulating proteins associated with inflammation compared with those in recreational soccer players.
HRV Analysis Morning of analysis – Time and Frequency Domain
Author Cipryan et al. (2010)
Sport Male, Hockey Junior Level (n=8), Adult (N=10)
Aim To present inter-individual differences in the reaction of autonomic nervous system (ANS) activity to the same training program, and to thereby support the importance of individual training in team sports during the conditioning period.
Main Findings The SA HRV monitoring mostly revealed significant differences in the level of the ANS activity among the players. A number of junior & adult players were characterized by almost permanently high ANS activity whereas other players occurred below the ANS activity level of healthy individuals.  The training efficiency (overreaching and injury reduction) can be positively influenced by creating training groups of players with similar ANS activity.
HRV Analysis Non-daily – Frequency Domain
Author Cipryan et al. (2007)
Sport Male, U-18 National Level Hockey (n=4)
Aim To investigate the influence of regular sport training on the activity of the autonomicnervous system (ANS) and to disclose patterns of interrelations between them.
Main Findings The results demonstrated that the player with the highest average TS (total score)& the highest average PT(total power) also showed the most consistent results & objectively the best performance in sport. On the other hand, the player with the lowest average TS and the lowest average PT also obtained the lowest average mark in the coach’s evaluation of his sports performance. The tendency to progression of the ANS  activity was different for each subject. The self-reports health status survey, which was given before measurements were taken, did not correspond with the results of the SA HRV measurement.
HRV Analysis Non-daily, Frequency Domain
Author Hap et al. (2010)
Sport Male, High Level Volleyball (n=8)
Aim The goal of the work was to verify the possibility of volleyball playersʼ training load optimization during a one week training microcycle based on the longitudinal observation of dynamics of SA HRV complex indices.
Main Findings 2 Players had above average levels ANS activity indicating higher training loads could be tolerated.4 Players had low ANS activity (but not below average) showing evidence of some fatigue and adaptation. Training loads are appropriate.

2 Players had below average ANS activity and their training adaptability was reduced.

HRV Analysis Daily – Frequency Domain
Author Parrado et al. (2010) – Abstract Only
Sport Elite, Field Hockey (n=? entire team)
Aim The aim of the study was to examine the utility of perceived tiredness to predict cardiac autonomic response to overload among feld hockey players during the 2006 World Cup.
Main Findings Results showed a negative correlation between perceived tiredness scores & time domain indexes, & a positive correlation of perceived tiredness scores and the high frequency component ratio (LF/HF ratio) of heart rate variability. Anxiety did not influence the precompetitive cardiac response despite somatic anxiety’s correlation with sympathetic response (LF/HF ratio) & tiredness scores. Perceived tiredness predicted the autonomic cardiac response to competitive overload. Thus, the perceived tiredness assessment would be a good early marker of fatigue & overload states during competition
HRV Analysis Day of analysis, Frequency Domain
Author Mazon et al. (2011)
Sport Male, Volleyball (n=32)
Aim To investigate the effects of selective loads of periodization model (SLPM) on autonomic modulation of HRV and endogenous stress markers before and after a competition period in volleyball players.
Main Findings SLPM did not change the cardiac autonomic modulation of HRV, but promoted beneficial adaptations in athletes, including positive changes in the plasma concentration of the endogenous stress markers. The absence of changes in HRV indicates that there is no direct relationship between cardiac autonomic modulation & endogenous stress markers in the present study.
HRV Analysis Pre & Post Training Cycle, Frequency Domain
Author Di Fronso et al. (2012)  – Abstract On
Sport Male, Amateur Basketball (n=7)
Aim To investigate the relationship between Heart Rate Variability (HRV) and performance in players of a basketball team during playoffs.
Main Findings Findings of this study suggest that vagal activity, expressed by HF index of HRV, can be positively related to the athletes’ performance. In particular, higher values of HF index during the morning of the match were associated with higher levels of athletes’ performance during the game.
HRV Analysis Morning of Competitions – Frequency Domain
Author Dranitsin (2008)
Sport Elite Male (n=12) and Female (n=1) Rowers
Aim The aim of this study was to examine the simultaneous effect on HRV of acclimatization to a hot, humid environment and a transition of five time zones in elite junior rowers.
Main Findings Major physiological adaptation of HRV indices in the standing position during acclimatization to a humid, hot environment, with a transition across five time zones, occurs within the first 5 days in elite athletes before returning to baseline. Indices of heart rate variability in the supine position correlate with the length of high-intensity training sessions on the previous day.
HRV Analysis Daily, Time Domain
Author Iellamo et al. (2004)
Sport Elite Male Rowers (n=8)
Aim To test the hypothesis that training-induced variations in T-wave amplitude at higher training loads are paralleled by changes in HR spectral profile.
Main Findings From 50% to 100% of training load, there was a significant decrease in HRV and increase in sympathetic tone. As training reduced to 50% during the World Championships, HRV returned to base line and a return of autonomic indices to previous levels was seen. 
HRV Analysis Non-Daily – Frequency Domain

I’ll discuss my thoughts on the questions I listed above in my next post.

Please share any studies pertaining to HRV usage in a team setting that I may have missed in the comments below or e-mail me andrew_flatt@hotmail.com

I joined twitter recently too @andrew_flatt

References:

Cipryan, L. & Stejskal, P. (2010) Individual training in team sports based on ANS activity assessments. Medicina Sportiva, 14(2):  56-62 Free Full-Text

Cipryan, L., Stejskal, P., Bartakova, O., Botek, M., Cipryanova, H., Jakubec, A., Petr, M., & Řehova, I. (2007)  Autonomic nervous system observation through the use of spectral analysis of heart rate variability in ice hockey players.  Acta Universitatis Palackianae Olomucensis. Gymnica, 37(4): 17-21. Free Full-Text

Di Fronso, S. et al. (2012) Relationship between performance and heart rate variability in amateur basketball players during playoffs. Journal for Sports Sciences & Health, 8 (Suppl 1):S1–S70 45

Dranitsin, O. (2008) The effect on heart rate variability of acclimatization to a humid, hot environment after a transition across five time zones in elite junior rowers. European Journal of Sport Science, 8(5): 251-258 Abstract

Edmonds, RC., Sinclair, WH., and Leicht, AS. (2012) Theeffect of weekly training and a game on heart rate variability in elite youth Rugby League players. Proceedings of the 5th Exercise & Sports Science Australia Conference and 7th Sports Dietitians Australia Update. 5th Exercise & Sports Science Australia Conference and 7th Sports Dietitians Australia Update Research to Practice , 19-21 April 2012, Gold Coast, QLD, Australia , p. 183. Abstract

Hap, P., Stejskal, P. & Jakubec, A. (2010) Volleyball players training intensity monitoring through the use of spectral analysis of HRV during a training microcycle. Acta Universitatis Palackianae Olomucensis. Gymnica, 41(3): 33-38 Free Full-Text

Iellamo, F., Pigozzi, F., Spataro, A., Lucini, D., & Pagani, M. (2004) T-wave and heart rate variability changes to assess training in world class athletes. Medicine & Science in Sports and Exercise, 36(8): 1342-1346. Abstract

Ke-Tien, Y.(2012) Effects of Cardiovascular Endurance Training Periodization on Aerobic performance and Stress Modulation in Rugby Athletes. Life Science Journal, 9(2): 1218-25. Full-Text

Martin-Sanchez, F. (2011) Functional status and inflammation after preseason training program in professional and recreational soccer players: a proteomic approach. Journal of Sports Science & Medicine, 10: 45-51 Free Full-Text

Mazon, J. et al. (2011) Effects of training periodization on cardiac autonomic modulation and endogenous stress markers in volleyball players. Scandinavian Journal of Medicine & Science in Sports, doi: 10.1111/j.1600-0838.2011.01357.x Free Full-Text

Oliveira, RS. et al. (2012a) Seasonal changes in physical performance and HRV in high level futsal players. International Journal of Sports Medicine. DOI: 10.1055/s-0032-1323720 Abstract

Oliveira, RS. et al. (2012b) The correlation between heart rate variability and improvement in soccer player’s physical performance. Brazilian Journal of Kinanthropometry, 14(6) Abstract

Parrado, E.  et al. (2010)Percieved tiredness and HRV in relation to overload during a field hockey world cup. Perceptual and Motor Skills, 110(3): 699-713 Abstract

Rodas, G. et al. (2011) Changes in HRV in field hockey players during the 2006 World Cup. Apunts Medicina de l’Esport, (46): 117-123 Abstract

Vantinnen, T. et al. (2007) Practical experiences from measuring exercise intensity and recovery state with HR monitoring in team sport. Symposium Proceedings 6th IACSS Calgary, Alberta. Full-Text


Psychological Considerations With HRV Monitoring

When I first started recording HRV measurements in August of 2011 I didn’t really know what to expect. I had no strategy for how I was going to interpret the data or put it to use practically. Other than reading Q&A posts from Landon Evans on elitefts, I didn’t know too much about HRV. All I knew was that it sounded interesting, logical and it was something cool to buy. I didn’t even own a compatible device to operate the app on so I bought an iPod touch.

Up until that point I was training religiously. Three weeks on followed by a one week deload. I didn’t miss workouts. I would try to hit my planned numbers at all costs. This method of training worked very well. I got big and strong training like this. Upon purchasing my ithlete device I kept my training structure the same and simply recorded HRV every morning. I decided to analyze the data later and see what I learned. Was I stronger when HRV was high? Was I weaker when HRV was low? What was HRV when I got hurt or sick? Etc. I ended up with 6 months of data of pre-planned training. I discussed my observations in this article.

Basically, I learned that with some simple modifications to my daily training plan, I might be able to see some benefits. I’d say the biggest benefit has been being able to back off the training when my body needs it rather than trying to assume. Pre-planned training failed to account for real life incidences that effect training. HRV monitoring also allowed me to better adjust training in response to illness, allowing me to maintain strength better upon return.

A common topic that arises when discussing the applications of HRV among colleagues is the potential psychological effects. What are they? How does this effect performance?

Here are some example scenarios with some brief thoughts;

  • HRV score is low and therefore you expect to feel weaker

–          In my experience I’m definitely weaker when HRV is well below baseline. But this is often because a well below baseline score happens; after an intense workout day; when I’m ill; when I perform a very different workout than I’m used to. I’ve found that moderately below baseline scores don’t typically affect my strength.  This may be different for you or your athletes. The simple solution would be to keep yourself or athlete blind from the HRV score for an observation period and see what you learn. However, the idea that HRV score can impact how you will perceive training is very real.

  • HRV score is high and therefore you expect to feel stronger

–          I can’t say that I’m stronger than normal when HRV is above baseline. But I’m certainly not weaker. This again should be tested during an observation period where the trainee is uninformed of HRV score. I must admit that upon seeing a good HRV score I immediately get excited. As if I have permission to train hard. Obviously my perceptions are influenced by my HRV score (based on my previous observations). We probably don’t want this happening with athletes. A good test for me might be to do another observation period. With what I know now about HRV I’m no longer impartial. Perhaps in the future I will test HRV blind for a month or two and see what happens.

  • HRV score doesn’t appear to make sense – something’s wrong with me, or the device

–          Something may be wrong with you or the device. Or, something may be wrong or inconsistent with your measuring procedure (position, you didn’t go to the bathroom first, disturbed measurement, etc). Additionally, you must consider all of the other factors that affect HRV. I wrote a post on many of these factors here. In short, you must factor in daily nutrition, training load, familiarity of training session, travel, caffeine intake, mental stress, etc. It isn’t just training load that can impact your HRV score.

–          Trouble shooting ideas: Check your pulse (on wrist) while recording the measurement to make sure the animated heart is in fact in synch with yours. Make sure the valid pulse indicator is green during the measurement. Make sure that you follow the breathing prompts consistently every measurement (This must be the same every time). Take several measurements in a row. If you do this keep in mind that successive measurements will change slightly (a few bpm and a few points on HRV) but they should be in the same ball park. Be careful when interpreting successive measurements. I find that I get a bit impatient/anxious when recording several in a row which will obviously effect HR.

–          If you measure standing (my preferred position) give yourself a minute to stabilize and let your heart rate adjust. Typically upon standing HR will jump up real high to account for the change in blood distribution requirements followed by a marked drop and then an evening out where it comes back up a bit. It may look something like this;

Lying down HR = 51

Standing HR (immediately after standing) = peaks at 102

Standing HR (after several seconds) =drops to 54

Standing HR (once stabilized) = 60

*These figures were made up based on what I recall from performing these tests

  • HRV score is low and therefore I might get hurt/perform terribly

–          One must keep in mind that come game day, athletes are typically experiencing some form of anxiety. This can be good or bad. Either way it can have a pretty big impact on HRV score that morning which will likely provide a skewed result. Therefore, game day measurements should probably be interpreted with caution. I’d prefer to keep the score from the individual so that it doesn’t mess with their head. Rate performance over time and see how it matches up with HRV. Studies have been done that have looked at this that I’ve discussed in several other posts. See what you find and how it compares. If you do please let me know what you find!

  • HRV score is low and therefore I’m overreaching, overtraining, etc

–          Again, all other factors must be considered when a score is analyzed. Probably the easiest measurement you can do to determine if one is in fact overreaching is to have them perform some performance tests like a vertical jump or grip strength. Additionally, assess their workout cards to see if their numbers are declining. If they are in fact over doing it performance will decrease with HRV.

Closing thoughts:

For the individual trainee: My best advice that I can give individuals who have an HRV device is to put yourself through an observation period. Try and measure your HRV blind and proceed with your normal pre-planned training routine (or whatever you typically do without the guidance of HRV). Try and document important events that may have effects scores in the “comments section” and keep a training log. It’s hard to analyze data based purely on memory. Having background knowledge of HRV before you use is it can be a blessing and a curse. You’ll likely have expectations or may already be impartial.

For monitoring athletes:  In team sport athletes, the less they know about HRV the better (in my opinion). If they can simply take their measurements and forward you the data that is all they need to know and do. If you can somehow manage to have them measure without seeing HRV score then that would probably be best. This will remove the psychological effects that can potentially occur.

In smaller teams and individual sports, this comes down to a judgement call based on your relationship with the athlete and their personalities. By the athlete knowing what their HRV means, how their lifestyle affects it and so forth, you may be able to get more “buy-in” to your program, guidelines, etc. Individual athletes are typically different than team sport athletes. An individual sport athlete typically takes more initiative, holds themselves more accountable, etc. They may respond to it by taking better care of their nutrition, sleep, reducing overall stress, performing active recovery and restoration modalities etc. The alternative would be to keep them vaguely informed and approach them the same way as the team sport athlete.

What’s your take on the psychological issues associated with HRV? What observations have you made? I’d like to hear about them. Let me know in the comments below or via e-mail andrew_flatt@hotmail.com

Supine vs. Standing HRV Measurement: Is one better than the other?

After purchasing my HRV device over a year ago I was unsure of whether to take measurements laying down (supine), seated, or standing up. I don’t recall what it was exactly that prompted my decision, but I decided to measure standing. Since day one I’ve recorded my HRV in the exact same position (standing) after waking up for consistency. I often wonder however if this is the best way of measuring HRV for the purpose of monitoring training load, recovery status, etc. I am not an expert on this topic so understand that this article is simply my perspective on the topic based on my experience and research into the matter. Furthermore, I’ve yet to see this discussed in too much depth and therefore decided to investigate the issue myself.

In this discussion I wish to accomplish 3 objectives;

  1. Briefly discuss the role of the ANS in controlling heart rate at rest and in response to orthostasis (standing up)
  2. To briefly review some of the research I have read pertaining to this issue
  3. To present and discuss some data I collected over the last few weeks comparing my morning supine RHR and HRV score vs. my morning standing RHR and HRV score.

Heart Rate Mediated by ANS

Within the wall of the right atrium of the heart is the sino-atrial node (SA node). The SA node randomly initiates impulses that cause the heart to beat. The cardiovascular center of the autonomic nervous system located in the brainstem governs the SA node via parasympathetic and sympathetic innervation. More specifically, the cardiac accelerating center (sympathetic) and cardiac decelerating centers (parasympathetic) of the medulla are responsible for sending sympathetic and parasympathetic impulses to the heart in response to altered blood distribution and pressure requirements (exercise, stress, standing, laying down, etc.)

Sympathetic impulses increase heart rate by exciting the SA node while parasympathetic impulses reduce heart rate by inhibiting it. Thus, with parasympathetic predominance we can expect heart rate to be less frequent and less consistent (more variability between beats) while sympathetic predominance would result in more beats with less variability. *It’s not that simple but for the sake of this article that will suffice*

At times of rest and relaxation, the parasympathetic branch of the ANS will be more dominant whereas during times of stress (exercise, anxiety, etc) the sympathetic branch of the ANS will increase. This is how monitoring our HRV informs us of the balance of the ANS. Though the two branches of the ANS appear to work in a “yin and yang” relationship, both systems are active simultaneously (however to varying degrees). It is possible to have an elevated heart rate and high HRV and vice versa.

During supine, heart rate and blood pressure are lower as the body rests. From supine (a state of high parasympathetic activity and low sympathetic activity) to standing, there is a shift in sympathovagal balance characterised by a withdrawal of parasympathetic activity and a concomitant increase in sympathetic activity (Montano et al. 1994, Mourot et al. 2004). Naturally, the body needs to accommodate for the shift in position forcing the heart to beat harder and faster to pump blood to the brain; a task much less strenuous in the horizontal position.

Some Pertinent Research

Kiviniemi et al. (2007) provides a very thorough explanation of why HRV might be better measured in a standing position as opposed to seated or supine. Essentially, HRV is susceptible to saturation of the parasympathetic nervous system in subjects with low heart rates. Therefore, in athletic populations, changes in parasympathetic activity (as measured by HF Power) may be harder to detect. The author stated “In the present study, endurance training increased HF power measured at standing position but did not change HF power measured at sitting position. This supports our notions that orthostatic stimulus may be more favorable condition than sitting or supine positions to obtain specific information on the status of cardiac autonomic regulation in exercise intervention settings among relatively high fit subjects.”

Uusitalo et al. (1998) saw an increase in sympathetic activity (measured by LF power) measured in overtrained female aerobic athletes in the supine position.

Mourout et al (2004) saw decreased HRV in overtrained athletes compared to not overtrained athletes in the supine position. Similar results were found when HRV was measured after 60 degree tilt. The non-OT group always had higher HRV in the standing position and saw greater reactivity to the postural change.

Uusitalo et al (1999) saw similar results to the work mentioned above by Mourot. Overtrained athletes saw an increase in LF power in the supine position; lower HRV in the standing position; and decreased reactivity to postural change. Additionally, changes in maximal aerobic power were related to decreased HRV in the standing position.

Chen et al (2011) measured HRV in elite weightlifters before during and after an intense workout. HRV was measured in the seated position. The authors found that HRV reflected recovery status as strength levels returned once HRV reached or exceeded baseline in the days following the workout.

Gilder and Ramsbottom (2008) wanted to test whether volume of training load resulted in changes in HRV in response to orthostasis. The authors findings in their words; Women reporting higher volumes of physical activity had significantly higher levels of parasympathetic HRV than less active women while supine, but also demonstrated a much greater change in parasympathetic HRV in response to standing. It is of interest to note that short-term vagal measures of HRV for HV while standing are similar to those for LV while supine.” *LV=Low Volume HV=High Volume

Grant et al. (2009) found that standing HRV indicators showed significantly more correlations with cardiopulmonary fitness indicators compared to supine measurements. The authors urge practitioners to use caution when attempting to measure fitness via HRV indicating that this is not yet a reliable process.

Hedelin et al. (2001) found that during a 70 degree head up tilt, LF power correlated to measures of strength and aerobic capacity. A greater shift toward LF power in the tilted position correlated to reduced performance. Changes in LF were linearly related to changes in performance suggesting a reflection of adaptation to training.

Hellard et al. (2011) measured HRV in swimmers to model a relationship between HRV and illness. The main results of this study were the following:

“1) In winter, national-level swimmers showed a greater risk of pathology than international-level swimmers. 2) The weeks that preceded the appearance of URTI and pulmonary infection but also MA were characterized by an increase in autonomic parasympathetic activity in supine position. Conversely, in orthostatic position and in winter, the weeks that preceded the appearance of AP were characterized by a drop in parasympathetic activity. 3) During weeks characterized by URTI and pulmonary infection, a shift was noted in the autonomic balance toward sympathetic predominance in supine position and a drop in parasympathetic drive in orthostatic position. And 4) in winter and in orthostatic position, a drop in parasympathetic drive associated with an increase in sympathetic drive was linked to an increased risk of MA.” MA= Muscular Injury, AP=All type pathologies

Huovinen et al. (2009) measured HRV and Testosterone-Cortsiol ratios in army recruits during a week of basic training (class room based). The authors stated; In the present study, the correlation between the testosterone-to-cortisol ratio and changes in heart rate, SDNN, and high-frequency power expressing an association between circulating ‘‘stress’’ hormones and cardiac vagal activity was apparent in the standing condition only. Thus, based on the results of the present study, measures of heart rate variability should be done not only at rest but also during a controlled sympathetic stimulation (e.g. during an orthostatic challenge).”


Hynynen et al. (2011) looked to compare perceived stress levels with HRV scores during night sleep, supine and after standing. Lower HRV in supine and standing correlated with high stress levels while HRV during sleeping did not.

Iellamo et al. (2004) monitored HRV in elite rowers during overload training and recovery. Measurements were performed in the supine position. HRV decreased with overload and rebounded during a recovery period.

I summarize my thoughts and conclusions on the research at the end of this article.

My Experiment: HRV Supine vs. Standing

I conducted a small experiment over the last few weeks to see how my HRV responded to supine vs. standing positions. The table below presents the collected data.

Date

Supine HR/HRV

Standing HR/HRV

HRV Difference

sRPE

08/10

08/11

08/12

08/13

08/14

08/15

08/16

08/17

08/18

08/19

08/20

08/21

08/22

08/23

08/24

52 / 87

51 / 89.5

48.5 / 94.5

49.5 / 88

50 / 88

49 / 90

48 / 92

53 / 92

51 / 101

50 / 85.5

49.5 / 81.5

47 / 90

52 / 90

50 / 83

49.5 / 87

56 / 85

65 / 80.5

67 / 84.5

66 / 78.5

67 / 79

61 / 86

71 / 79

69.5 / 80

78 / 73

63 / 79

60.5 / 74.5

58 / 86

75 / 70

65.5 / 84

60.5 / 85.5

2

9.5

10

9.5

9

4

13

12

28

6.5

7

4

20

1

1.5

8

1

5

7

3

8

3

8

3

0

0

8

3

8

8

In interpreting the above data, the majority of the scores appear to give similar data. When reviewing my overall trends (not just these two weeks) usually HR goes up and HRV decreases in response to a high loading day (sRPE 8+). Likewise, HR will decrease and HRV will increase in response to a lower loading day. I’ve found this to be subject to change based on sleep quality and other lifestyle factors that can promote a change in HRV.

I have highlighted three instances that showed conflicting scores. In all three occasions supine HRV is high while standing HRV is low. Each of these conflicting scores occurred on days following a higher intensity workout. Based on my trends and perception of stress I find that the standing scores to be a more accurate reflection of my training load. Generally after an intense workout I’m sore the next morning and fatigued from the workout.

Having said all this, I’m not that smart and can be overlooking something completely obvious. Additionally, these scores (and everyone elses who use a smart phone app HRV device) are subject to the accuracy of the devices (EKG Reciever, Heart Rate strap, etc.) Not to say that they aren’t accurate but it is a potential limitation. Lastly, non-training related stressors are not documented. This is a huge limitation since any form of stress can affect HRV.

Thoughts and Wrap Up (for those still reading)

First and foremost, consistent measurements are more important than position. This is because each of the three positions appear to provide important data regarding training status however, each position provides different data. Therefore, pick a position and stick to it 100% of the time for your values to be meaningful. Switching positions from day to day will provide skewed data.

Endurance athletes and athletes with low resting heart rates are probably better off measuring HRV in a standing position.

Nearly every paper I’ve read on HRV stresses that HRV varies a great deal between individuals. This means that you should not be comparing your data to others. This means that in a team setting, it is important to always compare daily values to baseline (of each individual) for meaningful interpretations. A score of 80 may be high for one individual and low for another.

I like the standing test for the simple reason that it provokes a small stress response. This removes the issues of parasympathetic saturation from the supine position. Seeing how your body responds to standing appears to give you a good idea of how your body can/will handle stress that day. If HRV remains high after standing (given time to stabilize) then you are likely in an adaptive state. If HRV is low after standing (given time to stabilize) you are likely less adaptive (currently under higher stress).

HRV test length may influence positional preference. Measuring HRV for 3+ minutes may be more comfortable in a supine or seated position. My device (iThlete) is a 1 minute test and therefore I don’t find the standing position to be a nuisance. However, I did prefer the supine measurements simply because I only needed to focus on breathing and nothing else.

It may be optimal to measure HRV in both supine and standing positions for more complete data. I’ve seen several papers that measure supine-standing-supine HRV (orthoclinostatic measurements). Though this is less convenient and less practical, it may provide more accurate information.

Lastly and most importantly, the research is conflicting and more needs to be done. Formulate your own opinion based on the research and apply it to yourself. Consider experimenting by recording data in various positions, compare it to perceived stress (training, mental, chemical, etc) and determine what you like best. If you do perform this experiment be sure to only save the data on the app for your preferred testing position to keep meaningful trends and daily color indications.

References:

Chen, J. et al. (2011) Parasympathetic nervous activity mirrors recovery status in weightlifting performance after training. Journal of Strength and Conditioning Research, 25(6):  1546-1552

Gilder, M., & Ramsbottom, R. (2008) Change in heart rate variability following orthostasis relates to volume of exercise in healthy women. Autonomic Neuroscience: Basic & Clinical, 143(1-2): 73-76

Grant, C. et al. (2009) Relationship between exercise capacity and heart rate variability: supine and in response to an orthostatic stressor. Autonomic Neuroscience: Basic & Clinical, 151(2): 186-188

Hedelin, R., et al. (2001) Heart Rate Variability in athletes: relationship with central and peripheral performance. Medicine & Science in Sports & Exercise, 33(8), 1394-1398.

Hellard, P., et al. (2011) Modeling the Association between HR Variability and Illness in Elite Swimmers. Medicine & Science in Sports & Exercise, 43(6): 1063-1070

Huovinen, J. et al. (2009) Relationship between heart rate variability and the serum testosterone-to-cortisol ratio during military service. European Journal of Sports Science,9(5): 277-284

Hynynen, E. et al. (2011) The incidence of stress symptoms and heart rate variability during sleep and orthostatic test. European Journal of Applied Physiology, 111(5): 733-41

Iellamo, F. et al. (2004) T-wave and heart rate variability changes to assess training in world class athletes. Medicine & Science in Sports and Exercise, 36(8): 1342-1346.

Montano, N. et al. (1994) Power spectrum analysis of heart rate variability to assess the changes in sympathovagal balance during graded orthostatic tilt. Circulation, 90: 1826-1831 Free Full Text

Mourot, L. et al (2004) Decrease in heart rate variability with overtraining: assessment by the Poincare plot analysis. Clinical Physiology & Functional Imaging, 24(1):10-18.

Uusitalo et al. (1998) Endurance training, overtraining and baroreflex sensitivity in female athletes. Clinical Physiology, 18(6): 510-20

Uusitalo et al. (1999) Heart rate and blood pressure variability during heavy training and overtraining in the female athlete. International Journal of Sports Medicine, 20: 45-53

Illness, recovery time, travel stress, monitoring, etc.

I think many would agree that the biggest obstacle in making continued training progress is experiencing illness or injury. This assumes of course that the programming is appropriate and progressive in nature for the individual. Therefore, monitoring training status is essential to appropriately manipulate training loads in effort to; a) maximize progress and b) avoid set backs. This gives you much more control over the process of training and in many cases can potentially allow you to avoid illness, injury, overtraining etc.

Unfortunately sometimes, illness or injury happens despite careful monitoring. However, it’s how you handle these unfortunate situations with proper training loads that can make a huge difference in continuing where you left off before the incident, or seeing massive performance decrements that take much longer to recover from. I have experienced both situations. I’ve fallen ill and seen my strength plummet for quite some time after the illness. This was most likely from insufficient recovery from before I resumed intense training again, lifting too heavy, too soon. More recently however, I handled illness much more appropriately and have been able to continue from where I left off without suffering significant performance decrements.

ILLNESS

My nephew Kevin and I at the park


When I was visiting some family in Cincinnati this spring I was very excited to see my twin nephews. I hadn’t seen them in over a year since they were born. A few days before they arrived in Cincinnati (coming from New Hampshire) they contracted hand, foot and mouth disease. My sister warned us that it was contagious for anyone who has never had it before. I wasn’t too concerend and we all wanted to see the twins even if it meant getting a little sick. Well, long story short I picked up the virus and it destroyed me. If you’ve ever had this as an adult you know how awful this can be.

My nephew Ethan and I on the back porch

In my chart below you can see a distinct disruption in my HRV trend occuring when I experienced the first symptoms of the illness. On June 9th I woke up with a resting heart rate of 108bpm and an HRV score of 42.9! I had a terrible sleep that night and had a high fever that morning. The fever persisted for about 72 hours at which point I assumed the worst was over. I saw my HRV start to climb back up a bit, however at this point some new symptoms appeared and my HRV again dropped. As you can see in the chart, I didn’t train (the vertical purple bars represent training load). Once all of my symptoms subsided and HRV returned to previous baseline levels I resumed training at very moderate loads (session RPE of 7).

You’ll notice that these moderate loads were apparently very stressful on my body reflected by large HRV fluctuations. Typically a workout rated as a 7 is a deload workout for me. Being able to see my body’s responsiveness to these moderate loads showed me that although my symptoms were gone, my body was still trying to overcome the illness. In the past I likely would’ve resumed intense training once symptoms subsided, however by monitoring HRV, I was able to hold off on more intense loading until my body was capable of handling it sufficiently. You can see that it was nearly 3 weeks until I performed a more intense workout (sRPE 8). I can happily say that althought there was some minor strength loss (bound to happen after nearly 3 weeks of 0-moderate training loads), I was able to gain it all back very quickly unlike previous instances.

Purple Vertical Bars = Training Load
Horizontal Blue Wavy Line = HRV Baseline
Horizontal White Line = Day to Day HRV Fluctuations

Travel/Moving Stress

In the image above on the right hand side of the chart, you will see about a week’s worth of low HRV scores indicated by red and amber deflections. This was the week that I moved from grad school (I completed my Masters) back to Toronto. Clearly this was a very stressful week settling into a new place and dealing with all of the typical issues associated with a move. After appropriately manipulating my training loads (reducing them) I was able to maintain strength and see a return to baseline once I felt settled in. In the past after my first day of being back I likely would’ve continued with intense training. As you can see, this likely would’ve been detrimental to my progress.

Take Home Messages

First and foremost, have an effective monitoring strategy with yourself/athletes. Without one, it’s nearly impossible to make critical manipulations in training load to avoid running into problems. I’m obviously a proponent of HRV and recommend you track yours. Once you have your monitoring in place, have the discipline to reduce loads when you know you should. Sometimes you may not even perceive yourself as being under significant stress, however this is often how people end up hitting a wall with their training. You can’t necessarily ‘feel’ if your adaptive capacity is high or low. In previous posts I showed what happens when you train hard with low HRV. You simply delay recovery and potentially hurt progress.

Think outside the box a little. Training hard for 3 weeks and deloading on the 4th week is pretty standard and for the most part effective. However, just because your program tells you it’s week 3 and therefore you need to train heavy, doesn’t actually meant you HAVE to. I used to do this and thought that if I missed a workout or didn’t hit my goals that day, that I wouldn’t make progress. I’ve learned that the opposite is actually the case.

Lastly, have a plan in place for when certain events occur such as moving or illness. Have a strategy for how you will deal with it (hopefully in response to your monitoring data). This should help you maintain training progress better by allowing your body the appropriate time to recover while imposing loads that remain within your body’s ability to adapt.

HRV in a Team Setting

Monitoring athletes throughout training provides coaches with extremely valuable information regarding each athlete’s responsiveness to imposed training loads. Most would agree that the main objective for any coach (at competitive levels) is to win. If you fail to do this you will likely be fired.

I think we can also agree that bringing our athletes to peak physical condition (as it applies to their sport) will increase our chances of winning. To do this effectively, physical preparation in both team practice and S&C must be balanced. The right balance of training loads will yield optimal adaptation.

Adaptation is Key

Training (technical and physical) is a stressor our athletes must recover from. If the stress is too great, adaptation will be compromised. If the stress is insufficient, improvements will not take place. Therefore, the training stimulus must be within our athlete’s ability to adapt, allowing for performance improvements. This is pretty well understood by most coaches. However, the ability to balance loads effectively is much less understood. Too often coaches rely on pre-planned training regime’s that fail to take into account each athletes individual adaptive capacity. It is the coach’s responsibility to critically evaluate several issues that arise throughout the year such as;

  • Why did an athlete get hurt?
  • Why did an athlete fall ill?
  • Why is the team seeing decrements in performance?
  • Why are we not performing to our abilities throughout the entire match?
  • Why are certain athletes improving while others are regressing?

I’m sure you can think of more questions to consider.

Monitoring HRV in Sports Teams

Hap, Stejskal & Jakubec (2010) set out to monitor the HRV of 8 competitive male volley ball players (approximately 18-25 years old) over a 7 day microcycle during training camp. The 7 day camp had the athletes partake in 11-13 volleyball practices and 14-16 conditioning sessions. The training was entirely pre-planned and HRV scores were not shared with players or coaches. HRV was measured once each day for a total of 7 times (6 measurements were performed in the morning immediately after waking and 1 measurement was performed under controlled conditions in the afternoon).

The results showed 2 athletes demonstrated above average ANS activity (high HRV) throughout the entire week. In these athletes, the load was below training capacity and higher training levels could have been tolerated to further increase performance. In 4 athletes, HRV scores decreased to the lower end of average. This indicates a moderate level of fatigue and that training load corresponded to their training capacities. In the last 2 athletes, HRV scores were negative (below average). Training stress was too high in these individuals and reduced loads and recovery/regeneration modalities would’ve increased the quality of their training.

In this instance, the pre-planned training program was appropriate for 50% of the team. 25% were overtrained and 25% were undertrained.

In another study, Cipryan & Stejskal (2010) decided to monitor the HRV of competitive hockey players. There were 18 subjects, 8 were junior level players (18 years old) and 10 were from the adult team (mid-20’s). Both teams underwent their own training and practice programs. HRV was measured twice per week in the morning (Mon and Fri) throughout the 2 month training program.

The results show that from the junior team, 2 players showed above average adaptation capacity. 1 player showed decreased HRV scores indicating high fatigue. Training was appropriate for 5/8 players. In the adult men’s team, 3 players showed higher HRV suggesting that more (volume or intensity) training would’ve been tolerated. 1 player showed decreased HRV. This player could not see an increase in HRV back to baseline levels because the training did not conform to his adaptive abilities. This player was at risk of more frequent health complications. This training program was appropriate for 60% of the team. 30% was undertrained and 10% was overtrained.

In the discussion, the authors proposed that athletes be separated into groups during training with 3 separate programs available. One program for athletes with low HRV (decreased loads) one program from athletes responding appropriately (moderate loads) and one program for athletes with high HRV (increased loads).

The last study that I’ll discuss has been mentioned before in previous articles that I’ve written. Cipryan et al. (2007) measured HRV in Czech U-17 male hockey players once per week in the morning over a 3-5 month period. In addition, the coaches were asked to rate each players performance on a scale of 1-10. The researchers found that as HRV increased, performance was rated better and correlated to more playing time. When HRV was low performance was rated lower. Performance correlated with HRV score.

Thoughts

What I found interesting was that in 2 of the above studies, HRV was monitored only once or twice per week and was still able to provide important data regarding training status. This makes the application of HRV in a team setting much more realistic. Daily measurements can certainly be done and would likely provide more accurate data but can prove to be difficult. The ability to perform HRV measurements are limited by; having access to valid and reliable measuring devices; having a qualified individual(s) to record and analyze data; having athletes capable of following measurement instructions. HRV applications on smart phones certainly would make this process much easier. These are much more cost effective and convenient.

It appears that pre-planned training certainly isn’t optimal for realizing athletic potential in athletes. Though this is very inconvenient for the coach, having the ability to adjust training prescription for certain athletes based on HRV can increase the quality of training and adaptation while decreasing health complications (illness, injury, overtraining).

How often do coaches punish players for poor performance with intense conditioning in practice sessions following a previous competition? How many coaches punish teams with physical conditioning due to team rule infractions? How often are ill or injured players returning to training and competition before they’re ready? Clearly these strategies require some re-evaluation. It is quite possible your training program, no matter how good it looks on paper, is only appropriate for 50-60% of your players.


References

Cipryan, L. & Stejskal, P. (2010) Individual training in team sports based on ANS activity assessments. Medicina Sportiva, 14(2):  56-62

Cipryan, L., Stejskal, P., Bartakova, O., Botek, M., Cipryanova, H., Jakubec, A., Petr, M., & Řehova, I. (2007)  Autonomic nervous system observation through the use of spectral analysis of heart rate variability in ice hockey players.  Acta Universitatis Palackianae Olomucensis. Gymnica, 37(4): 17-21.

Hap, P., Stejskal, P. & Jakubec, A. (2010) Volleyball players training intensity monitoring through the use of spectral analysis of HRV during a training microcycle. Acta Universitatis Palackianae Olomucensis. Gymnica, 41(3): 33-38

HRV response to perceived training load – Observations from 2.5 months of data

About two months ago the new version of iThlete was released with some really cool new features. These new features included;

  • The ability to rate your sleep on a score of 1-5
  • A comment section that allows you to make notes about the previous day’s events, stressors, etc.
  • The ability to input training loads that appear on your HRV trend chart so you can see how your HRV responds to your training
  • The ability to export data to drop box

Here is a video that shows the updated features;

The most significant addition in my opinion is the ability to track your training loads with your HRV trend. This really puts into perspective how stressful your workouts are. There is no specific method or formula that you have to use for your training load data. There are several methods that have been used in research to quantify training load, some of which I’ll describe below.

Training Impulse (TRIMP) – this is calculated using training duration, maximal heart rate, resting heart rate and average heart rate during the session

Session Rating of Perceived Exertion (RPE) for Endurance Athletes – Session RPE score x duration of exercise in minutes (for endurance training)

Session Rating of Perceived Exertion (RPE) for Strength/Power Athletes – Session RPE score x repetitions

*See Borrensen & Lambert (2009) for a more elaborate review and explanation of the above methods.

       Training Volume – Weight Used x Sets x Reps

Other methods exist, but these tend to be the most commonly used. In deciding how I would monitor my training I simply decided to use an RPE of the session, however, not like the method listed above. Instead, I simply rated my workout on a scale of 1-10 based on how hard, or how much effort I put into the session. I would consider volume, strain, RPE of my main sets, how hard I pushed my assistance work and so forth. I realize this isn’t the most valid or reliable measure of training load, but it’s been working well for me.

To give you an idea of how I grade my workouts, see below. This will make interpreting the charts I attach below of my trends much easier.

Session RPE of 10 – 3 or more top sets for my main exercise, RPE of 9-10 for each set, high volume of assistance work (3+ sets to failure), complete exhaustion by workouts end. I have yet to perform a 10 workout and likely never will.

Session RPE of 9 – 2-3 top sets for my main exercise, RPE of 8-10 for each set, moderate volume of assistance work (2-3 sets not to failure), considerable fatigue at end but not exhaustion.

  • I’ll typically perform these workouts when HRV is above baseline

Session RPE of 8 – 1-2 top sets for my main exercise, RPE of 8-9 for each set, low to moderate volume of assistance work (1-3 sets not to failure), moderate fatigue at end

  • I’ll typically perform these workouts when HRV is at the lower end of baseline

Session RPE of 7 – 1 top set for main exercise with an RPE of 8 or less, low volume of assistance work with reduced weight, minimal fatigue at end.

  • I’ll perform this workout when HRV is below baseline with an amber indication (deload)

Session RPE of 5 – No main exercise performed, light weight, moderate volume

  • This is what I’ve been doing on Sunday’s to hit delts and arm’s since I don’t do much work for them during my main sessions on Mon-Wed-Fri

Session RPE of 3 – Active recovery work for 20-40 minutes. This can be in the form of light jogging, sled dragging, circuits, etc.

  • I try and perform these workouts the day after each workout to facilitate recovery and maintain an aerobic base level of conditioning

Session RPE of 1 – Leisurely walk for 30-40 minutes. This can hardly be described as a workout but it’s more than a zero so I will log it when it happens.

  • This happens sometimes instead of an active recovery session.. usually when I’m visiting my folks as we’ll take a lot of walks.

So as you can see there is no sexy formula (I’ve never been a math guy anyway), but I’m pretty consistent and I’ve noticed some fairly common trends in my recovery (based on HRV). Below I have attached a couple screen shots of my HRV Trends with Training Load (Session RPE ala Andrew Flatt). The purple bars reflect training load (9 being the highest you’ll see) while the horizontal trend is my HRV daily fluctuations with the blue line representing my baseline.

Observations:

  • See here and here for previous posts about observations I’ve made from monitoring my HRV
  • A session rated as 9 is almost always going to cause a pronounced drop in HRV the following day. This is why I don’t typically train on consecutive days.
  • If circumstance causes me to train two days in a row, I’ll use a Session RPE of 8. My HRV will usually drop moderately after the first workout out and drop even more after the second one.
  • During the passed 2.5 months I experienced approximately 16 instances where my HRV dropped enough causing an amber or red indication. The majority of these occurred the day after a session and therefore fell on a recovery day.
  • There were 5 days in which a red or amber indication fell on a training day and therefore out of the 2.5 months, I only deloaded for a total of 5 days. In the past I would typically take a week off after every 3 week cycle however with my new system of training I simply deload on a given day when my HRV is well below baseline.
  • The lowest dip on the graph (around 04/20) I purposefully trained harder than normal on a below baseline day (amber indication) to see how my body would react. The next day my HRV dropped even lower with a red indication. This, as well as other incidences from the past solidifies my stance that training hard when HRV is low delays recovery. You’ll see that it takes several days until my HRV gets back up to previous levels. This negatively effects future training sessions. In my opinion, it’s much better to reduce loads for one day to improve the effect of your following sessions as opposed to just training through a bad day and ruining the next few sessions. This is also what has inspired me to stop deloading at pre-determined times for pre-determined periods. There certainly is value in doing this as the body needs time to recover and adapt to weeks of hard training. However, with HRV monitoring, it seems (atleast to me, for right now) that you can get away with just reducing loads on days when HRV is low.
  • I’m presently the leanest I’ve ever been at my current body weight. I’m about 232lbs at 17%. The leanest I’ve ever been is 14.8% at 218 while the heaviest I’ve ever been was nearly 270lbs when I played collegiate football (I’m the ogre in purple below from back in 2006).

  • I’m presently the strongest I’ve ever been at this body weight.
  • I’ve been able to remain injury and illness free since using HRV to guide my training. I no longer experience any tendonitis in my elbows either which used to be a big problem.

Final Thoughts:

I realize that I may appear overly biased towards HRV’s usefulness in my writing. However, I feel that I’ve been training long enough to know when something’s all in my head (placebo) or when it’s actually making a difference. The science supports HRV (see here) and my experience up to and including the present also seems to support it. The whole concept of planning training in advance and sticking to it no matter what is not as effective as manipulating training on a day to day basis according to an objective measure of your body’s current adaptive capacity. This doesn’t mean you can’t have a general plan, it just means that you need to be prepared to make adjustments along the way to ensure the quickest and safest way to reach your training goal. HRV provides, in my opinion, the simplest and most accurate information to allow you to do this. I will continue with this method of monitoring and training since it has been so successful. I’ll be sure to provide another update in a few months.

Thanks for reading.

Managing Training for Strength

In my last post I discussed some of the shortcomings of pre-planned training. This inspired a conversation between myself and a friend about percentage based training. Today I’d like to talk about some thoughts I have on this topic. Additionally, I will offer some potentially better strategies to help manage and adapt your training on a day to day basis.

To be clear, percentage based training (in the context of this discussion) refers to planning training loads based on a percentage of your 1 rep max in a given lift.

For example, if your 1 rep max in the Bench Press is 300, you know that 50% of this is 150. Strength is generally believed to best be built by working over 85% of your 1 rep max. From our example, 300x.85=255 and therefore 255 is 85% of our 1 rep max of 300. The purpose of using percentages is to control the level of intensity, effort and fatigue placed on the body to create a desired effect. Generally, you can perform only 1 rep with 100%, 2 reps with 95%, 3 reps with 90% and so on.

% 1RM

100

95

90

85

Reps

1

2

3

5

I think that percentage based training is most effective for novice to intermediate level lifters. This is because they are nowhere near their strength potential. Progressing from workout to workout is much more feasible for them. They can adapt better and faster to the loads because the loads simply aren’t that great yet.

Now for a more advanced trainee, percentage based programs can be less beneficial for several reasons.

  • Percentages are based off a 1rm (or a calculation of a 2-5rm) that were taken on a given day. Your strength levels can and will vary day to day based on recovery status, stress levels, nutrition and several other factors. Therefore a percentage based off the 1rm recorded on a previous day will unlikely be a true reflection of present strength levels.
    90% of your 1rm can easily be 100% on an off day. We’ve all had workouts where the weights felt heavy. We’ve also had days where the weights felt light. If you grinded out 85% for 3 hard, sloppy reps, was it really 85%? In reality it was more like 90%. This can create problems in the program because 85% x3 should generally be a very manageable lift and therefore not tax the body too much. However, since the weight was actually much heavier than 85% on that given day, we’ve created more stress and fatigue then was called for. This is how we set ourselves up for missing lifts in subsequent workouts and nothing is more frustrating than missing lifts.
  • Pre-planned percentage based training is basically telling your body that it must adapt to the training rather than allowing your training to adapt to you. Unfortunately, we do not have conscious control over how we adapt or when. Therefore, it would be much wiser to plan according to the current strength and adaptability levels of our body. We can’t force our body to get stronger.. often times when we try and do this our body tells us to suck it and we regress, or worse, we get hurt. I’ve been down that road.

How do we adapt our training to our body?

1.

I’ve become a big advocate of using RPE (ratings of perceived exertion) to manage training loads. I first learned about RPE when studying for the CSCS exam several years ago. However, it wasn’t until I read Mike Tuchscherer’s Reactive Training Systems Manual that I really started to incorporate them into my training. Essentially, with an RPE system we plan to work up to a given RPE for a given amount of reps and sets as opposed to using a percentage of a 1rm. This allows us to “pre-plan” our training in accordance with our most current strength level. The following chart shows how a RPE score corresponds to effort level.

RPE

Reps left in the tank

10

0

9

1

8

2

10 is an all out effort. It can be a 1 rep max, a 5 rep max or any number really. As long as it was an all out effort where you are unable to perform another rep. An RPE of 9 means you had 1 rep left in the tank. There is a huge difference between an RPE of 9 and 10 due to its effect on the CNS. It takes much longer to recover from a 10 than a 9. This is what makes RPE’s more accurate than percentages.

This system eliminates missed reps at a given percentage because the selected weight is now much more accurate and fits your present strength levels for that day. For more info on RPE’s check out Mike’s book and free articles on his site.

2.

Pay attention to indicators. Things such as sleep, stress, nutrition and restoration work can all have a pretty drastic effect on your strength levels and adaptability. The following is a list of different indicators you can start to monitor if you don’t already.

  • Sleep: I rate my sleep on a scale of 1-5.
    5 = 7-8 hours of sleep, no wakes or disturbances, morning wood, etc
    4= 1 disturbance or wake up during the night
    3= less than 7 hours of sleep, and/or multiple wake ups
    2=Usually if I’m sick and can’t fall asleep
    1=no sleep
    Supplementing with ZMA really helps improve the quality of my sleep.
  • Stress: Primarily for this I use HRV measurements. I’m not going to elaborate on this since I’ve written about it extensively in previous posts. If you’re unfamiliar with HRV then I highly recommend you click here and start with “HRV Explained Part 1″.

    If HRV isn’t an option for you there are other way’s to monitor your stress. I have to thank Simon Wegerif (creator of iThlete) for introducing me to this method in a conversation we had over Skype. Stress can be classified as; physical, mental or chemical.

    Physical Stress = training, labour, etc.

    Mental Stress = financial problems, fighting with a significant other or parent, travel, death in the family, etc.

    Chemical Stress = Alcohol intake, poor or inadequate nutrition, etc.

    You may not perceive things like poor nutrition or mental stressors as significant stress, but I assure you, they play a big role in how strong you’ll be on a given day and how much further training stress you can handle.

    Rate each one of these on a scale of 1-5. You’d be surprised what you discover by monitoring stress and how it relates to and effects your strength levels

    I love the HRV app because it plots your stress levels on a chart so you can see trends over time. Looking back over the trends with your training log and indicators tell you a lot about what’s working and what’s not.

  • Restoration Work: Foam rolling, stretching and moderate aerobic work can have a huge impact on your recovery and fitness levels. I will reserve writing about the benefits of aerobic work for strength athletes now since I plan to write an entire post on it in the future, but understand that a little cardio (in the form of jogging, sled dragging, etc) goes a long way in contributing (indirectly) to strength gains. I simply keep a log of what type of aerobic work I do, for how long and if I use a sled I track the weight.
  • CNS Test: Finally, I like to perform a quick CNS test after my warm-ups but before I start lifting. This can be in the form of a vertical jump, broad jump, grip test or whatever else you can think of. It’s important to be consistent. Compare your daily result to your baseline or average and that will usually indicate how your workout will go. I’ve actually found that skipping (yes, jumping rope) is a good indicator for me. Some days I can skip like a 3rd grade school girl with flawless technique. Other days I can’t get into a rhythm and stomp the rope every ten jumps. I’ve found that this has a correlation to my strength performance that day.

The longer you train and more advanced you get, the harder it is to make progress. If you haven’t adopted any of the above strategies to help monitor your training I encourage you to consider some. You have nothing to lose and only strength to gain.

Thanks for reading.