HRV in a bit more detail

Over the next several posts I will attempt to provide a little more depth to the typical explanations of heart rate variability that I’ve provided in the past. I will be displaying ECG data and HRV software screen shots to provide a better visual representation of HRV analysis. I will present and discuss things like;

  • How HRV data is often collected and analyzed
  • ECG basics
  • What respiratory sinus arrhythmia looks like
  • What an ectopic beat looks like
  • What a tachogram is and looks like (HRV software)
  • Comparing athlete to non-athlete ECG/HRV data
  • Looking at supine and standing ECG/HRV data
  • Looking at paced vs. spontaneous breathing data and how it affects HRV
  • Showing how subtle errors can impact an HRV measurement
  • Discussing HRV research questions that my colleague and I are investigating here in our lab
  • Whatever else seems  relevant as I get writing

Today’s post will serve as a brief, but slightly more in depth introduction to heart rate physiology. To really get a handle on HRV, it’s important to have an understanding of the interplay between the brain and heart and the details therein. I encourage interested readers to check out an actual physiology text for a more elaborate and detailed discussion for which I’ll provide a few recommendations at the end.

Heart Rate

The human heart is equipped with an intrinsic pacemaker within the wall of the right atrium called the sinoatrial node (SA node).  The SA node randomly depolarizes, generating action potentials that ultimately result in a contraction (heart beat). All heart beats that originate from the SA node are “normal” beats and provide normal cardiac rhythm. However, as we’ll get into eventually when I display some ectopic beats, depolarization also regularly occurs in other areas within the myocardium, which if reach threshold, can initiate a contraction on its own. Non SA node action potentials disturb cardiac rhythm that is ideally dictated by the SA node (more on ectopic beats in future). Left alone, the SA node would give you a resting heart rate of about 100 beats per minute. Obviously, healthy individuals have much lower heart rates while at rest. Other times, we can experience quite high elevations in heart rate to facilitate blood distribution requirements (e.g., during physical activity). We’ll get into how these changes in heart rate occur momentarily.

In the lab, we can evaluate heart beat information with electrocardiographic (ECG) recordings. An ECG detects electrical currents at the surface of the skin generated by the action potentials that propagate through the heart. In our lab, since we’re mainly interested in heart rate variability and not intricate ECG analysis, we use a simple, modified lead II electrode placement. From the ECG we can observe 3 distinct patters that represent the electrical conductivity involved in the cardiac cycle;

pqrst

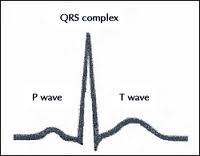
P wave – Displays as a small upward deflection and represents atrial depolarization. The P wave indicates that the impulse originated from the SA node and therefore results in a “normal” beat.

QRS Complex – Begins with a shallow downward deflection (Q), followed by a tall upward deflection (R) and ends with another downward deflection (S). Collectively, this represents ventricular depolarization.

T wave – Oftend described as dome-shaped in appearance and represents ventricular repolarization

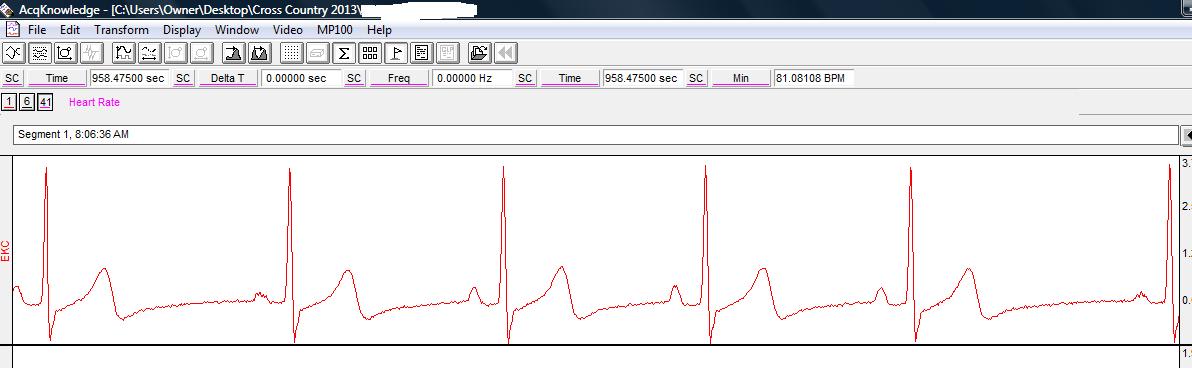
As you can see, the R wave has a high peak making measurements between cardiac cycles rather easy. The elapsed time between two R waves creates an R-R interval. The time between R-R intervals varies across successive R-R intervals and is termed heart rate variability. In the screen shot below of the AcqKnowledge software, notice how the space between R waves (the tall peaks) is inconsistent as some intervals are wider and some are more narrow.

ECG


Centrally Mediated Cardiac Control

Now we’ll return to our discussion on heart rate control. Heart rate is influenced by both intrinsic and extrinsic mechanisms, however for this discussion, our interest is primarily with central nervous system regulation of cardiac control via autonomic innervations of the heart. Heart rate is largely mediated by both sympathetic and parasympathetic influence which originates in the cardiovascular center of the brain. The cardiovascular center is located on the lower portion of the brain stem at the medulla oblongata. From here, sympathetic neurons extend from the brain, through the spinal cord and directly into the heart. Increased sympathetic activity increases the release of norepinephrine which speeds up SA node depolarization (increases heart rate) and increases the force of contraction. This response occurs to facilitate increased blood distribution requirements that may arise due to physical activity, stress, standing up, etc.
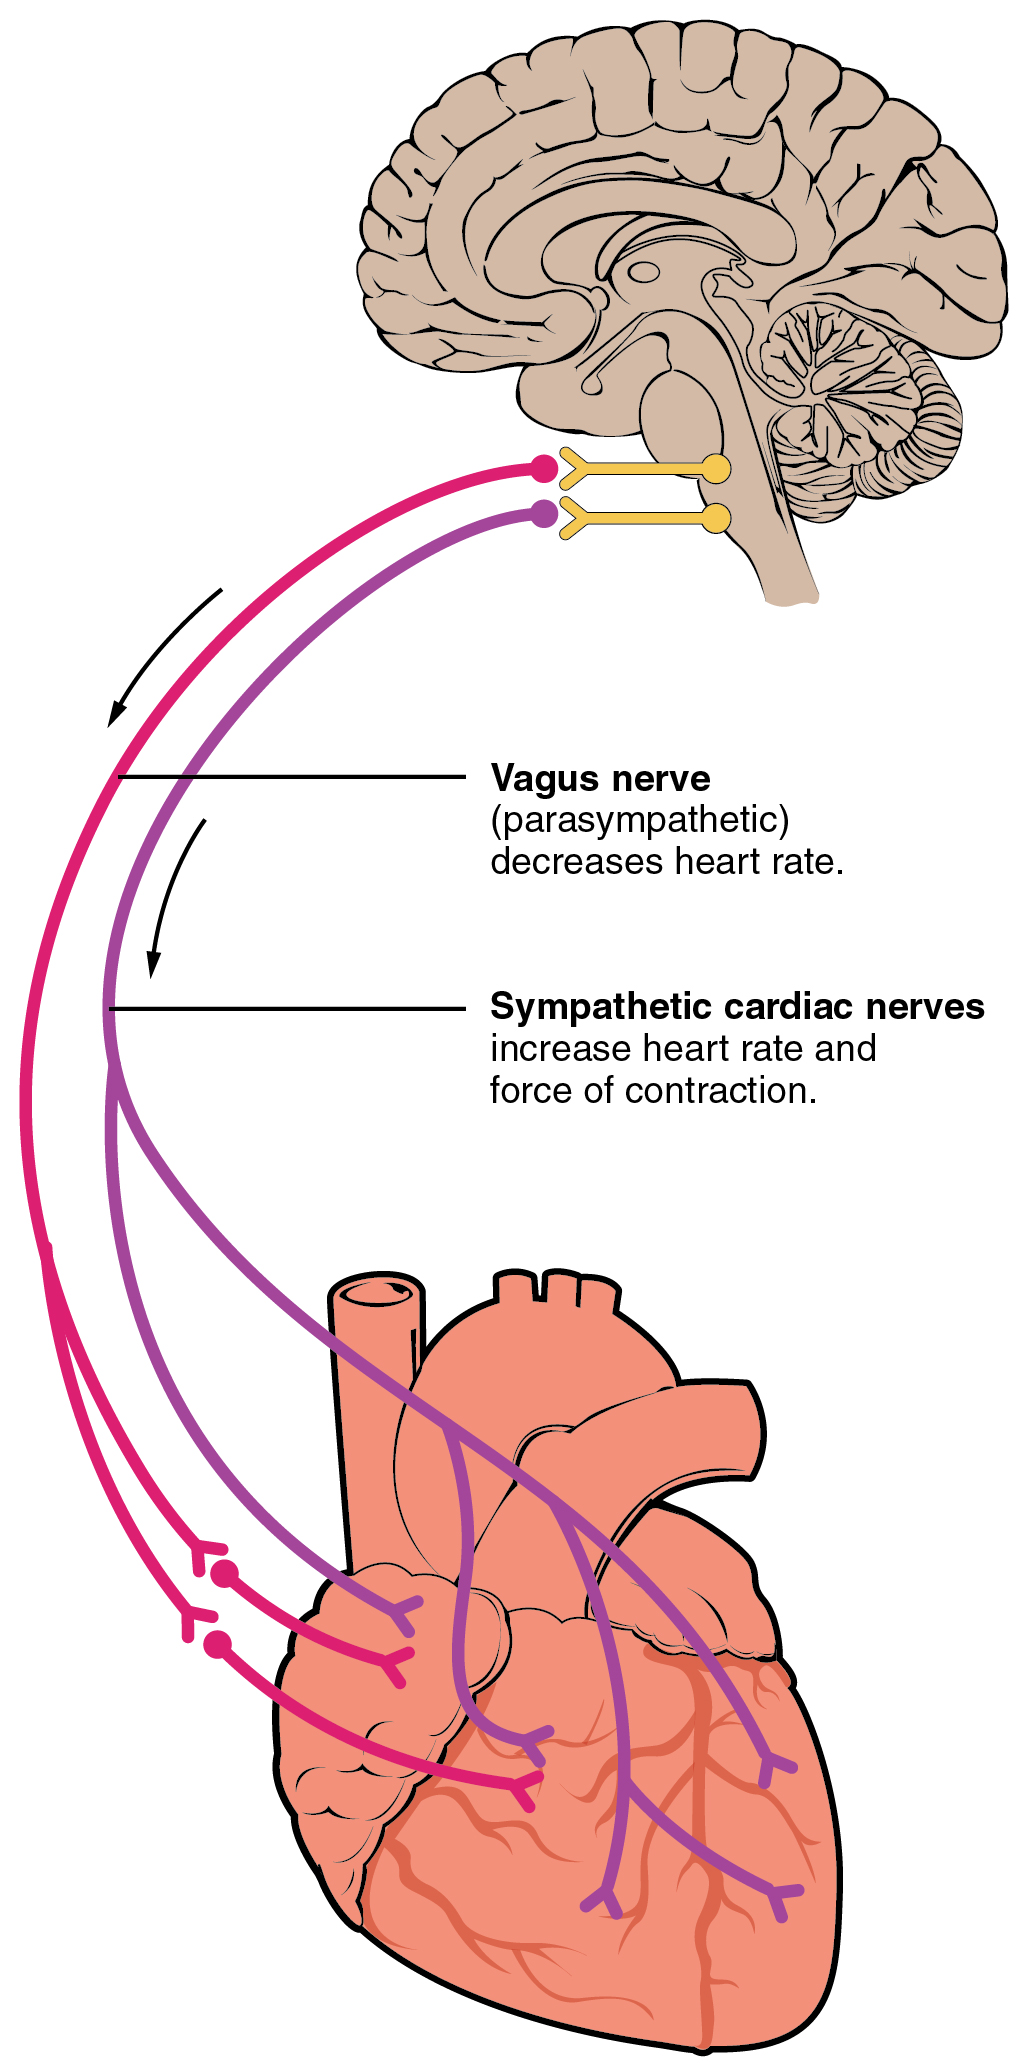
Parasympathetic influence of the heart occurs via the Vagus nerve (10th cranial nerve) which originates in the medulla and has axons that terminate directly into the heart. Vagal stimulation elicits an inhibitory effect on the SA node via release of acetylcholine, effectively reducing heart rate and is associated with “rest and digest” activity. Since vagal activity inhibits SA node activity, vagal withdrawal will result in less SA node inhibition and allow the heart to beat faster. At the onset of exercise, the initial increase in heart rate is a result of vagal withdrawal with a progressive increase in sympathetic activity as exercise persists (Yamamoto et al. 1991).

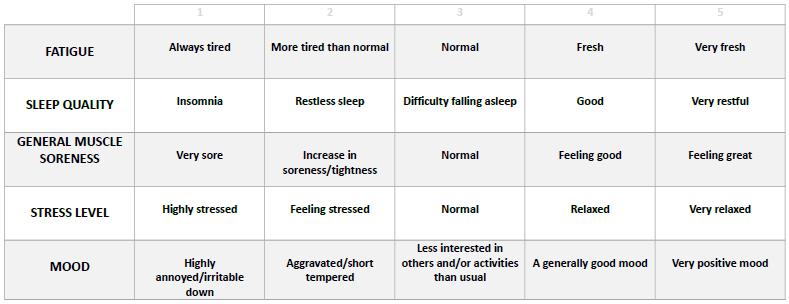
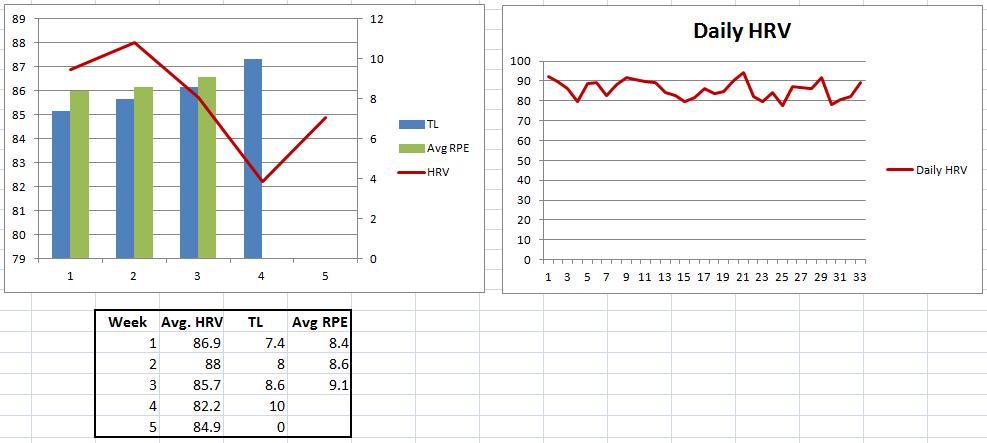
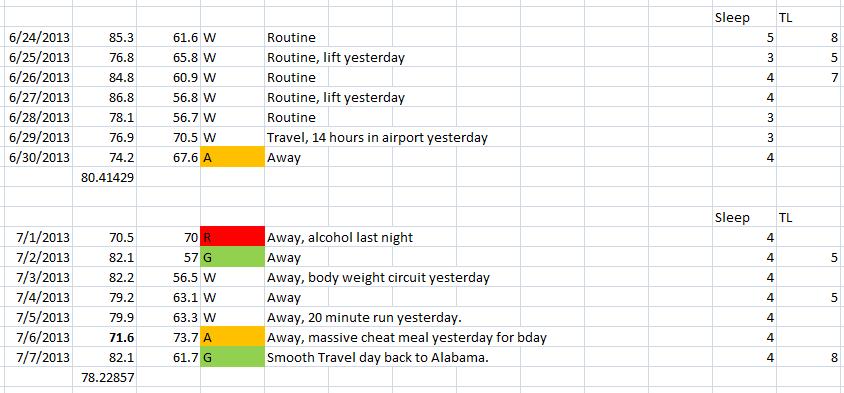
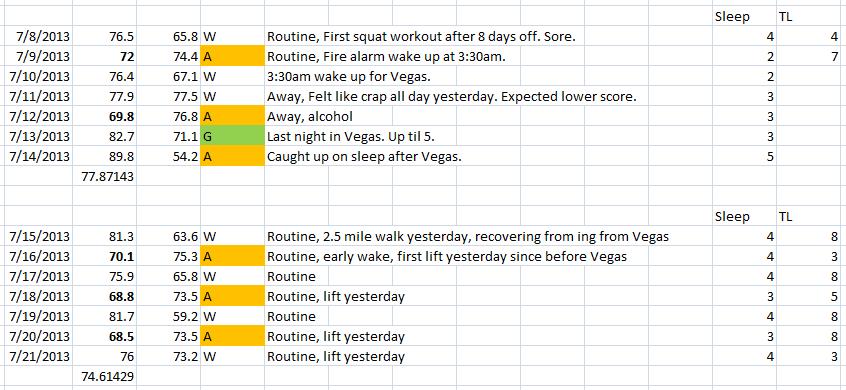
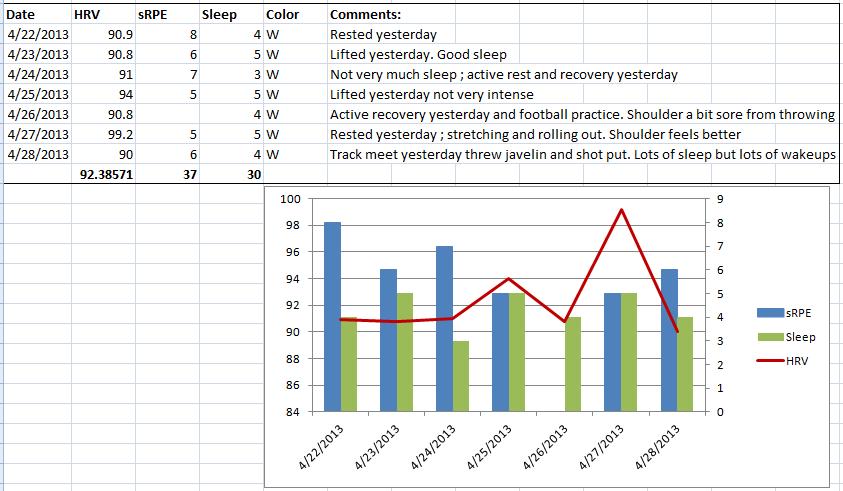
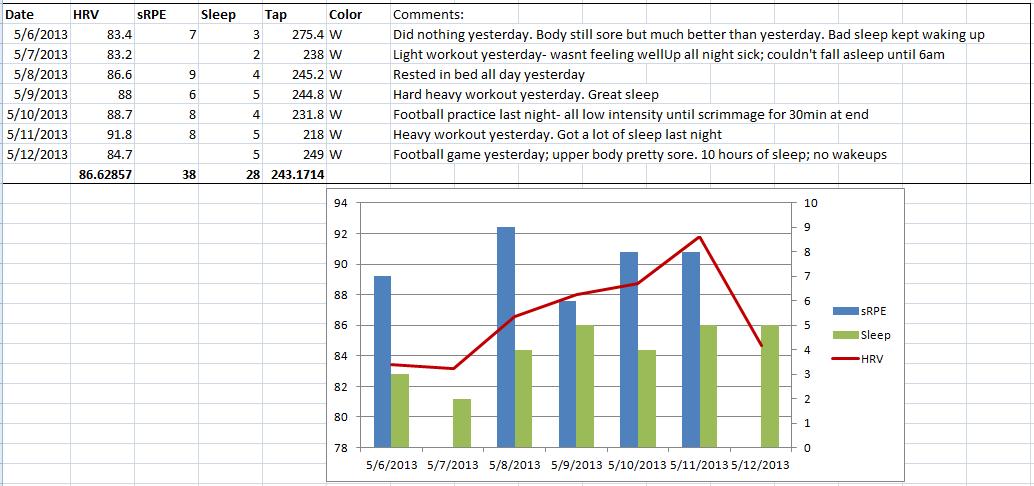
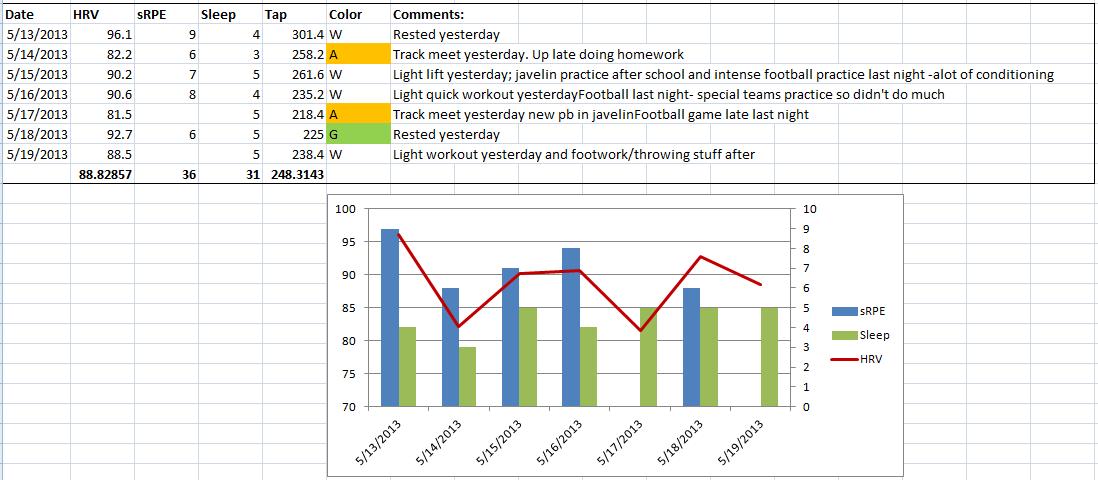
Since heart rate is directly affected by autonomic activity, it serves as a relatively simple marker for us to monitor to assess autonomic status. Increased parasympathetic activity will reduce heart rate and result in greater variability between R waves. In contrast, a higher heart rate with less variability (think more metronomic) is the result of reduced parasympathetic activity and possibly increased sympathetic activity.  HRV has thus become a valuable metric to monitor in athletes as it provides information regarding the relative balance of “stress” in the individual. Though I’m a proponent of HRV monitoring in athletes, its interpretation requires caution as nothing is black and white when it comes to determining an athlete’s training status from HRV, particularly from isolated measurements. Rather, taken with performance trends, psychometrics (perception of mood, soreness, fatigue, etc.), and training load, HRV becomes more meaningful.

In the next post, I will start to get into HRV analysis with some software screenshots to provide a good visual representation of HRV.


References/Recommended Reading:

Smith, D. & Fernhall, B. (2010) Advanced Cardiovascular Exercise Physiology. Human Kinetics. http://www.amazon.com/Advanced-Cardiovascular-Exercise-Physiology/dp/0736073922

Tortora, G. & Derrickson, B. (2006) Principles of Anatomy and Physiology 11th Edition. Biological Sciences Textbooks Inc.

Yamamoto, Y., Hughson, R. L., & Peterson, J. C. (1991). Autonomic control of heart rate during exercise studied by heart rate variability spectral analysis. Journal of Applied Physiology71(3), 1136-1142.

Reviewing HRV, RPE, 1RM and Grip Strength Data Over 6 Weeks

I’ve been continuing to collect data on a competitive powerlifter that trains out of our facilities here at AUM. This athlete has cerebral palsy and therefore only competes in raw bench press. Currently, he can press approximately 2.21x his bodyweight (265lbs at 120lb).  I’ve posted his older training cycle data previously here and here. This time around, I’ve been tracking a few different variables that are listed and described below. The purpose of this was to see if any of the monitored variables were able to reflect or predict daily variations in 1RM strength.

1RM – Unlike previous cycles, I calculated his 1RM bench press each session based on reps performed and RPE. For example; on his first working set of the day, if he performed 3 reps at an RPE of 9 (1 rep left in the tank), this was considered a 4RM weight and approximately 85% of 1RM using Mike Tuchscherer’s 1RM formula/table. I’ve chosen this specific formula because it is designed for powerlifters. We pause each bench press rep at the bottom which obviously decreases the total amount of reps that can be performed. After trying a few different formulas I found that most were under-predicting his actual strength.

Example:

230×3 RPE @9 = 4RM

Tuchsherer’s Formula: 1RM = 271.4

ExRx.net Calculator:  1RM = 251

Obviously, since many of these are calculated and not true 1RM’s, there is some give or take with these values.

sRPE – Following his workout, I asked him to rate the entire session on a 10 point scale. I do not multiply this by total reps performed but rather just use the rating as a general indicator of how hard the workout was for him.

Hand Dynamometry – Grip strength for each hand was assessed prior to each session via hand dynamometer (starting after week 2). You’ll note that there is a difference between his right and left grip strength due to his condition.

HRV – The athlete measured HRV each morning after waking on his iPod Touch with ithlete in a seated position.

Details of First Training Cycle (Weeks 1-3):

  •  3 weeks in duration
  • Trained 3 days/week (M-W-F)
  • Monday:  sets of 3 progressing from approximately 82% in week 1 to 87% by week 3
  • Wednesday: sets of 5 progressing from approximately 75% in week 1 to 80% in week 3
  • Friday: Singles progressing from approximately 92% in week 1 to 100% in week 3

Details of Second Training Cycle (Weeks 4-6):

  • 3 weeks in duration
  • Trained 3 days/week (M-W-F)
  • Monday: Same as previous cycle
  • Wednesday: Speed work progressing from 60-70% from week 4 to week 6 (no 1rm calculations on these days)
  • Friday: Same as previous cycle

Assistance work progressed each week and would consist of rowing/pull ups, dumbbell pressing variations and some lower body exercise.

Data is presented below:

Daily HRV and sRPE

Daily HRV and sRPE

Daily HRV & 1RM

Daily HRV & 1RM

*Regarding the last two 1RM’s on the above chart, 26o is likely lower than his true 1RM that day. He smoked it but I cut him off there. The 277 1RM was based off a 3RM calculation that is probably a little higher than his current ability.

Z_1rm_HRV_sRPE_10_2013

  • Daily sRPE shows a progressive increase from week 1 -3 which accurately reflects the progressive increase in intensity for his main work.  A decrease in HRV in week 3 along with high RPE’s and a slight decline in 1RM suggests some fatigue accumulation.
  • Week 4-6 is the second training cycle. Day one of week 4 is missed and therefore this cycle doesn’t start until the Wednesday. This missed workout caused us to slightly extend the cycle to fit one more lift in on a Monday of the last week.
  • Since Wednesday’s are speed focused in the second cycle, intensity is reduced and therefore, RPE was expected to be lower. However, Wednesday of week 6, the workout is rated quite high with an 8 which also happens to be on his lowest HRV day of the entire 6 weeks. The speed emphasis prevents me from collecting a good 1RM estimation and therefore average values are based on only Mon and Fri lifts in contrast to the previous cycle that allowed for 1RMs to be calculated on all three days.
  • In week 6, HRV peaks which is in complete contrast to the first cycle where HRV bottomed out in week 3. Interestingly, session RPE’s are lower in week 6 vs. week 3. As HRV declined in week 3, RPE increased, whereas in week 6, though intensity increased, HRV continued to climb and RPE did not increase. There are several instances where HRV relates to RPE (high RPE on low HRV days and vice versa).
  • 1RM avg peaked in week 6 along with HRV avg, however I included an extra workout (the last Monday) in this average as this was the day that made up for the missed workout at the beginning of the second cycle. Therefore the average is of 8 days (4 lifts) rather than the typical 7 days (3 lifts).
  • HRV on a given day doesn’t particularly appear to be a good predictor of the subtle variation in 1RM strength in this athlete, however weekly mean values showed a strong relationship. This of course needs to be taken in context with where one is within a training cycle. You won’t magically set a PR because your HRV is high or your weekly mean is high.

Raw Data Below

Z_rawdata_10_2013

  • Grip strength testing did not start until week 3. In this athlete, it does not seem to provide any insight as to daily performance potential, fatigue etc. Perhaps this assessment is more useful for lifts directly involving grip requirements (e.g. deadlifts, Olympic lifts, etc.).
  • Though not presented, sleep ratings never really dropped below 4 out of 5 and therefore sleep did not seem to be impacted by nor affect the other variables.

This data set has a laundry list of limitations. The main one being that 1RM’s were mostly calculated based on the athletes reported RPE of a set and not a true RM attempt, thus leaving plenty of room for error.

I attribute the adjustment in cycle 2 to its success compared to cycle 1. Adding in the speed work and removing the sets of 5 resulted in less fatigue and allowed for more recovery.

This data set convinces me of nothing, but simply encourages me to continue to explore the relationship between HRV and strength in athletes. Though no conclusions should be drawn, the main findings of this small case study are as follows;

  1. In this athlete, weekly average changes in 1RM Bench Press strength were related to weekly average changes in HRV (in all but week 5)
  2. On many instances, low HRV days corresponded to higher ratings of perceived exertion, however this didn’t necessarily affect strength performance.
  3. Grip strength assessed via hand dynanometer did not appear to be a useful indicator of anything in particular (other than grip strength of course) in this athlete.
  4. The peak in HRV and Strength in week 6 along with lower than expected sRPE suggests that the second cycle was well tolerated and fatigue was minimal (likely due to the programming adjustment). This is in contrast to week 3 from the end of the first cycle where HRV fell to lowest values, as did strength, while sRPE’s peaked.

Reviewing Survey Monkey as a free tool for Daily Wellness Questionnaires

Working with athletes in a team setting versus one on one or in small groups limits our ability to engage in small talk with each athlete before training or during warm-up. Being able to ask the athlete how they’re feeling, how they slept, how sore they are, what they’ve been eating, etc., provides insight as to the general state of the athlete and may be used to guide training on that particular day. Small modifications based on insight garnered from these conversations can help you determine if you’ll be pushing it a little harder or reducing the volume a little. Essentially, this is the simplest form of monitoring and managing training. However, it’s difficult to have 20 of these conversations before a workout with an entire team.

A popular method for acquiring this information without having to have individual conversations is to have your athletes respond to a “Wellness” questionnaire that surveys the athletes on their perceived quality of sleep, stress levels, soreness, etc. A brand new study from the JSCR by Gastin et al (2013), demonstrate the effectiveness of daily Wellness questionnaires (among many others). A team of Australian Football players were surveyed daily throughout their season with a brief questionnaire asking the athletes to rate levels of sleep quality, soreness, muscular strain, stress and so forth. Results showed that subjective ratings of physical and psychological wellness responded to weekly training adjustments. Scores reflected improved wellness (less strain, better sleep, etc) throughout the week allowing for optimal states for competition followed by significant decreases in overall wellness following competition. Scores also showed improvement during periods of unloading. Perhaps most interestingly, questionnaire scores discriminated individual differences for muscle strain following a competition as players with higher maximum speed reported higher levels of muscle strain. Evidently, simple daily questionnaires can prove to be quite insightful and useful for monitoring athletes.

If you’re part of a well funded program, you can purchase fancy software that will allow for easy data collection, interpretation and visualization of the data. Unfortunately this is not a luxury that most coaches have, particularly those involved in youth and amateur sports. In discussing this topic with Carl Valle a while back, he suggested Survey Monkey as a simple and free tool for collecting this data. So I created an account and have been testing it out over the last little while. Below are screen shots of its features, and some brief descriptions of how it works, pros, cons, etc.

Below is a screen shot of the survey I’ve been using. Thanks to Mladen Jovanovic, John Fitzpatrick, Aiden Oakley, Rhys Morris and Josh Dixon for their insights earlier this summer on survey options and collection methods. To my knowledge, this survey was created by Martin Buchheit.

wellness questionnaire

Creating a free account with Survey Monkey simply requires the user to provide an email address and create a password. However, the free account has restrictions (discussed later) but can be unlocked with upgrading and paying for premium accounts.

Admittedly, I am not the most tech savvy guy, so the number one thing I was hoping for was that it would be user friendly and intuitive… and it was.

Below is the screen for creating a new survey. Once you’ve created a survey you can re-create it easily with “Copy an existing survey”.

SM1

Creating survey questions:SM2

Once you’ve created your survey:SM3

Sending options for your survey:SM4

Add e-mail addresses of your athletes for email collection:SM5

Personalize the email (Default Shown):SM6

Schedule your survey delivery:SM7

Analyze results as a group:SM8

Or analyze results by individual:SM9

And the feature you’re likely wondering about… SM10

Sorry folks, need to upgrade your account to export data. They need to make money somehow, right?

A screenshot of what the athlete see’s in their email on their smart phone (this can be customized):

photo 1

A view of the actual survey after following the link from the email on Smart Phone:

photo 2

Pros:

  • Easy to create and send surveys
  • Nice visualization of the data
  • Can assess results as a team or individual with several options of how you want the data presented
  • Can schedule when the survey is to be delivered
  • All of these features are free
  • This can also be used to collect sRPE info by scheduling the survey to be sent at the appropriate time, provided you know session duration or total reps.

RPE

Cons:

  • As far as I’m aware, you must re-create the survey and schedule to send it every day. This takes about 2 minutes. If any of you are Survey Monkey experts and know how to automatically re-send the same survey with a new collector please tell me.
  • Data can be exported easily to excel but you must pay to upgrade your account for this feature
  • A numeric value is not assigned to a given rating e.g., 1-5 points. This must be done manually in excel so that you can create daily totals (out of 25 possible points). See Mladen’s free spreadsheet for more on this here

Hopefully this was helpful.

HRV and Training Cycle Review of Powerlifter with CP

I’ve been continuing to work with Zarius out of our lab here at AUM. I provided a detailed account of his  recent powerlifting meet prep and competition data in this post. Zarius is 22 years old, weighs 120lbs and has Cerebral Palsy. Due to travel/work schedules we have had a hard time completing a solid training cycle since his last competition earlier this summer. We were finally able to get a good 1 month of training in before one of us had to travel again. Here is an overview of the training and HRV data from our most recent training cycle.

The Plan:

Our schedules allow for 3 training days per week. We train full body every Mon-Wed-Fri. Zarius is able to do some lower body exercises and we always finish each session with some walking laps around the track. (As an aside, prior to getting involved with the Human Performance Lab here at AUM about a year ago, Zarius’ main mode of transportation was his wheel chair. Now he walks most of the time. A testament to the great work done by Dr. Esco and the staff here at AUM as well as the effort put forth by Zarius.) Since we’re not currently preparing for a meet, we only performed the competition press once per week and performed incline and narrow-grip press on the other two training days as his main movements. I also started recording RPE for each set of his main lifts. There is definitely a learning curve to using RPE so I take the earlier values with a grain of salt. Volume for the main lifts remained constant while intensity increased each week. For his assistance work we just did some basic progressive overload. Since we wouldn’t be training for at least a week after the training cycle I wanted to overreach him a little. Zarius recorded his HRV each morning after waking with ithlete in a seated position.

The Data and Analysis:

Z_Data_07_2013

* Training Load (TL) above is simply referring to the average intensity (%1RM) that we used for his main lifts that week. 7.4=74% , etc. For his future cycles, I’ll be collecting sRPE as he gets more comfortable with the rating system.

Week 1:

–          Lowest intensity week

–          Avg. RPE for main lift this week was 8.4

–          Previous week mean HRV was 85.2 to serve as a baseline, though not on chart. Near +2 increase (86.9) in HRV after week 1.

Week 2:

–          Intensity increases

–          Avg. RPE for main lifts this week increases slightly to 8.6

–          +1 increase in week mean HRV. Training is well tolerated and apparently not very stressful.

Week 3:

–          Highest intensity week

–          Avg. RPE for main lifts this week increases to 9.1. This week he had four RPE@10 compared to week 2 which had 1 RPE@10 and 0 in week 1. (RPE@10 means it was a maximal set, no further reps could be performed)

–          As expected and consistent with his previous meet prep cycle, HRV declines this week -2.3 to 85.7. You’ll note that on weekends his HRV tends to climb back up, indicating good recovery even though the week was quite physically stressful.

Week 4:

–          Low intensity lift on Monday

–          Bench 1RM Test with competition rules (pause and rack command) on Wednesday. Zarius pressed 260lbs cleanly (at 120lbs bodyweight) which is a 10lb Gym personal record and is 5lbs over his competition best of 255lbs.

–          – 3.5 change in HRV this week down to 82.2. This is consistent with his competition cycle where HRV reached lowest values the week of competition. However, we deloaded after week 3 of his competition prep which allowed HRV to recover and peak going in to competition. In this case, due to time constraints, we tested before the deload. It’s possible he may have been stronger with a proper deload before testing.

Week 5:

–          No training this week due to travel

–          HRV week mean returns to baseline at 84.9 (the week before the start of the cycle with no training had a week mean HRV of 85.2).

Overall, this was a successful training cycle based on the result of his 1RM test. Training to at or very near failure with high intensity appeared to have a large effect on his HRV during training evidenced by the downward trend starting in week 3. Though volume was reduced considerably, the 1RM test day appeared to be very taxing as it  had the biggest effect on his HRV (consistent with his previous competition). During week 5 where there were no training sessions, HRV returned to baseline values.

Here is a little video interview that the local media did on Zarius. Take a second and check it out. http://www.montgomeryadvertiser.com/apps/pbcs.dll/article?AID=2013130726027

HRV Reflects Travel Stress

Travelling is a part of competitive sport and is an issue that most athletes deal with on a regular basis. Non-athletes may not appreciate just how stressful travelling can be, particularly when it is combined with the demands of training, practice and competition schedules. I’ve learned that travel is especially more stressful for individuals who like to maintain a regular routine. This includes athletes who like to eat at regular times, train at regular times, sleep, etc. To make things worse, crossing time zone’s can add further issues by effecting sleep patterns and disturbing circadian rhythms.

I’m sure if your athletes are open and honest enough, they will be able to communicate any issues they’re experiencing as a result of the travel. However, there’s evidence to show that HRV monitoring is capable of reflecting the time course of individual adaptation to travelling via changes in autonomic activity in healthy folks (Tateishi & Fujishiro 2002, Tateishi et al. 2000). Taken with perceived stress and fatigue, an objective measure such as HRV may provide coaches a more complete picture of their athletes response to the stresses associated with travel.

Brief Research Review

Dranitsin (2008) investigated the effects of travel across 5 times zones and acclimatization to a hot and humid environment in 13 elite junior rowers. The athletes were monitored during a training camp in Kiev for 9 days and during training camp in Beijing for 17 days before and during the Junior Rowing World Championship. HRV was collected daily in the mornings after waking and bladder emptying with a Polar S810i (presently the RS800). Data was collected for 5 minutes supine followed by 5 minutes standing.

HRV parameters remained relatively unchanged after relocation to Beijing until the 3rd day. At this point, standing HRV values decreased until day 6 at which point they returned to baseline. Supine HRV did not show any significant changes until the 8th day of acclimatization. Parasympathetic measures (RMSSD, SD1 and HF) trended upwards in the standing position in response to 3 days of competition. The authors looked at correlations between HRV indices and training load, humidity, etc., but I will not discuss them. With all of the factors involved it would be very difficult to attribute a change in HRV to a specific variable. Overall, it was interesting to see a lag in the HRV response to the change in time zone and climate. The increase in parasympathetic HRV parameters in response to competition likely reflect fatigue although this is not discussed.

Botek et al. (2009) had a case study published investigating the effects of travel across time zones in two elite athletes; a male decathlete and a female swimmer. HRV data was collected upto 10 days prior to their flights and for an additional 8 days after relocation. HRV was measured with a VarCor PF 7 system in both supine and standing positions. Training load was prescribed based on recommendations from the VarCor PF7 software analysis (similar to OmegaWave in a way).

In athlete A (male, decathlete), parasympathetic indices of HRV decreased well below baseline on the day of the flight and remained suppressed until the 4th day after relocation. In athlete B (female, swimmer), HRV remained at baseline until the third day, at which point it decreased significantly. HRV was not recorded every day in athlete B but it appears that HRV trended back toward baseline in the subsequent days. The author’s mention that athlete B experienced larger than normal drops in HRV in response to familiar training which is interesting to note. The results from this case study suggest that HRV responses to travel across time zones are individual. Information about training load and manipulation based on HRV is presented, however it would’ve been nice to see discussion on how the athletes performed in competition as this is ultimately what matters most.

Personal HRV Data from Travel

Below I’ve posted my HRV data from the past 4 weeks that involved considerable travel. The comments provide details of what was happening on a day to day basis regarding location, training, etc.

“Routine” implies I’m at home following my regular routine, “Away” obviously implies that I’m out of town, not following my routine.

Toward the end of week 1, I traveled North-East for a little over a week. I returned home only for a few days at the end of week 2 before I headed South-West to Vegas for the NSCA conference.

Week 1 & 2 Data

Week 1 & 2

Week 3 & 4 Data

Week 1 – Best representation of baseline. HRV decreased on day 1 of travel.

Week 2 – Very little training this week. HRV appears most impacted from a night of drinking and again after my birthday which I attribute mainly to my eating.

Week 3 – The scores toward the end of the week are deceiving as the green indication indicated baseline/recovery. However, after very little sleep, I woke up and performed my measurement while I was barely awake. I could have fallen asleep standing if I shut my eyes. Furthermore, with the time difference and changed sleep pattern, my HRV measure would’ve been performed at an unusual time which can impact scores. The next day after returning from Vegas I slept for 10 straight hours and woke up with the highest score I’ve had in a long time. Clearly I was in recovery mode. I opted to go for a long, very low intensity walk (to the tune of “The Very Best of Cat Stevens” every single step of the way)  and held off on training til the next day.

Week 4 – Upon returning home and resuming my training, you can really see the effects of the last few weeks. Moderate workouts (low volume with moderate intensity) were tough and caused large drops in HRV with slow recovery. Additionally, and as expected, strength was down. This is due to both the travel (and associated life style) as well as the near cessation of training during that time. It is rare for me to see scores in the high 60’s and low 70’s but it dipped that low several times over the last two weeks.

For more effect I’ve added a weekly mean trend and my ithlete screen shots below.

Weekly mean

Weekly Mean HRV

Trend

TL Trend

There is a clear downward trend over the 4 week period. The result of which can be attributed to several factors, not just the travel aspect. Obviously, with more preparation and more effort, I could have minimized these effects and maintained my training. It goes without saying that competitive athletes will likely have much more structure to their transitioning from one time zone to another to reduce the negative effects as much as possible.

So, from my experience and based on the limited research on the topic, it appears that; a) response to travel stress is individual and b) when considered with subjective measures of fatigue,  HRV may serve as a useful tool for reflecting the effects of travel and the associated period of adaptation.

conference NSCA 2013

NSCA Conference 2013

References

Botek, M., Stejskal, P., & Svozil, Z. (2010). Autonomic nervous system activity during acclimatization after rapid air travel across time zones: A case study. Acta Universitatis Palackianae Olomucensis. Gymnica39(2), 13-21.

Dranitsin, O. V. (2008). The effect on heart rate variability of acclimatization to a humid, hot environment after a transition across five time zones in elite junior rowers. European Journal of Sport Science8(5), 251-258.

Tateishi, O., & Fujishiro, K. (2002). Changes in circadian rhythms in heart rate parasympathetic nerve activity after an eastward transmeridian flight. Biomedicine & Pharmacotherapy56, 309-313.

Tateishi, O. et al. (2000). Autonomic nerve tone after an eastward transmeridian flight as indicated by heart  rate variability. Annals of Noninvasive Electrocardiology, 5(1), 53–59.

RMSSD: The HRV Value provided by ithlete and BioForce

Most individuals who take their sport or training very seriously have likely heard of heart rate variability (HRV). Thanks to devices such as the Polar RS800 (Formerly S810) wrist-watch/heart rate monitor and eventually ithlete, the first (to my knowledge) commercially available smart phone HRV application, HRV data can be collected easily and affordably. The recent accessibility of HRV tools has resulted in greater usage, more data and of course greater popularity.

What most folks aren’t aware of however is that HRV is not a solitary figure or value. In fact, numerous HRV parameters exist that are supposedly representative of different autonomic variables. Below is a brief list and description of popular HRV analysis methods and values (many more values exist than described).

Time Domain Analysis: This method includes statistical and geometrical analysis of R-R interval data. Common statistical time domain values include:

  • SDNN – Standard Deviation of Normal to Normal intervals.
  • RMSSD – The square root of the mean squared difference between adjacent N-N intervals.

*Note:  NN or “normal to normal” is used to denote that only “normal” beats originating from the sinus node are measured. Impulses from other areas within the myocardium (non-sinus node impulses) are termed ectopic beats. Ectopic beats disturb normal cardiac rhythm and can therefore affect HRV. Generally 3 or more ectopic beats within a short-term measurement meets criteria for exclusion in many research papers.

Frequency Domain Analysis: This method is considerably more complex than time domain analysis and often requires longer measurement durations. It assesses how variance is distributed as a function of frequency.

  • HF – High Frequency Power: A marker of Parasympathetic Activity
  • LF – Low Frequency Power: A marker of both Parasympathetc and Sympathetic Activity
  • LF/HF – Low Frequncy/High Frequency Ratio: Once thought to represent the balance between sympathetic and parasympathetic activity however this remains a hot topic of debate.

As you can see, saying something along the lines of “My HRV is low today” is really vague. I’m sure I’ve been guilty of this in the past. More often than not, most people are referring to their RMSSD value as this is the same parameter provided by ithlete and BioForce (among other HRV tools).

The RMSSD is commonly used as an index of vagally (Vagus Nerve) mediated cardiac control which captures respiratory sinus arrhythmia (RSA), the frequent changes in heart rate occurring in response to respiration (Berntson et al. 2005). During inhalation, heart rate speeds up. During exhalation, heart rate slows down. RMSSD is an accepted measure of parasympathetic activity and correlates very well with HF of frequency domain analysis (discussed above).

PhD candidate and HRV researcher James Heathers provides a good explanation of why we would want to track changes in RMSSD vs. other HRV values throughout training here. I’d like to add that RMSSD is one of the few meaningful values that we can acquire with ultra-short measurement durations. It’s generally accepted that a 5 minute recording is the gold standard for HRV analysis (Task Force 1996). However, 5 minutes is entirely too long if we expect compliance from athletes or individuals. Thankfully, ample research exists that shows that ultra-short (60 seconds or less) RMSSD values (randomly selected from within a 5 minute recording) highly correlate with RMSSD from the standard 5 minute ECG recording (Katz et al. 1999; Mackay et al. 1980; Nussinovitch et al. 2012; Nussinovitch et al. 2011; Salahuddin et al. 2007; Smith et al. 2013; Thong et al. 2003). Unfortunately no research exists that tested the suitability of ultra-short RMSSD in athletic populations so my colleague Dr. Mike Esco and I went ahead and did this very recently in athletes at rest and post-exercise (paper currently in peer review). I will let you know what we found once it gets published.

Why does my HRV score (from ithlete or BioForce) look different from the values in research?

I hope you are not comparing your ithlete or BioFroce scores to data you see in published research. Simon, the creator of ithlete, decided to modify the RMSSD value collected by ithlete to make for a more intuitive and easily interpretable figure for non-expert users. The value you see from the app is the natural log transformed RMSSD multiplied by 20 (lnRMSSDx20). This modification essentially provides a figure on a 100 point scale (though ithlete scores above 100 are possible in highly fit individuals, though not common).

*Note: lnRMSSDx20 is a patented formula and therefore those interested in using this commercially must acquire a licence.

Wrap-up

To be clear, RMSSD is only one HRV parameter. By no means was this article suggesting that other HRV values are meaningless. The purpose of this blog was to simply provide an explanation of the what and why of RMSSD since so many people are using ithlete and BioForce lately. Certainly, ECG derived HRV remains the gold standard and likely multiple HRV parameters provide a more complete picture of training status verses just one. However, for the purposes of convenience in non-expert users, the RMSSD provides an easily acquired and interpretable figure in a short period of time that reflects parasympathetic activity which is quite useful for monitoring the effects of training and in the manipulation of training loads.

References:

Berntson, G. G., Lozano, D. L., & Chen, Y. J. (2005). Filter properties of root mean square successive difference (RMSSD) for heart rate. Psychophysiology,42(2), 246-252.

Camm AJ, Malik M et al. (1996) Heart rate variability: Standards of measurement, physiological interpretation and clinical use. Task Force of the European Society of Cardiology and the North American Society of Pacing and Electrophysiology. Circ 93(5): 1043-1065

Katz A, Liberty IF, Porath A, Ovsyshcher I, Prystowsky E (1999) A simple bedside test of 1-minute heart rate variability during deep breathing as a prognostic index after myocardial infarction. Am Heart J 138(1): 32-38

Mackay JD, Page MM, Cambridge J, Watkins PJ (1980) Diabetic autonomic neuropathy. Diabetol 18(6): 471-478

Nussinovitch U, Cohen O, Kaminer K, Ilani J, Nussinovitch N (2012) Evaluating reliability of ultra-short ECG indices of heart rate variability in diabetes mellitus patients. J Diabetes Complic 26(5): 450-453

Nussinovitch U, Elishkevitz KP, Katz K, Nussinovitch M, Segev S, Volovitz B, Nussinovitch N (2011) Reliability of ultra‐short ECG indices for heart rate variability. Ann Noninvasive Electrocardiol 16(2): 117-122

Salahuddin L, Cho J, Jeong MG, Kim D (2007) Ultra short term analysis of heart rate variability for monitoring mental stress in mobile settings. Conf Proc IEEE Eng Med Biol Soc 4656-4659

Smith AL, Owen H, Reynolds KJ (2013) Heart rate variability indices for very short-term (30 beat) analysis. Part 2: validation. J Clin Monit Comput E-Pub Ahead of Print

Thong T, Li K, McNames J, Aboy M, Goldstein B (2003) Accuracy of ultra-short heart rate variability measures. Conf Proc IEEE Eng Med Biol Soc 3, 2424-2427

Exam Stress Impact on HRV and the Immune System: Implications for Student Athletes

The importance of academic examination periods for student athletes at both the high school and collegiate level cannot be overstated. In most cases, academic performance can affect scholarship money (in the collegiate setting); playing time; academic standing (probation) and so forth. Any former athlete can probably attest that exam weeks involve a lot of cramming, plenty of caffeine, suboptimal eating habits and sleep deprivation. Needless to say, the added stress load from exams and exam preparation can have consequences on physical health and possibly performance. In this discussion I will review the available literature pertaining to exam periods and HRV in students to determine its potential usefulness at reflecting this stress. In addition, I will present and discuss some data I’ve collected from a couple of students during their recent exam weeks.

*Note: Very little of the research specifically involves student-athletes.

Perhaps one of the more interesting studies involving college students over exam periods was performed by Dimitriev et al. (2008). Female students (n=70, Age 20-25) were evaluated twice; once during the semester and once on the morning of examinations. Data on HRV, blood pressure, state anxiety and self-reported test performance (how they expected to perform on the exam) was collected. Essentially, students who performed the best on exams were the most pessimistic and showed the largest decrease in parasympathetic indices of HRV (HF and RMSSD). Students who performed best on the exams tended to have a higher state anxiety compared to during the semester while poor performers showed less state anxiety and less change in HRV.

Srinivasan et al. (2006) evaluated perceived stress and HRV in 36 male and female first year med students. A strong correlation was found between the high stress group and LF and LF/HF HRV parameters. Though not statistically significant, there was also a tendency for lower HF values among the high stress group. Kumar et al. (2013) also reported reductions in HRV in med students over exams compared to periods of lower stress before and after exams.

In a study by Tharion et al. (2009) a group of 18 undergraduates (9 male, age 18.7) had HRV and blood pressure assessed on the morning of examination (high stress) and one month later during holidays (low stress). As expected, during the exam period students showed lower HRV (total variability of both time and frequency domain). Interestingly changes in LF, HF, LF/HF and RMSSD were not statistically significant, though there were differences. These changes are likely still meaningful.

An investigation involving 20 female undergrads (age 18-19) showed that compared to the non-exam period, HRV parameters gathered during exams decreased (RMSSD, HF, with increases in LF and LF/HF) indicating a withdrawal of parasympathetic modulation and increase in sympathetic tone (Zaripov & Barinova, 2008). This was despite no changes in perceived stress during exams. Simic and colleagues (2006) reported a linear increase in perceived exam apprehension leading up to exams while HRV reached lowest values during exams and  increased thereafter.

This next study did not include HRV analysis however I felt it was worth including. Kang et al. (1997) collected blood samples from 87 high-school students at mid-semester, final exams and post-exams to assess immune responses to the academic stressor. Results showed that during the exam week there were significant immunological alterations; “Natural killer cell activity was significantly lower, whereas lymphocyte proliferation and neutrophil superoxide release were significantly higher. These immune changes tended to return toward baseline during the postexam period, but the enhanced neutrophil reactivity continued to rise.” Another study involving first year med students also found a strong link between stress related immunosuppression and health based on blood sample assay.

Athletes may be at greater risk of immune suppression compared to non-athletes because of the physical demands (strain, monotony) of their sport participation (Putlur et al. 2004). Enforcing responsible exam preparation will increase likelihood of exam performance and reduce the need for procrastination which is a major contributing factor to stress among students (Tice & Baumeister, 1997).

Data from a High School Football Player Over Exams

  • Exam week occurs in the last week of the ithlete trend below.
  • Following Monday, HRV remains well below baseline until Saturday
  • Poor sleep due to late nights studying
  • Though the athlete is currently involved in various Track & Field events as well as summer football, he had no competitions during exam week.

VL_Exam

Below is the weekly mean HRV in the 3 weeks prior to and the exam week.

  • HRV weekly mean does not reflect the acute stress experienced by this athlete day to day (a limitation of only assessing weekly mean)
  • Overall the exams appeared to be only a moderate stressor for this athlete
  • I included reaction test data because it was available; interestingly it was also effected (slower) during exam week
  • See here for more details and info on the Reaction Test

V_Exam_Big_Trend

I have included solo charts of the HRV and Reaction trend because I continue to see a consistent negative correlation between  HRV weekly mean and Reaction weekly mean. These charts reflect this relationship better than the above chart.

V_Exam_HRV_AVG

Weekly Mean HRV Trend

V_Exam_Reaction_AVG

Weekly Mean Reaction Time Trend

Data from a Grad Student Strength Coach in the Final Weeks of School

Below is the ithlete HRV data from a colleague who had a very stressful last month of grad school.

  • Week 1 represents baseline
  • Week 2 is the week before major presentations and a research paper due date. He reports this week to be highly stressful
  • Week 3 -5 include presentations, final exams, research paper deadlines, etc.
  • Week 6-7 represent the ascent in his HRV trend back to baseline after completing his school work.
  • Both the weekly mean trend and the daily trend provide a good reflection of his perceived stress
J_dailyHRV_exams

Daily HRV Trend

J_weeklyHRV_exams

Weekly Mean HRV Trend

Closing Thoughts 

Not surprisingly, exam periods are stressful for students. HRV appears to do a reasonably good job of reflecting this. However, responses tend to be individual with some students being more effected than others. If competitive seasons conflict with examination schedules, coaches may want to consider reducing training loads or at the very least, keep a closer eye on fatigue and stress in their athletes. Using a proactive approach by enforcing responsible exam preparation far enough in advance (study hall, tutoring, etc.) should reduce potential stress related issues by discouraging procrastination and associated changes in life style. Of course this is much easier said than done.

References

Dimitriev, D. A., Dimitriev, A. D., Karpenko, Y. D., & Saperova, E. V. (2008). Influence of examination stress and psychoemotional characteristics on the blood pressure and heart rate regulation in female students. Human Physiology, 34(5), 617-624.

Glaser, R., Rice, J., Sheridan, J., Fertel, R., Stout, J., Speicher, C., … & Kiecolt-Glaser, J. (1987). Stress-related immune suppression: Health implications. Brain, behavior, & immunity1(1), 7-20.

Kang, D. H., Coe, C. L., McCarthy, D. O., & Ershler, W. B. (1997). Immune responses to final exams in healthy and asthmatic adolescents. Nursing research46(1), 12-19.

Kumar, Y., Agarwal, V., & Gautam, S. (2013). Heart Rate Variability During Examination Stress in Medical Students. International Journal of Physiology, 1(1), 83-86.

Putur, P. et al. (2004) Alteration of immune function in women collegiate soccer players and college students. Journal of Sports Science & Medicine, 3: 234-243.

Shrinivasan, K., Vaz, M., & Sucharita, S. (2006). A study of stress and autonomic nervous function in first year undergraduate medical students. Indian Journal of Physiology & Pharmacology, 50(3), 257.

Simić, N. (2006). Evaluation of examination stress based on the changes of sinus arrhythmia parameters. Acta Medica Croatica 60(1): 27.

Tharion, E., Parthasarathy, S., & Neelakantan, N. (2009). Short-term heart rate variability measures in students during examinations. Natl Med J India, 22(2), 63-66.

Tice, D. M., & Baumeister, R. F. (1997). Longitudinal study of procrastination, performance, stress, and health: The costs and benefits of dawdling. Psychological Science, 454-458.

Zaripov, V. N., & Barinova, M. O. (2008). Changes in parameters of tachography and heart rate variability in students differing in the level of psychoemotional stress and type of temperament during an academic test week. Human Physiology, 34(4), 454-460.

HRV and Training Density

I’m about to start week 3 of a new training cycle. In reviewing my HRV trend from the past two weeks you’ll see a massive change from week 1 to week 2. Clearly, last week was significantly more stressful than week 1. This was unintentional. I decided to do some calculations to see what may have happened.

1 Month Trend

1 Month Trend

The goal of this phase is to progressively accumulate volume with moderate loads over a 3 week period with a slight reduction in week 4. However, I am very undisciplined in these phases and always go heavier than I should, too soon. I vary set/rep ranges each week but try and stick to lower RPE’s. I like to really focus on technique development during these phases since the loads are supposed to be lighter.

Here is what the two weeks looked like for my main working sets (assistance work not included as it was very similar):

Week # of Lifts Total Volume Avg. RPE
1 70 43300 7-8
2 56 43200 8-9

Total volume was pretty much unchanged but should’ve increased slightly. RPE generally went up to 9’s on my last set in each workout of week 2 (straight sets) but should’ve remained at 8 or below (no chance I was taking weight off the bar though -my meathead-self trumps my logical-self in the gym quite often). Number of lifts decreased by 20% yet volume was matched due to a relative increase in intensity; too much, too soon. If my goal was to increase training density, than I would’ve been quite successful.

I selected weight ranges in week 2 that should’ve been at the appropriate RPE based on estimations. However, for whatever reason, starting on Monday the weight didn’t feel as light as it should have. Rather than lower the load like I should have, I simply performed less sets.

Regarding HRV, I do expect to see some progressive decline as volume increases,  but not a -8 weekly change. Though I can’t think of anything major outside of training that could’ve contributed to the significant change in the trend, non-training related stressors are always a factor, whether we perceive them to be or not.

In conclusion I failed to accomplish my goal of progressively increasing volume with moderate loads but rather increased training density purely as a result of undisciplined load selection. HRV responded with a significant decrease in the trend and I am now starting week 3 in the hole. Lesson learned.

Monitoring Training in a High School Football Player

Though I’m currently a solid 17 hour drive away from home, I still correspond with several athletes I formerly worked with prior to my relocation. I’ve got a few athletes sending me their ithlete data every week. I finally had time to sit down and analyze some of it and so today I’ll present and discuss the past four weeks worth of data from a high school football player.

Basic Descriptors

This athlete is currently a high school sophomore and will be the starting Quarterback for his high school Varsity Football Team. In addition to high school football, this athlete is also competing in track and field (Javelin, Shot Put and Triple Jump) and summer football.

Monitoring Variables

HRV: The athlete measures HRV with ithlete in a standing position  every morning after waking and bladder emptying.

Subjective Sleep Score: Following his HRV measurement, sleep was rated (1-5 scale) and comments were entered regarding the previous days events on the ithlete app.

sRPE: I also asked the athlete to provide a rating of perceived exertion score after each training session, practice or competition (1-10 scale) and input this into the ithlete training load feature. This is not multiplied by session duration.

Reaction Test: Lastly, the athlete performed a simple reaction test with this application after ithlete to assess psycho-motor speed.

My rationale for the selected variables is quite simple:

  1. These tools/metrics are simple, inexpensive and non-invasive
  2. The total time required to complete these is between 3-5 minutes each day. Keeping them easy and quick helps with compliance which as you’ll see, was a non-issue for this athlete.
  3. I wanted both objective and subjective markers
  4. The Reaction test often gets talked about but rarely do I see any data. After having some personal success with it I decided to test it out with him.

4 Weeks of Data and Analysis

The following data is from the last 4 weeks where the athletes Track&Field  and Football schedules overlapped, resulting in a significant increase in physical stress. I have no influence on his current training, schedule, etc. and therefore this analysis is entirely retrospective. Furthermore, I always recommend that training and life style remain unchanged when people start using ithlete. After a few months of training we then analyze the data and determine what course of action to take from there. By making training/life style manipulations right from the start it will be hard to determine how effective they may be. With that said, the data is presented below, broken down into each constituent week.

*Note: Click images to enlarge. Reaction test results fall under “Tap” in the tables starting in week 2.

Week 1

Week 1

Week 1:

  •  No Reaction Test data this week, commences in week 2.
  • Training appears to be well tolerated all week with a spike in HRV after a rest day followed by a track meet on Saturday 4/28. The track meet appears to be more stressful than is perceived by the athlete based on the 9 point drop.
  • Training load weekly sum is 31
  • HRV weekly mean is 92.4
Week 2

Week 2

Week 2:

  • He appears to be insufficiently recovered from the track meet and persists with intense training. HRV remains below 90 all week while the previous week stayed above 90.
  • With some fatigue accumulated he has a track meet on Friday followed by a Football game on Saturday. The trend this week indicates high fatigue compared to the previous week.
  • Training load weekly sum increases by 16%.
  • HRV weekly  mean drops by 8 points; Sleep total drops slightly, First Reaction weekly mean is 262.1
Week 3

Week 3

Week 3:

  • Poor sleep and high soreness is reported early this week after the very stressful previous week. On 5/7 he stays home from school with cold/flu symptoms.
  • He recovers quickly and the rest of the week looks pretty good as his HRV trends back  up over 90.
  • Football game on Saturday causes a decent drop in HRV. Sunday is a rest day.
  • HRV weekly mean improves to 86.6; Training load decreased; Reaction speed decreased (faster).
Week 4

Week 4

Week 4:

  • HRV peaks at 96 after a much needed day off on Sunday
  • 2 Track meets this week with a new personal best throw; perceived training load decreases slightly and HRV started trending up approaching 90.
  • HRV weekly mean increases slightly, Sleep quality increases, Reaction Time is similar to previous week (slight increase).
4 Week Trend

4 Week Trend

Further Analysis 

In the screen shot below, I’ve included a table and chart of the weekly mean of HRV and Reaction Time, as well as the weekly sums of Training Load and Sleep score. In the table to the right I’ve calculated some correlations.

Mean Values, Correlations

Mean Values, Correlations

Brief Thoughts

This data set supports the theory of monitoring not just the daily, but also the weekly trend changes in HRV. However, keeping tabs on the day to day changes, particularly after intense workouts or competition, can allow for more appropriate training load manipulations to try and influence the weekly changes. This is particularly important during a competitive season where overreaching is not desired. Clearly in this case, the athlete experienced some overreaching after the abrupt increase in physical stress evidenced by his illness, disturbed sleep etc. However, the overreaching was short-term and the consequences short-lived as he quickly recovers. When HRV peaks in week 4 we also see an increase in performance (Track PR). Of course the overreaching easily could have been avoided had he not been trying to train for and compete in two different sports at the same time. However, this is the reality of many high school athletes who try and juggle multiple sports in the same season.

Similar to my experience discussed here, his Reaction test essentially mirrored HRV when the weekly means were calculated. Perceived training load clearly had the biggest effect on these two variables. Unfortunately we didn’t incorporate the Reaction Test until week 2 so keep that in mind when looking at the correlation values as week 1 was not included with Reaction Time.

In this case, I do not believe that the RPE of the competitions provided a good reflection of actual competition stress. In many cases when he had a competition, HRV would decline quite a bit yet the RPE would be moderate. Competing adds another element of stress unaccounted for in these situations which should be considered by coaches.

I believe that this athletes short term overreaching and subsequent illness and sleep disturbances could easily have been avoided. Reacting to the decrease in HRV, increase in Reaction time, increased soreness, poor sleep ,etc. by allowing for more recovery time likely would’ve averted this. However, how this would effect his performance in the following weeks when HRV peaks and he see’s an increase in performance is unknown. After several days of a decreasing trend in HRV, rest should be strongly considered, particularly during competition periods.

The comments section of ithlete was valuable in communicating to me brief details about what in particular may be causing stress. This is an undervalued and underrated feature in my opinion.

HRV and Reaction test weekly mean and perceived training load weekly sum each appear to be sensitive markers of the physical stress load experienced by this athlete. Adjusting training loads appropriately in response to these variables may have prevented the unintentional overreaching and illness experienced by this athlete. From this set of data we can conclude that HRV, Reaction test and perceived exertion ratings were effective markers of training status with this athlete.

HRV Case Study of a Powerlifter with Cerebral Palsy Preparing for Competition

Shortly after my relocation to Alabama, I was given the opportunity  to oversee the competition preparation of a young powerlifter who had been training here at the AUM Human Performance Lab under the care of Dr. Mike Esco and his staff. He was about 5 weeks out from competition at the time of my arrival. Below is a detailed account of the training program with HRV data, training load and sleep score.

The athlete is a 22 year old male with Cerebral Palsy and can therefore only compete in the Bench Press. He competes in the 123lb weight class (actual weight is 121). His best competition lift was 200lbs recorded this past February at his first competition.

After observing a couple of workouts, I could see that Zarius was missing out on some poundage due to technical flaws. The focus of the program was therefore to improve his bench press technique and get him more accustomed to the competition commands. We trained 3x/week and used a full body, undulating approach that enabled us to Bench Press each session to further develop technique.

The original program is below and was followed with only minor adjustments here and there. The chosen sets/reps and percentages were inspired by those outlined Tri-Phasic Training. This allowed for the completion of only quality reps; avoiding failure and saving the grinding for competition. You’ll notice the corresponding rep ranges for each percentage are well below typical capabilities. (i.e. 85%x2 rather than 85%x5-6). Assistance work progressed in weight or reps each week based on performance.

Z_program

Beginning on day one of week one, the athlete recorded HRV each morning with ithlete on his iPod Touch in a seated position. Sleep was rated on a scale of 1-5 on the app. Training load was manually entered based on training intensity to make interpretation easier from the trend in relation to his HRV. Perceived values are not included.

Below is all of the raw data as it appears when exported from the app into Excel followed by a recreation of his 4 week trend. I’ve highlighted high and low HRV days in the respective colors used by ithlete. You’ll note that measurements are missing on two occasions; 4/18 and 5/12.

Z_raw_data

Z_trend

Below are images of his weekly averages of HRV and training load. Training load in this context is simply intended to represent a progressive increase in intensity followed by a deload and then competition.

Z_avg_table

Z_avg_trend

There’s a clear progressive increase in his HRV trend right up until the start of week 3. Week 3 was the highest intensity training week with a slight reduction in volume. It appears that intensity rather than volume created more fatigue. His HRV peaks during the deload week. The deload week included 2 workouts. On Monday we worked up to his opener of 240lb for a single and on Wednesday we worked up to 70% for a few singles with emphasis on the competition commands and pausing.

You can see that the morning of the competition (5/11) there is a small drop in HRV. I attribute this to pre-competition anxiety based on feedback of mood, perception, etc. He appears to have slept well leading up to the meet. HRV remains suppressed until the 3rd day after the competition where it starts to trend back up, however still remains below average. This clearly shows the additional psychological/emotional stress that competing places on the body.

Results

1st Attempt – 240 Good
2nd Attempt – 250 Good
3rd Attempt – 255 Miss at lockout (very debatable)

He added 50lbs to his competition best since February. His next meet will be in October where he’ll be looking to shorten the gap he has to close to fulfill his dreams of qualifying for the Paralympics.

943236_10100344933474230_863845112_n