Here’s a quick look at our latest study examining cardiac-autonomic responses to preseason camp in the heat among college football players. The free full text can be accessed here: Heart rate variability in college football players throughout preseason camp in the heat IJSM.
Intensive training periods tend to increase RHR and decrease HRV, reflecting stress and fatigue. However, adaptations to heat exposure (e.g., plasma volume expansion) tend to have the opposite effects. So we wanted to see what happens when players were exposed to both intense training and intense heat stress during preseason camp.
Despite increases in perceived fatigue throughout the 2-week period, RHR and HRV reflected responses consistent with heat acclimation.
HRV initially decreased in linemen, then peaked after a day of rest. Non-linemen faired a little better with smaller decrements in perceived fatigue and more frequent day-to-day improvements in RHR and HRV.
These results indicate that heart rate parameters and perceived fatigue are independent markers of training status, and that desirable cardiovascular adaptations can occur in the presence of soreness and fatigue.
This is especially important for tech companies who try to infer recovery status from HRV alone. As HRV improved throughout camp, an app’s algorithm would report to coaches that players are well-recovered. Given that no player feels well-recovered during preseason camp in the heat, the technology suddenly loses credibility for being wrong and will likely be dismissed.
This is unfortunate because the heart rate parameters are likely reflecting important adaptations that may indicate better tolerance to training in the heat, a reduced exercising heart rate, and improved fitness. Thus, I encourage users to ignore “recovery” scores and interpret the data in appropriate context.
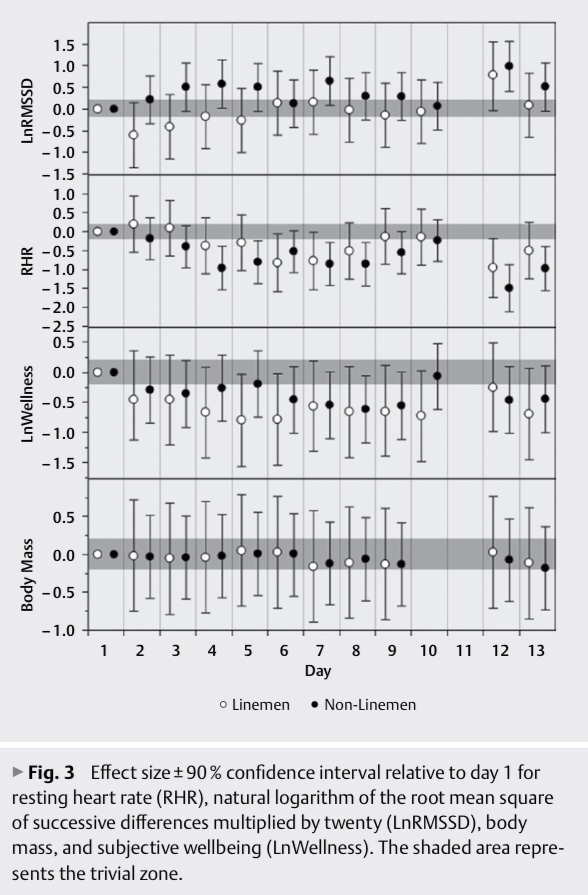
We aimed to characterize cardiac-autonomic responses to a 13-day preseason camp in the heat among an American college football team. Players were categorized as linemen (n=10) and non-linemen (n=18). RHR, natural logarithm of the root-mean square of successive differences multiplied by twenty (LnRMSSD), and subjective wellbeing (LnWellness) were acquired daily. Effect sizes±90% confidence interval showed that for linemen, LnRMSSD decreased (moderate) on day 2 (71.2±10.4) and increased (moderate) on day 12 (87.1±11.2) relative to day 1 (77.9±11.2) while RHR decreased (small–moderate) on days 6, 7, and 12 (67.7±9.3–70.4±5.5 b∙min-1) relative to day 1 (77.1±10.1 b∙min-1). For non-linemen, LnRMSSD increased (small–large) on days 3–5, 7, 12, and 13 (83.4±6.8–87.6±8.5) relative to day 1 (80.0±6.5) while RHR decreased (small–large) on days 3–9, 12, and 13 (62.1±5.2–67.9±8.1 b∙min-1) relative to day 1 (70.8±6.2 b∙min-1). Decrements in LnWellness were observed on days 4–10 and 13 for linemen (moderate) and on days 6–9, 12, and 13 for non-linemen (small–moderate). Despite reductions in LnWellness, cardiac-autonomic parameters demonstrated responses consistent with heat-acclimation, which possibly attenuated fatigue-related decrements.