Highlights from our latest study in JSCR. Full-text available here.
We aimed to determine how 10 min of post-resistance exercise cycling affects aortic stiffness responses and next day recovery markers in well-trained men.
– A 10-min bout of air bike cycling was ineffective at countering acute RE-induced increases in cfPWV (aortic stiffness), likely because of the rapid and unanticipated cfPWV return to baseline by Post-RE 15min in both conditions (intervention & control).
– Accelerated post-RE cfPWV normalization may be an adaptation to habitual RE, as acute RE-induced aortic stiffness typically persists for >60 min in less experienced lifters.
– Thus, targeting the attenuation of acute post-RE increases in cfPWV is likely unnecessary, but whether the intervention exerts chronic effects, such as limiting long-term RT-induced increases in resting cfPWV, remains TBD.
– Despite no effect of the intervention on cfPWV at the group level, it altered changes at the individual level, such that those with a lower relative cycling power output at the target HR exhibited greater reductions in cfPWV.
– This may indicate that lifters with lower aerobic fitness may derive greater AE-induced destiffening effects after acute RE. – Finally, the AE intervention neither enhanced nor impaired recovery indicators (HRV, subjective, barbell velocity), alleviating concerns about short-term AE interfering with next-day recovery status or performance.
Many of us have learned the hard way to stop training when we’re sick, and to ease back into it as we recover. In 2012, I contracted the hand/foot/mouth (HFMD) virus from my nephews. It was awful. After symptoms resolved, my training resumed with a deload week. Taking it easy, it took ~9 days after symptoms cleared for my 7-day rolling HR and LnRMSSD averages to return to within 1 standard deviation (SD) of pre-infection values (14-d baseline) (Fig. 1). These HRV values were obtained in the standing position after waking.
Fig 1. RMSSD and HR responses to HFMD virus.
I’ve observed the same general standing HRV pattern in every subsequent illness, with the time-course of HRV recovery proportional to the severity of illness. I recently had COVID. Predictably, I observed a very similar HRV response. It took ~10 days post-symptom resolution for my standing values to normalize. Training was even more conservative than post-HFMD since I’m getting older (and somewhat wiser, hopefully).
However, unlike in previous cases of illness, this time I also had nocturnal HRV and sleep data from my Oura ring. Without careful interpretation, it would seem that HRV responses (standing vs. nocturnal) reveal largely contradictory responses. This is problematic if one were trying to use HRV, or “Readiness” scores based largely on HR or HRV, to guide training decisions post-illness (or any time for that matter). Which should you follow? The data and my interpretations are shared below.
Supine vs. Standing HRV
First, I’ll address why nocturnal and standing HRV are different. Nocturnal HRV is acquired during sleep, representing parasympathetic function under passive conditions, largely undisturbed by our wakeful thoughts and emotions. HRV should peak during sleep, reflecting healthy circadian variation in ANS activity, which is associated with nocturnal blood pressure dipping and a lower risk of cardiovascular diseases. Contrastingly, standing HRV captures the ANS response to a mild challenge. Blood wants to pool in the legs when standing, which would cause hypotension, limit blood supply to the brain, and cause dizziness or fainting if not for properly functioning counteractive mechanisms. Baroreceptors detect reduced blood pressure following postural change, resulting in a reflexive increase in HR and vasoconstriction to maintain blood pressure. In healthy people, there is a sudden HR response (↓parasympathetic activity) followed by a quick recovery. However, when sick or stressed (mental, physical, etc.), the HR response may be exaggerated and slower to recover.
By measuring HR/HRV ~1 min after standing, we can observe how efficiently the ANS is adapting to a minor challenge. In fact, ANS testing in clinical settings typically involves a series of reflex tests. These include HR or HRV responses to deep breathing, orthostatic stress (standing), isometric handgrip, etc. This is because abnormalities are more likely to be revealed when the ANS is challenged. It always seemed intuitive to me that if we wanted to use HRV as an indicator of how we may adapt to physical stress (i.e. training), we should measure HRV in response to a little bit of physical stress.
COVID
Four hours before my flight to San Diego for the ACSM Annual meeting, I was walking the dog when my wife texted me a picture of her positive COVID test. Thus, I cancelled my flights, cared for my ill wife, and waited to get sick. Two days later, I woke up with a sinus headache and both my nocturnal and standing HRV were substantially reduced (good agreement between responses). A sore throat came on day 2 and stuck around for 5-6 days. My average ambulatory HR measured continuously throughout the first few days by Oura was ~10 bpm higher than usual, despite being more sedentary. My appetite increased dramatically to compensate. I attempted some HRV biofeedback sessions with limited success (screenshot comparison of sessions with and without COVID below). Coughing up phlegm was my last symptom to clear.
Fortunately, work stress and other obligations were minimal throughout this period. Light exercise (zone 2 air bike) and desk work resumed on 06/09, corresponding with my first “normal” standing daily RMSSD value. Thereafter is where nocturnal and standing HRV patterns diverge (Fig. 2). Nocturnal RMSSD increases above baseline post-symptoms, whereas standing RMSSD remains mostly suppressed.
Fig 2. Nocturnal and Standing HR and HRV trends pre-, during, and post-COVID symptoms
Thus, Oura is telling me that my “readiness” is high (some of the highest scores I’ve recorded to date) (Fig. 3). Contrastingly, standing RMSSD values are telling me to gear down, that things aren’t quite normal yet.
Fig. 3. Sleep duration and daily Oura Readiness scores.
Why the discrepancy?
Although I was feeling pretty much back to normal post-symptoms, when I resumed work and light exercise, I was exhausted by the end of the day (but not during the day). I was falling asleep on the couch by ~9 pm (normal bed time 10-10:30 pm). I was also sleeping longer than usual (Fig. 3). My average total sleep duration for May was 401 min, whereas for the first 10 days post-symptoms, I averaged 429 min. Clearly, I had increased sleep needs. Interestingly, my total sleep time was the strongest correlate (vs. sleep stages, efficiency, etc.) of my nocturnal RMSSD (Fig 4).
Fig. 4. Association between nocturnal RMSSD and HR Grey dots represent baseline. Vertical line at 401 min represents mean sleep duration from previous month
However, the association between sleep duration and standing HRV reverses post-symptoms (Fig. 5). You can see in Fig. 2 and Fig 5. that my standing RMSSD trends to baseline as my total sleep duration trends to baseline. Thus, my standing HRV remained suppressed apparently until my sleep duration returned towards normal. Reduced sleep duration in this instance likely reflects that my body no longer needed the extra rest, and by returning to baseline at this time, my standing HRV suggests the same thing. I also stopped falling asleep on the couch and returned to my habitual sleep/wake time.
Fig. 5. Association between standing RMSSD and sleep duration during and post-symptoms. Vertical line at 401 min represents mean sleep duration from previous month.
Saturation?
My first instinct was that my increase in nocturnal RMSSD was probably a result of reduced saturation effects. This is a poorly understood concept and creates a lot of confused wearable users. Essentially, there is an inverse linear relationship between HR and RMSSD (as HR decreases, RMSSD increases) until ~50-55 bpm, at which point RMSSD starts to decrease, reflecting a quadratic relationship. This phenomenon is well documented in numerous studies, yet is poorly conveyed to users by wearable companies. There’s a strong possibility that if your HR is <50 bpm (i.e., fit individuals), your nocturnal RMSSD is reduced due to saturation. The mechanism seems to be that very high parasympathetic activity saturates cholinergic receptors in the myocardium, resulting in sustained inhibitory effects on the SA node, causing a slow HR with reduced respiratory sinus arrhythmia (thus, reduced RMSSD).
Practically, this means that if you are typically experiencing saturation due to a very low HR (as I often do with nocturnal value), increased stress can increase your HR out of the saturation zone and thus result in increased RMSSD. This is entirely counterintuitive because you’d expect more stress = increased HR and reduced RMSSD. I receive more emails from wearable users over this issue than any other.
Fig. 6 below clearly shows a quadratic association between nocturnal RMSSD and HR, suggesting that reduced saturation effects may be contributing to the increased nocturnal RMSSD post-symptoms. This is unlike the expected linear association observed in my standing values, where HR is mostly > 55 bpm (Fig).
Fig. 6. Association between HR and RMSSD for nocturnal and standing values.
However, when I adjust for HR (by dividing RMSSD by HR), it shows that nocturnal RMSSD was increased, independent of changes in HR (Fig. 7). This suggests that the elevated RMSSD was unlikely due to reduced saturation effects, alone. Thus, in this case, it seems that RMSSD was increased due to greater parasympathetic modulation.
Fig. 7. Nocturnal and standing RMSSD/HR
While it’s tempting to interpret longer sleep duration (often a good thing) and higher nocturnal RMSSD (also often a good thing) as signs of high readiness to train, that’s obviously incorrect in this context. I interpret these responses to reflect higher recovery demands and processes from lingering effects of the illness, plus the additional stress from resuming work and exercise (even at low intensity and volume). This is supported by the fact that my ANS was not yet able to respond as efficiently as usual to the minor stress of standing within the first several days post-symptoms.
Conclusion
Nocturnal values provided valuable insight regarding my sleep patterns and nightly ANS activity during and after COVID. However, taken alone and out of context, one could easily misinterpret these changes to support resumption of intense training. Thus, standing HRV also provided important insight, showing that my ANS was poorly adaptive to a mild physical challenge post-symptoms. Taken together and in context, the appropriate interpretation is likely that I was still adjusting and recovering from the illness (greater sleep/recovery needs and enhanced nocturnal parasympathetic activity to support them), and that intense training would be poorly tolerated (suppressed HRV in response to standing, a minor physical challenge). Consequently, exercise remained light (air bike, body weight circuits, deload-style lifting) until standing HRV finally normalized at ~10 days post-symptoms, which corresponded fairly well with the return of my sleep duration to normal values. Therefore, nocturnal and standing HRV were both valuable, but different. These are not interchangeable values.
I’ll finish with a brief thought on “Readiness” scores and the misguided idea that HRV is somehow analogous to a % recovery meter. I used to think that despite often being wrong and creating false expectations of what HRV is, that readiness scores were relatively harmless. I am now of the opinion that circumstances exist where readiness scores can be harmful. We should use these tools to identify pattern-changes in the data and interpret them in context, but we should not use these tools for their automated algorithms and training advice (e.g. from a wearable below).
If success leaves clues, then there was something to learn from what Dan Howells & staff did to prepare GB 7s for the 2016 Olympics where they advanced to the gold medal final with an undefeated record.
After sorting through the data (HRV, wellness, training load) and having several video and email conversations with Dan, we decided to share the story of their Olympic expedition.
Prior to analyzing the data or obtaining specific details from Dan, I anticipated substantial decrements in status markers in response to a full day in transit (travel fatigue/jet lag, etc.), pre-tournament (arousal/anxiety), & throughout the tournament (match fatigue, sleep loss).
However, data showed minimal effects of travel (decrements mostly in non-starters), no evidence of pre-competitive anxiety (values improved pre-match), & intra-tournament decrements (small in magnitude) comparable to a previous domestic tournament.
Essentially, the data suggest that the team travelled across multiple time zones, adjusted to a foreign environment, and competed successfully on the worlds biggest stage with hardly any indication of stress or fatigue. Incredible!
Although we can’t say for sure that the strategies employed by staff can explain the findings (no control group, unfortunately), we felt that the details were worth sharing.
The paper discusses various proactive and reactive interventions that were used to support training adaptation, manage travel and competition related stress/fatigue, and aid recovery in players.
I’m very grateful to Dan and staff for the collaboration and for being open with these details. There is tremendous vulnerability in giving everyone access to how you do things. Thank you, Dan. You shared tremendous insights that many coaches and players can benefit from.
As part of my PhD work at Alabama, we tracked HRV in football players from day 1 of preseason training through to the national championship. A practical summary of some key findings follow the full-text link below.
Fluctuations in HRV are expected throughout a season. However, chronically suppressed values are cause for concern. Sustained parasympathetic hypoactivity is associated with various pathological conditions and is a hallmark of stress and impaired recovery in athletes.
We learned from spring camp that day-to-day HRV recovery was delayed in linemen vs. the smaller and more aerobically fit skill players. Thus, we anticipated that linemen would be more susceptible to attenuated HRV throughout the season.
HRV started to decline by week 6 of the competitive period for linemen. A couple notable events occurred here: 1) the first of 5 consecutive SEC match-ups vs Top 25 nationally-ranked opponents and 2) the week of mid-term exams for many players.
Although significant group-level reductions for linemen weren’t observed until later, key players showed descending HRV by mid-season, in the absence of changes in PlayerLoad. Suppressed HRV preceded illness and injury in 2 starters. Temporary rest restored HRV.
Group-level reductions occurred during an intensive camp-style preparation period for the college football playoffs following the SEC championship. Most players took a hit to their HRV, but linemen were hit the hardest. Note magnitudes of the effect sizes in the table below.
HRV remain suppressed for linemen through prep weeks for the national semi-final and the national championship. Smaller decrements (non-significant) were observed for skill players. In addition to accumulating physical stress, psycho-emotional factors (pre-competitive anxiety, pressure to perform, media attention, etc) likely contributed.
Although we emphasize the toll of a season on linemen, some skill players also showed suppressed values. The table below shows the rate of change in HRV for all players. 25% of skill and 63% of linemen showed sig. descending HRV patterns throughout the season.
Linemen experience hypertension, arterial stiffening, and pathologic LV hypertrophy following 1 or more seasons. These maladaptations are possibly preceded by ANS imbalance. We hypothesize that larger players showing the worst HRV profiles suffer the greatest decrement in cardiovascular health markers.
If so, intervening when a decreasing HRV pattern is observed may not only be relevant to performance (limiting fatigue, injury-, and infection-risk), it may also help mitigate the cardiovascular toll of playing football at such a high level. Seeking funding to explore this in the future.
The findings highlight potential deficiencies in or greater taxation to the coping capacity of linemen vs. smaller players. Factors hypothesized to contribute to more prevalent ANS imbalance in linemen and potential implications for health and performance are summarized below.
Linemen need careful attention and monitoring. We need strategies to prevent ANS imbalance from occurring (load management, aerobic capacity, treatment of health conditions like sleep apnea, etc) and we need restorative methods to implement if it occurs.
Tracking HRV with a mobile app was inexpensive and easy. Time-demand from players was ~3 min/week while waiting to get taped. Though sub-optimal relative to post-waking measures, this approach enabled timely detection of descending patterns, which may be useful for guiding interventions relevant to player health and wellbeing.
Though a better understanding of the health and performance ramifications of suppressed HRV in football players is needed, a descending pattern may serve as an easily identifiable red flag requiring attention from performance and medical staff.
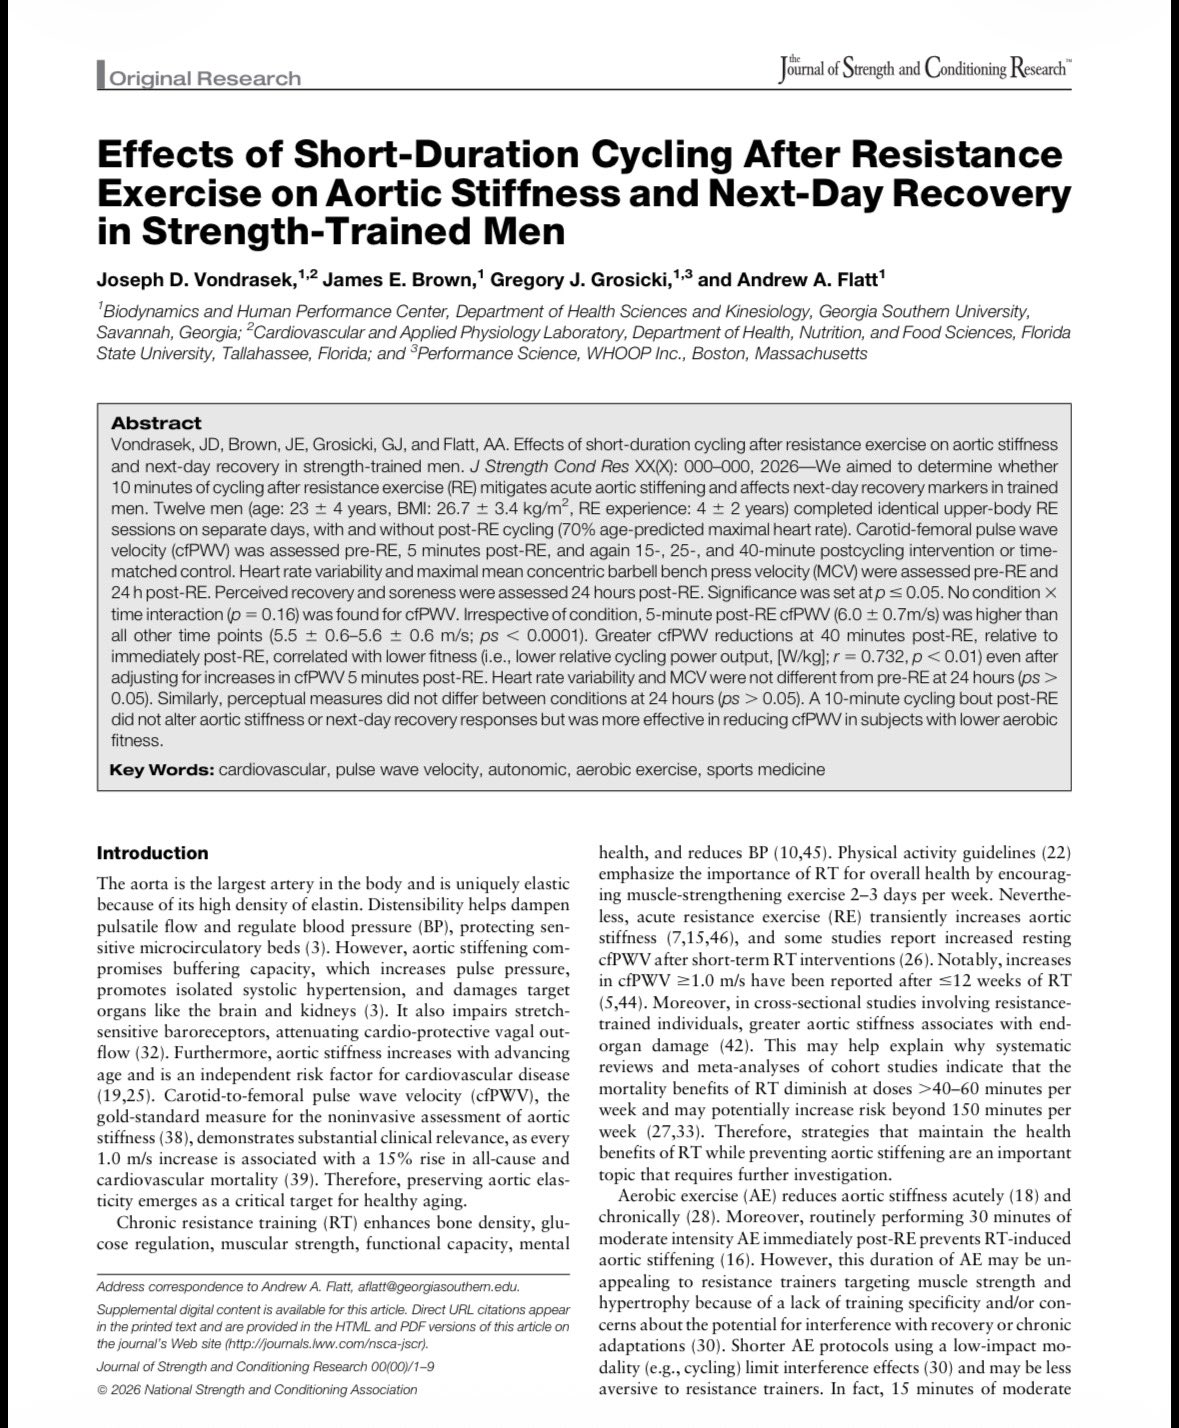
Context: we previously resorted to standardized HRV measures performed in the athletic training room with college football players to overcome non-compliance with post-waking tests.
Problem: pre-training hydration practices confound HRV measures. Players typically opt for cold bottles of water or Gatorade. Thus, we needed to determine how much and for how long these drinks impacted HRV.
Findings: Gatorade had small effects that lasted about 45 min. Effects of water were larger and persisted for 60 min.
Key points:
If measuring HRV in a lab/clinic/training facility, be mindful of recent fluid ingestion. HRV measures obtained within 60 min of 591 ml water or 45 min of an equal volume of Gatorade will be capturing their physiology effects and result in falsely elevated values. This would result in misinterpretation of autonomic status.
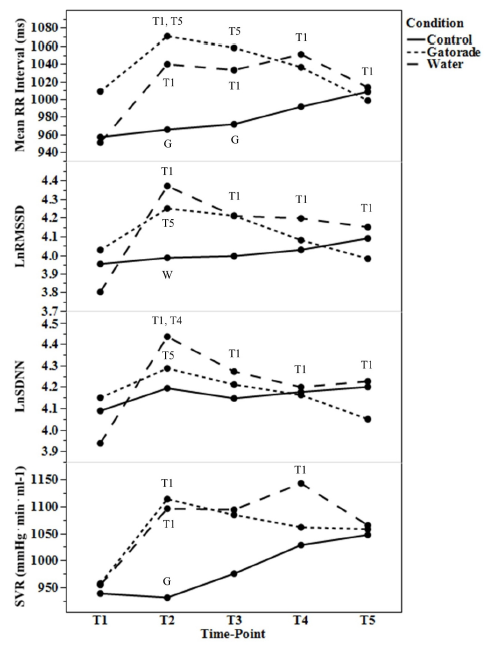
We quantified associations between changes in heart rate variability (HRV), neuromuscular and perceptual recovery following intense resistance training (RT). Adult males (n = 10) with >1 year RT experience performed six sets to failure with 90% of 10 repetition maximum in the squat, bench press, and pull-down. Changes (∆) from pre- to immediately (IP), 24 and 48 h post-RT were calculated for neuromuscular performance markers (counter-movement jump peak power and mean concentric bench press and squat velocity with load corresponding to 1.0 m∙s−1) and perceived recovery and soreness scales. Post-waking natural logarithm of the root-mean square of successive differences (LnRMSSD) in supine and standing positions were recorded pre-RT (5 day baseline), IP and two mornings post-RT. All parameters worsened at IP (p < 0.05). LnRMSSD measures were not different from baseline by 24 h. Neuromuscular markers were not different from pre-RT by 48 h. Perceptual measures remained suppressed at 48 h. No significant associations among ∆ variables were observed (p = 0.052–0.978). These data show varying timeframes of recovery for HRV, neuromuscular and perceptual markers at the group and individual level. Thus, post-RT recovery testing should be specific and the status of one metric should not be used to infer that of another.
Thanks to Christoph Schneider for inviting my collaboration on this new study from his PhD work. The full-text can be viewed here.
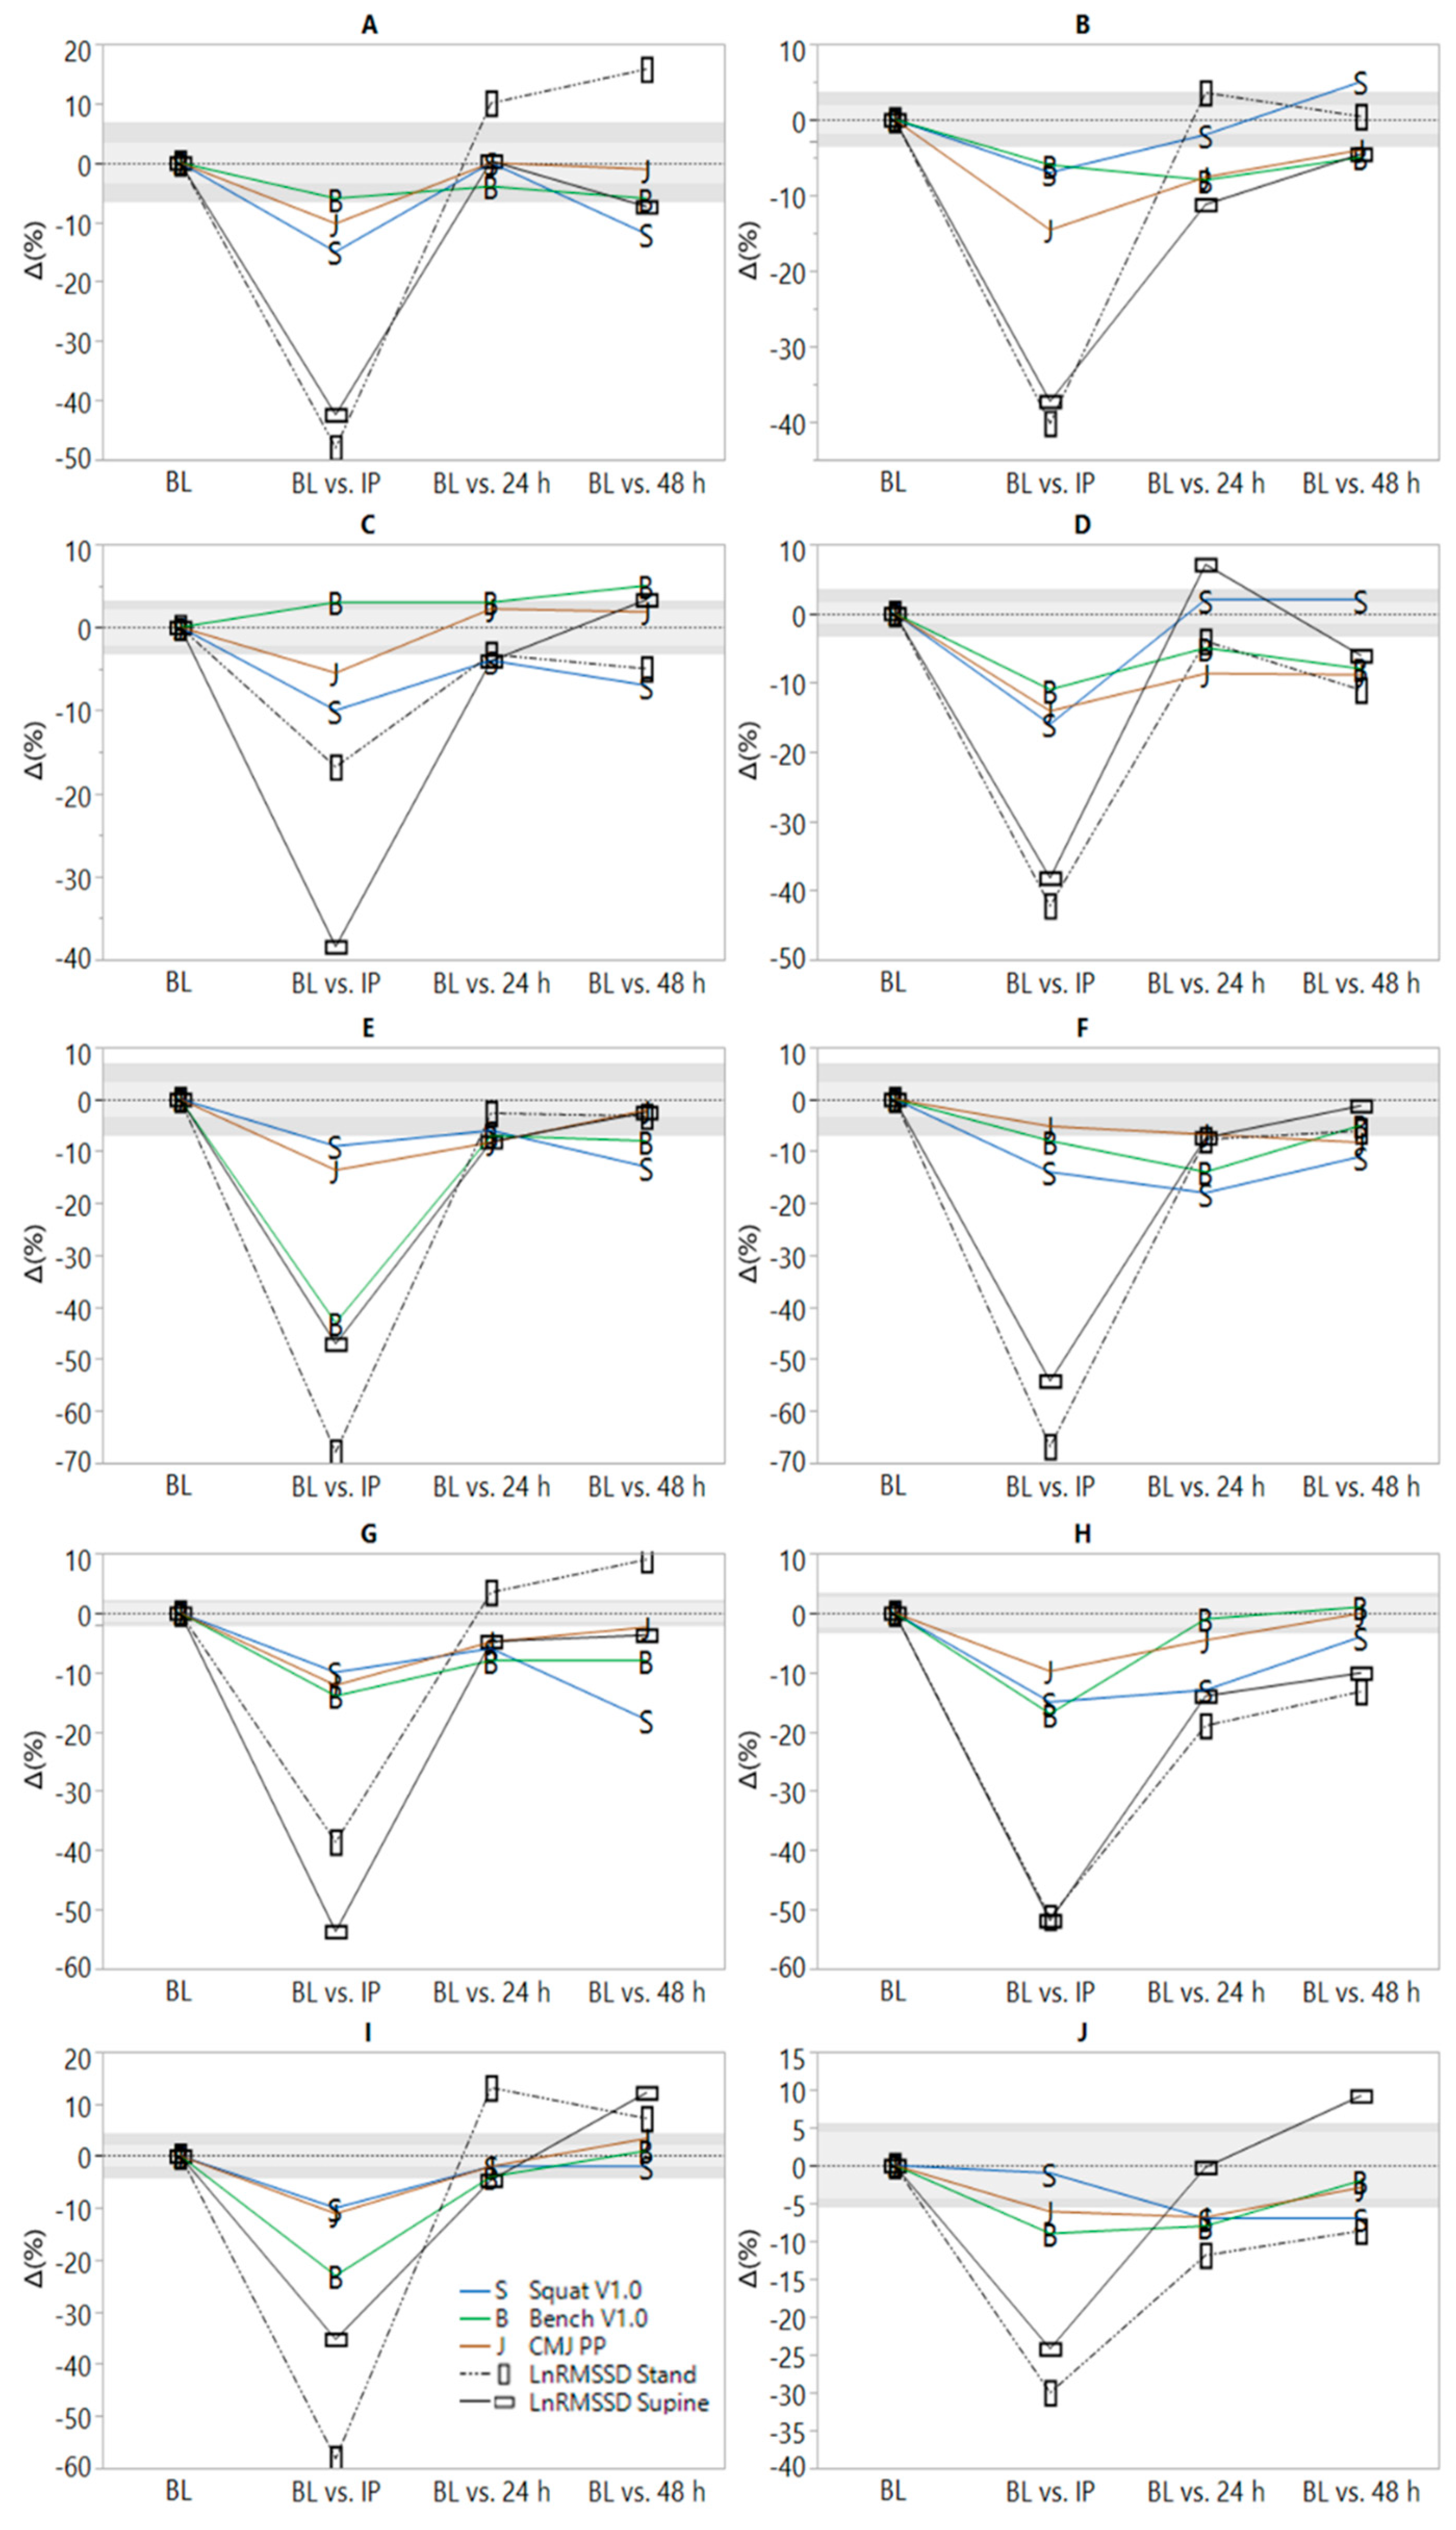
Heart Rate Variability Monitoring During Strength and High-Intensity Interval Training Overload Microcycles
Abstract
Objective: In two independent study arms, we determine the effects of strength training (ST) and high-intensity interval training (HIIT) overload on cardiac autonomic modulation by measuring heart rate (HR) and vagal heart rate variability (HRV).
Methods: In the study, 37 well-trained athletes (ST: 7 female, 12 male; HIIT: 9 female, 9 male) were subjected to orthostatic tests (HR and HRV recordings) each day during a 4-day baseline period, a 6-day overload microcycle, and a 4-day recovery period. Discipline-specific performance was assessed before and 1 and 4 days after training.
Results: Following ST overload, supine HR, and vagal HRV (Ln RMSSD) were clearly increased and decreased (small effects), respectively, and the standing recordings remained unchanged. In contrast, HIIT overload resulted in decreased HR and increased Ln RMSSD in the standing position (small effects), whereas supine recordings remained unaltered. During the recovery period, these responses were reversed (ST: small effects, HIIT: trivial to small effects). The correlations between changes in HR, vagal HRV measures, and performance were weak or inconsistent. At the group and individual levels, moderate to strong negative correlations were found between HR and Ln RMSSD when analyzing changes between testing days (ST: supine and standing position, HIIT: standing position) and individual time series, respectively. Use of rolling 2–4-day averages enabled more precise estimation of mean changes with smaller confidence intervals compared to single-day values of HR or Ln RMSSD. However, the use of averaged values displayed unclear effects for evaluating associations between HR, vagal HRV measures, and performance changes, and have the potential to be detrimental for classification of individual short-term responses.
Conclusion: Measures of HR and Ln RMSSD during an orthostatic test could reveal different autonomic responses following ST or HIIT which may not be discovered by supine or standing measures alone. However, these autonomic changes were not consistently related to short-term changes in performance and the use of rolling averages may alter these relationships differently on group and individual level.
Our latest study investigates the relationship between subjective indicators of recovery status and HRV among NCAA Division 1 sprint-swimmers. The main findings were:
1) Perceived sleep quality showed the strongest relationship with post-waking LnRMSSD.
2) LnRMSSD demonstrated stronger associations with subjective parameters than resting heart rate.
We report both group and individual relationships. The full text is available here.
Heart rate variability (HRV) is a physiological marker of training adaptation among athletes. However, HRV interpretation is challenging when assessed in isolation due to its sensitivity to various training and non-training-related factors. The purpose of this study was to determine the association between athlete-self report measures of recovery (ASRM) and HRV throughout a preparatory training period. Ultra-short natural logarithm of the root mean square of successive differences (LnRMSSD) and subjective ratings of sleep quality, fatigue, muscle soreness, stress and mood were acquired daily for 4 weeks among Division-1 sprint-swimmers (n = 17 males). ASRM were converted to z-scores and classified as average (z-score −0.5–0.5), better than average (z-score > 0.5) or worse than average (z-score < −0.5). Linear mixed models were used to evaluate differences in LnRMSSD based on ASRM classifications. LnRMSSD was higher (p < 0.05) when perceived sleep quality, fatigue, stress and mood were better than average versus worse than average. Within-subject correlations revealed that 15 of 17 subjects demonstrated at least one relationship (p < 0.05) between LnRMSSD and ASRM variables. Changes in HRV may be the result of non-training related factors and thus practitioners are encouraged to include subjective measures to facilitate targeted interventions to support training adaptations.
Figure 1
Effect sizes ± 90% confidence interval for resting heart rate parameters relative to subjective categorization.
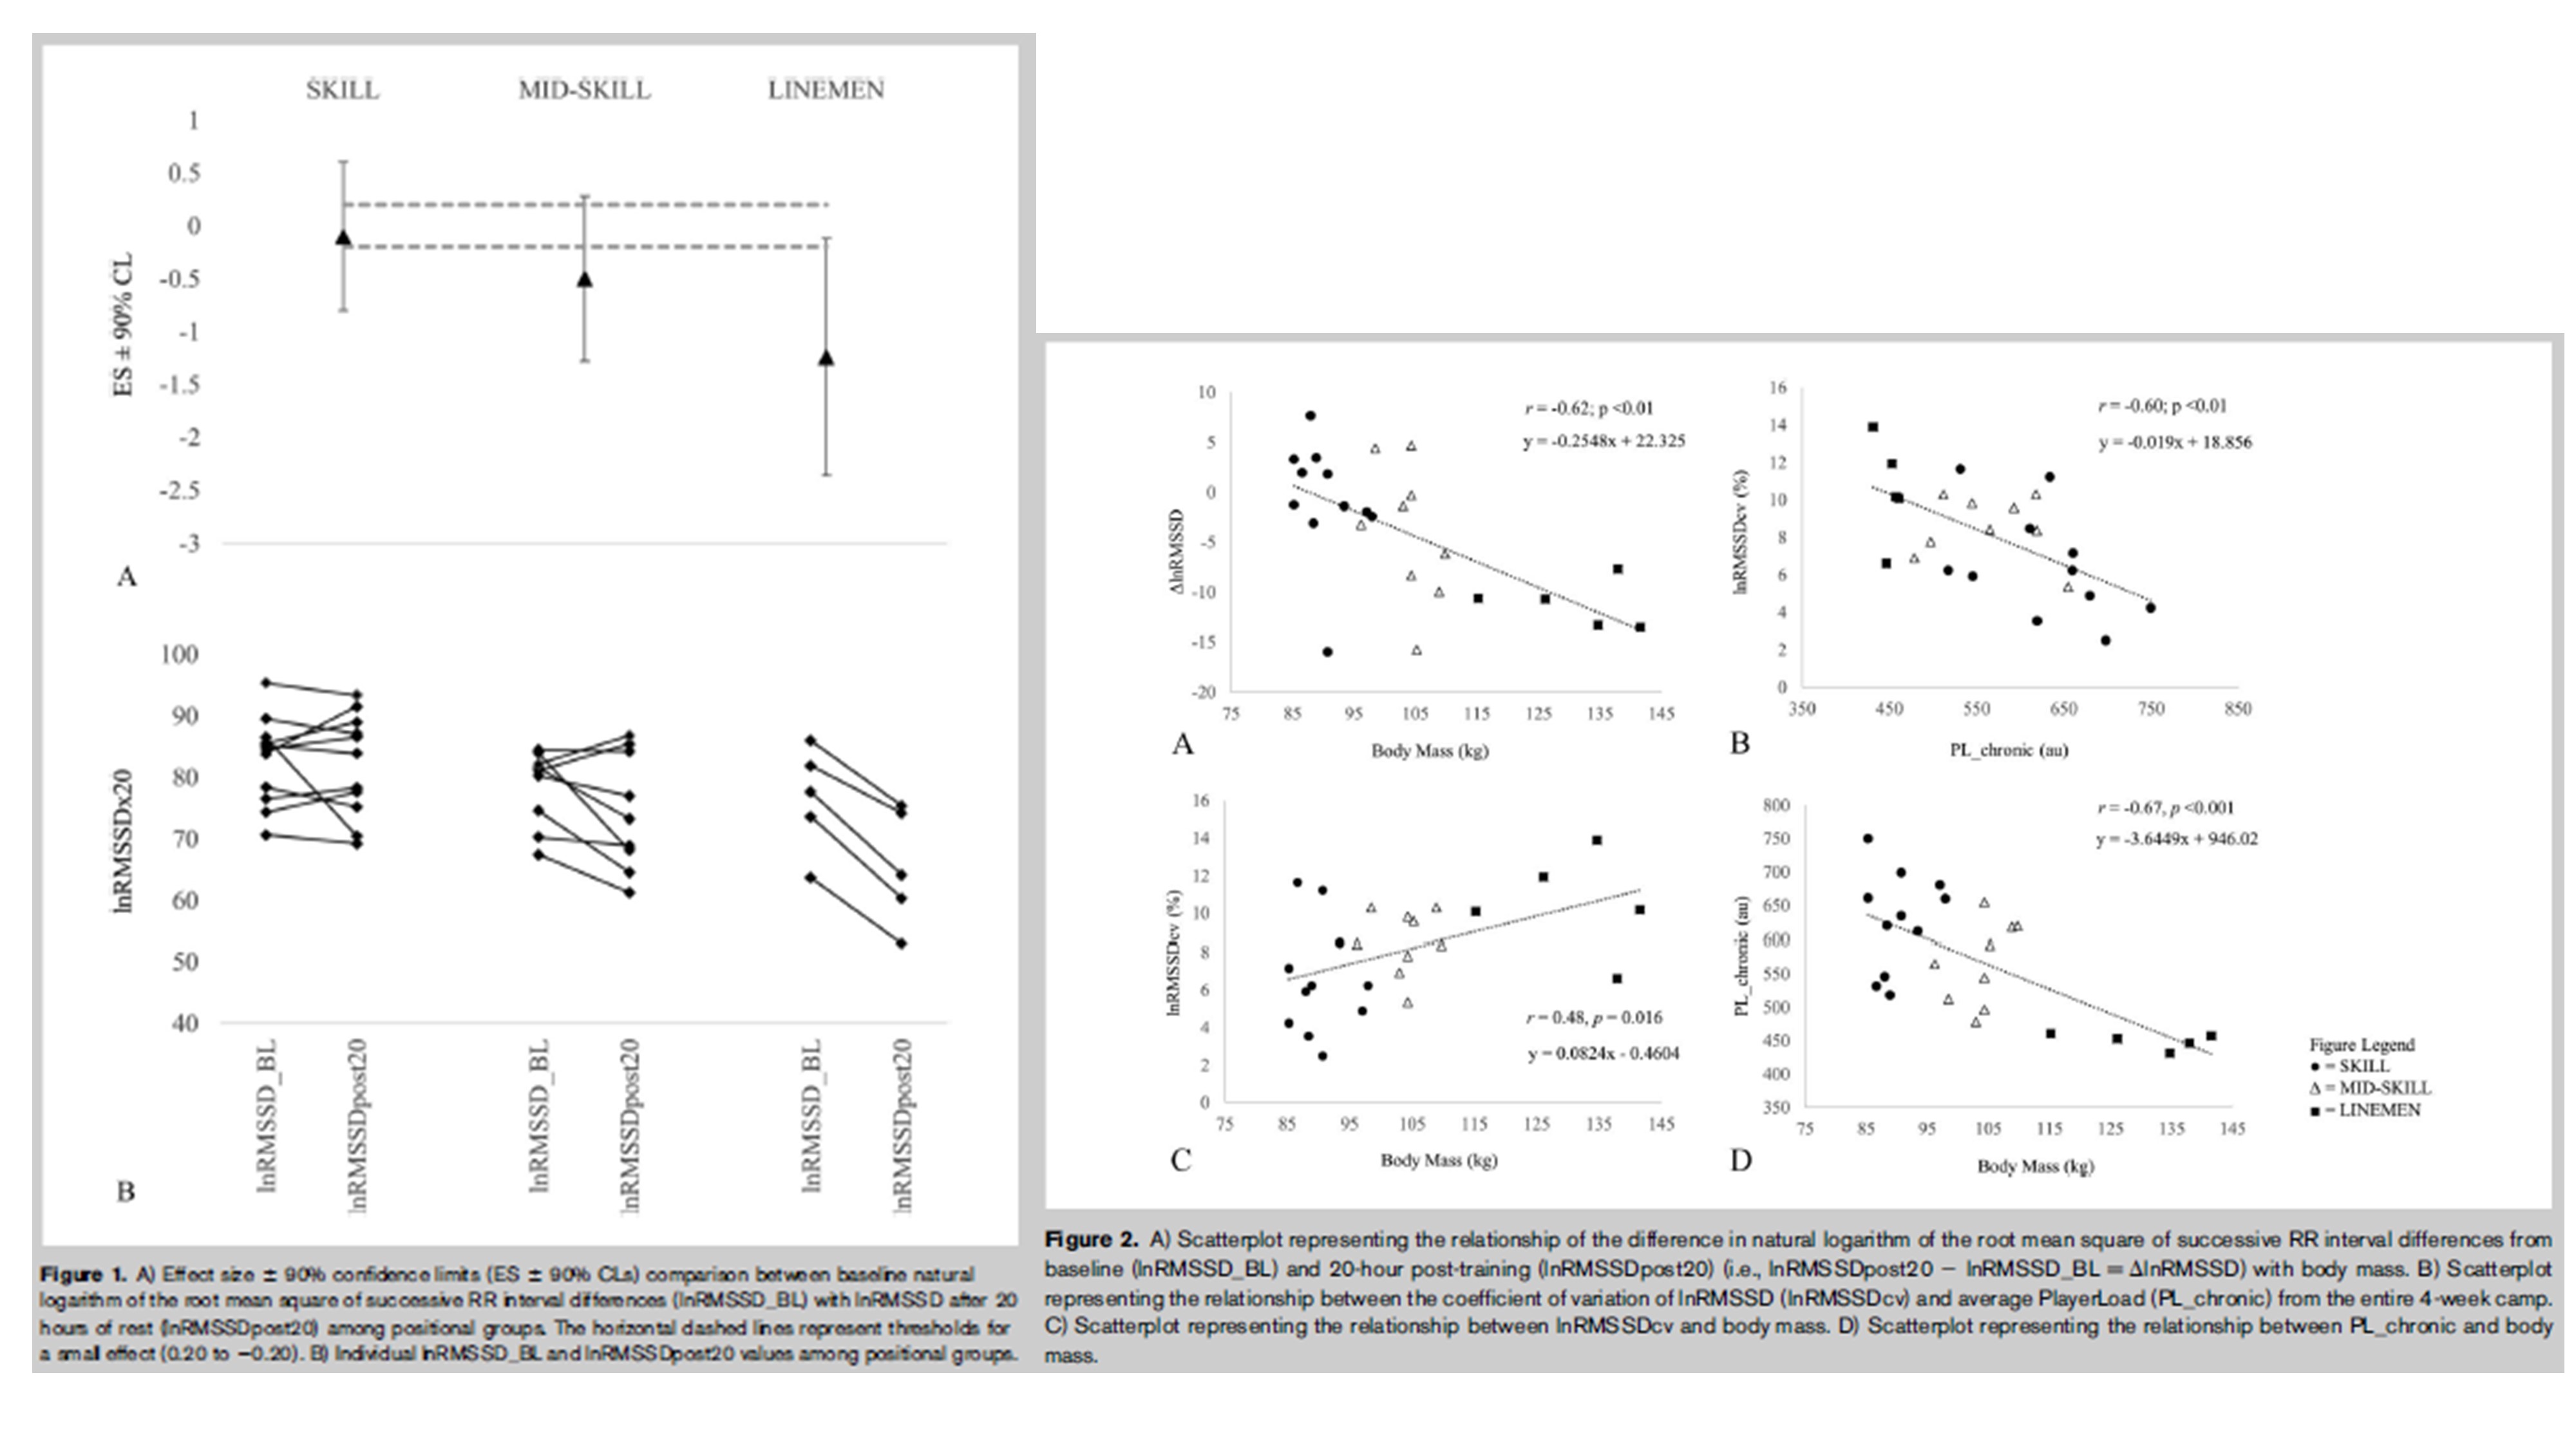
During spring training camp, we found that Linemen demonstrate the greatest reductions in LnRMSSD at ~20 h post-training, followed by Mid-Skill and Skill, possibly reflecting inadequate cardiovascular recovery between consecutive-day sessions for the larger players, despite lower PlayerLoad values. (Full-text available here)
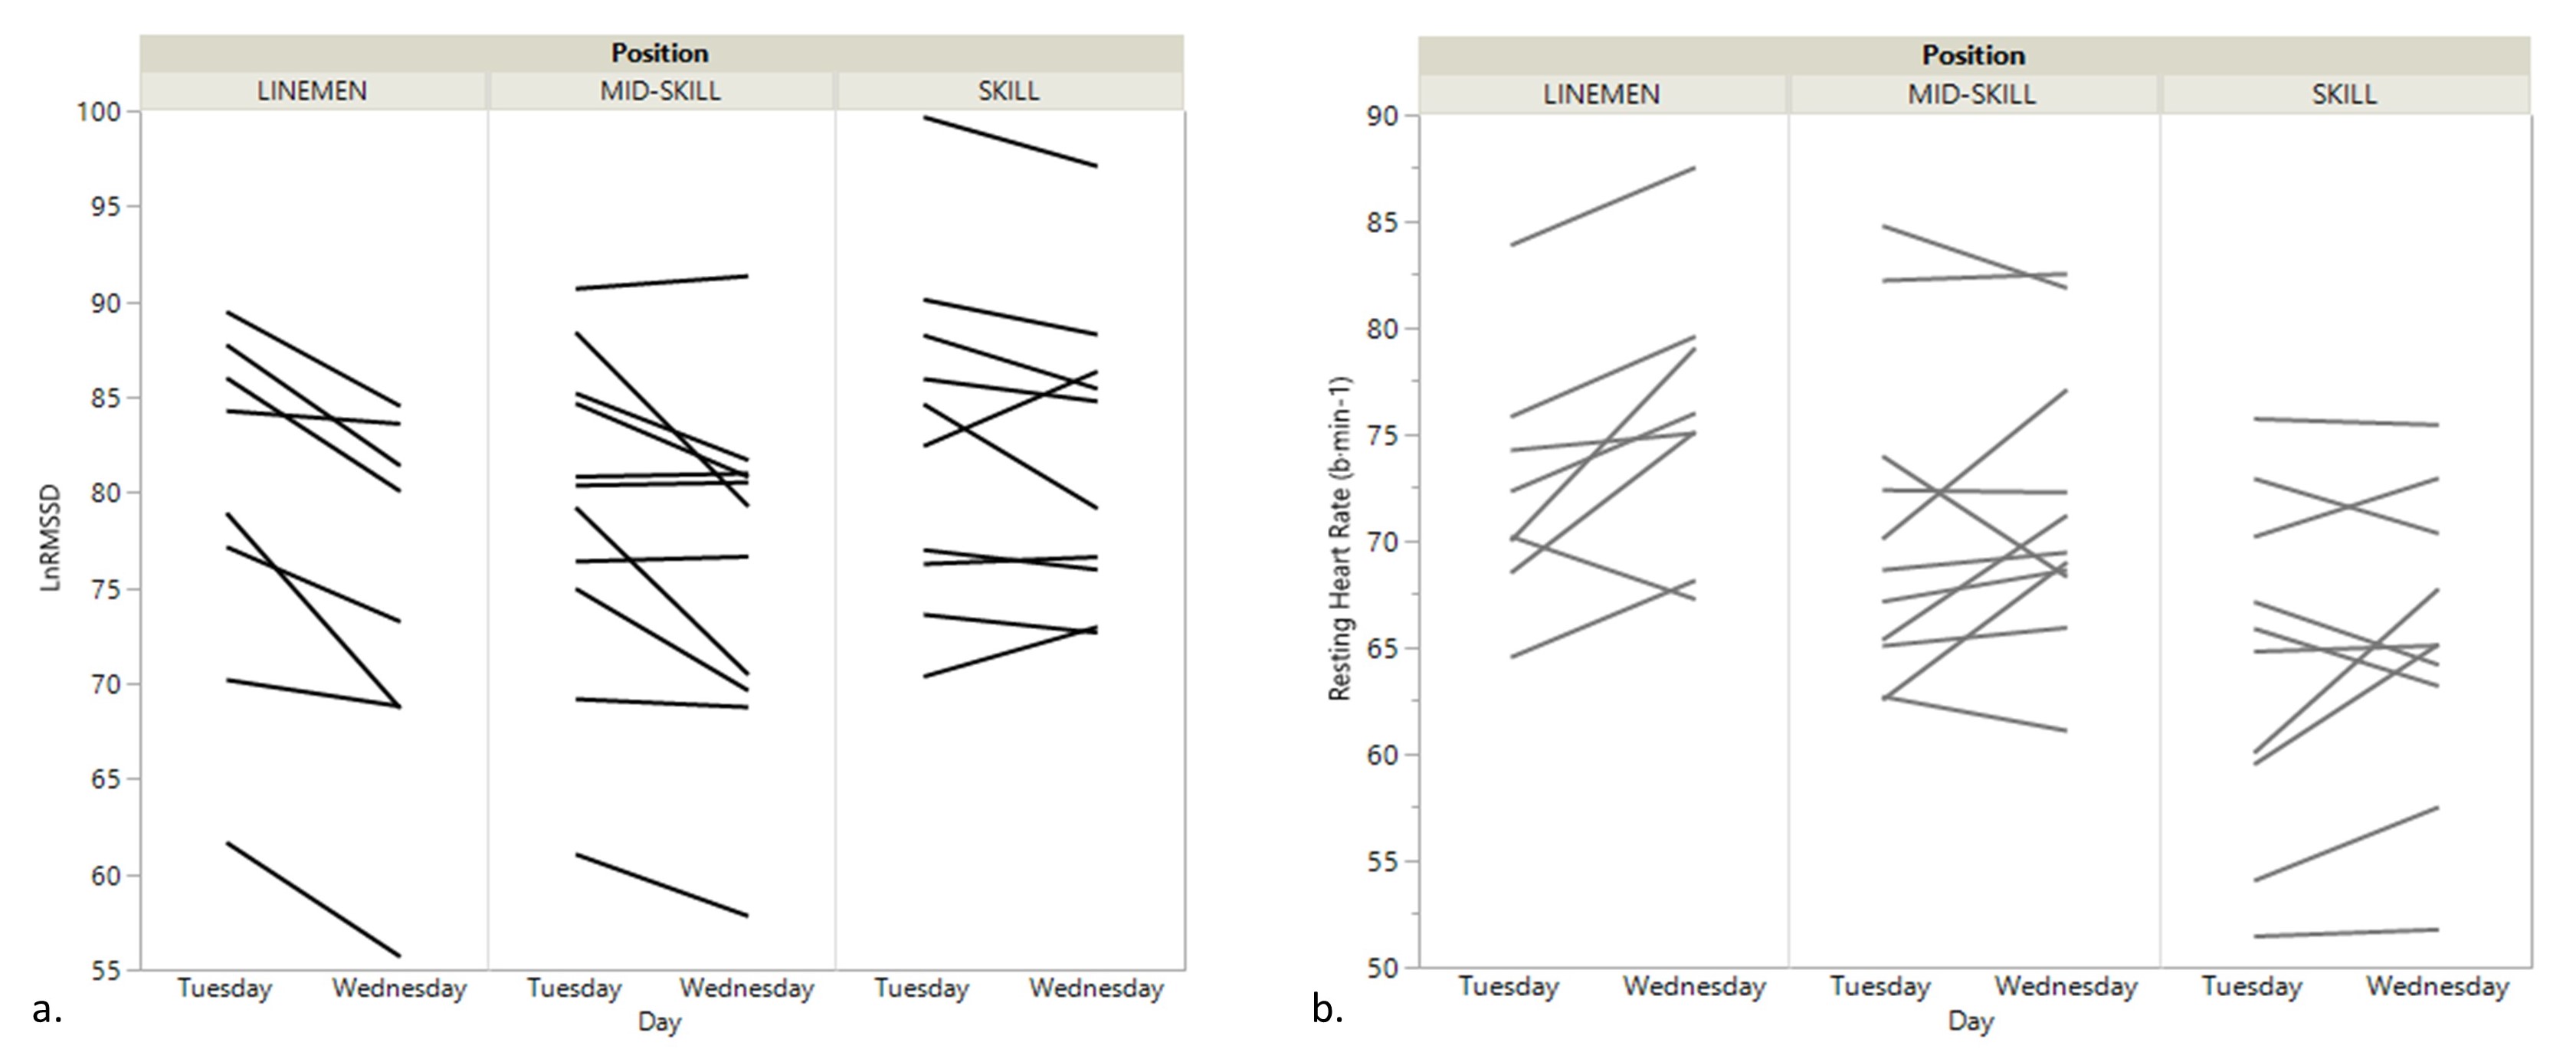
Our first follow-up study during the early part of the competitive season found the same position-based trend, where Linemen demonstrated the greatest reductions in LnRMSSD at ~20 h post-training, followed by Mid-Skill and Skill. However, the magnitude of the reductions in LnRMSSD during the in-season were smaller relative to spring camp. We speculate that both reduced PlayerLoad values (15-22% lower than spring camp) and adaptation to intense preseason training in the heat and humidity during the preceding weeks account for the smaller LnRMSSD reductions observed during the early part of the competitive season. (Full-text available here: Cardiac_Autonomic_Responses_to_In_Season_Training_Among_Division1_College_Football_Players)
Cardiac-Autonomic Responses to In-Season Training Among Division-1 College Football Players.
Despite having to endure a rigorous in-season training schedule, research evaluating daily physiological recovery status markers among American football players is limited. The purpose of this study was to determine if recovery of cardiac-autonomic activity to resting values occurs between consecutive-day, in-season training sessions among college football players. Subjects (n = 29) were divided into groups based on position: receivers and defensive backs (SKILL, n = 10); running backs, linebackers and tight-ends (MID-SKILL, n = 11) and linemen (LINEMEN, n = 8). Resting heart rate (RHR) and the natural logarithm of the root-mean square of successive differences multiplied by twenty (LnRMSSD) were acquired at rest in the seated position prior to Tuesday and Wednesday training sessions and repeated over three weeks during the first month of the competitive season. A position × time interaction was observed for LnRMSSD (p = 0.04), but not for RHR (p = 0.33). No differences in LnRMSSD between days was observed for SKILL (Tuesday = 82.8 ± 9.3, Wednesday = 81.9 ± 8.7, p > 0.05). Small reductions in LnRMSSD were observed for MID-SKILL (Tuesday = 79.2 ± 9.4, Wednesday = 76.2 ± 9.5, p < 0.05) and LINEMEN (Tuesday = 79.4 ± 10.5, Wednesday = 74.5 ± 11.5, p < 0.05). The individually averaged changes in LnRMSSD from Tuesday to Wednesday were related to PlayerLoad (r = 0.46, p = 0.02) and body mass (r = -0.39, p = 0.04). Cardiac-parasympathetic activity did not return to resting values for LINEMEN or MID-SKILL prior to the next training session. Larger reductions in LnRMSSD tended to occur in players with greater body mass despite having performed lower workloads, though some individual variability was observed. These findings may have implications for how coaches and support staff address training and recovery interventions for players demonstrating inadequate cardiovascular recovery between sessions.
Our next paper, currently in production, will feature HRV responses among positions throughout the entire preparatory and competitive season.
For our first study with football, we wanted to determine if cardiovascular recovery from training varied among positional groups (i.e., Skill, Mid-Skill and Linemen). We also looked at some longitudinal relationships between cardiac-autonomic and training load parameters throughout spring camp.
We found that Linemen take longer to recover between training sessions than the other positions. This may have important implications for the competitive season because despite differences in recovery time among positional groups, football teams train on a fixed schedule. This may make Linemen more susceptible to developing signs and symptoms of overtraining, getting hurt or sick, etc. Fortunately, we captured data from the competitive season, too. That paper is forthcoming. Full-text link:
The purpose of this study was to determine whether recovery of cardiac-autonomic activity to baseline occurs between consecutive-day training sessions among positional groups of a collegiate football team during Spring camp. A secondary aim was to evaluate relationships between chronic (i.e., 4-week) heart ratevariability (HRV) and training load parameters. Baseline HRV (lnRMSSD_BL) was compared with HRV after ∼20 hours of recovery before next-day training (lnRMSSDpost20) among positional groups composed of SKILL (n = 11), MID-SKILL (n = 9), and LINEMEN (n = 5) with a linear mixed model and effect sizes (ES). Pearson and partial correlations were used to quantify relationships between chronic mean and coefficient of variation (CV) of lnRMSSD (lnRMSSD_chronic and lnRMSSDcv, respectively) with the mean and CV of PlayerLoad (PL_chronic and PL_cv, respectively). A position × time interaction was observed for lnRMSSD (p = 0.01). lnRMSSD_BL was higher than lnRMSSDpost20 for LINEMEN (p < 0.01; ES = large), whereas differences for SKILL and MID-SKILL were not statistically different (p > 0.05). Players with greater body mass experienced larger reductions in lnRMSSD (r = -0.62, p < 0.01). Longitudinally, lnRMSSDcv was significantly related to body mass (r = 0.48) and PL_chronic (r = -0.60). After adjusting for body mass, lnRMSSDcv and PL_chronic remained significantly related (r = -0.43). The ∼20-hour recovery time between training sessions on consecutive days may not be adequate for restoration of cardiac-parasympathetic activity to baseline among LINEMEN. Players with a lower chronic training load throughout camp experienced greater fluctuation in lnRMSSD (i.e., lnRMSSDcv) and vice versa. Thus, a capacity for greater chronic workloads may be protective against perturbations in cardiac-autonomic homeostasis among American college football players.